
|
FastCaloSim Performance Plots 24 February 2018 | |
| Content | Preview |
|---|---|
| Figures | |
|
Figure 01: 2D GEANT4 hit position distribution in $r*\delta\eta$ and $r*\delta\phi$ coordinates (with $r=\sqrt{(\delta\eta)^{2} + (\delta\phi)^{2}}$) weighted by hit energy in FCal 1. $\delta\eta$ and $\delta\phi$ variables are calculated from the differences between the hit position and the true particle position extrapolated to FCal 1. png (34kB) pdf (72kB) |
 |
|
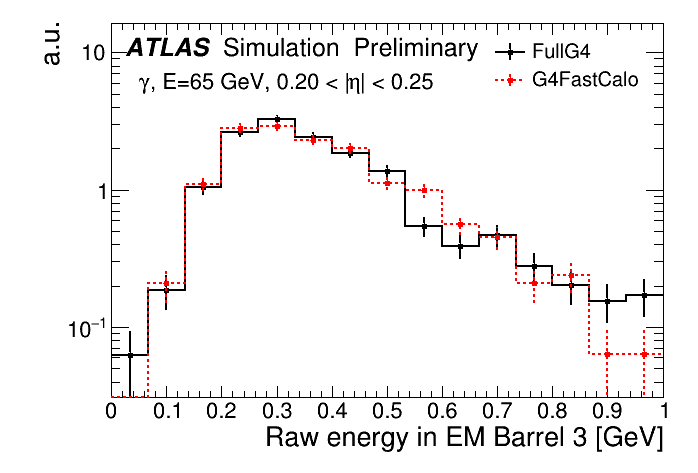
Figure 02: Raw energy distribution (before calibration) of the reconstructed photons in the EM barrel 3. png (14kB) pdf (16kB) |
 |
|
Figure 03: 2D GEANT4 hit position distribution weighted by hit energy in the EM Barrel 2 around the extrapolated particle position. The total energy is normalized to unity. png (340kB) pdf (62kB) |
 |
|
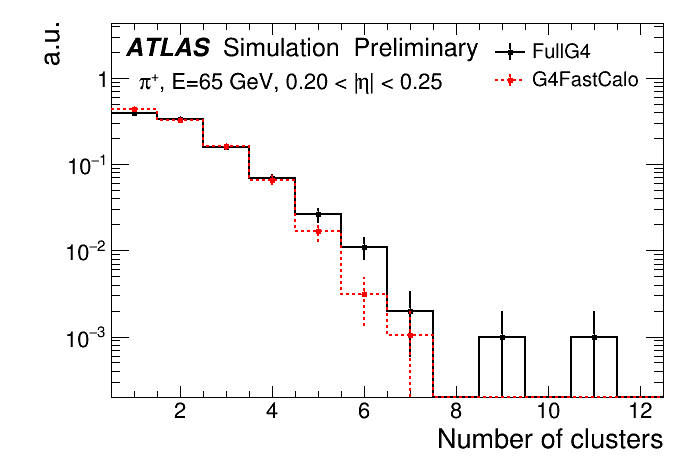
Figure 04: Number of clusters in single-pion events with fixed energy. png (12kB) pdf (15kB) |
 |
|
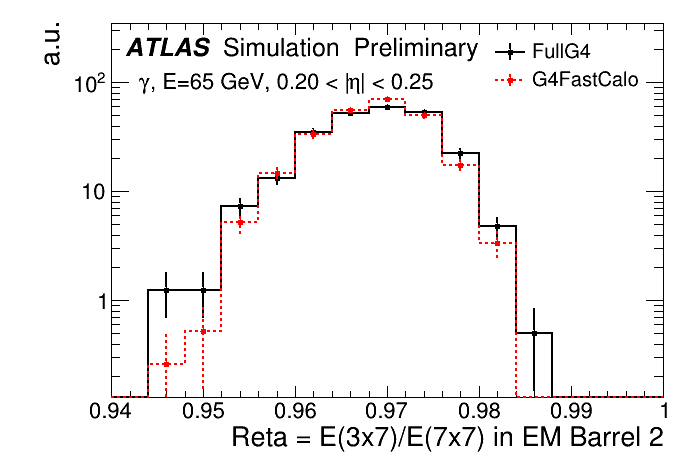
Figure 05: Distribution describing the shower shape in the $\eta$ direction in the middle EM barrel layer. Reta = E(3x7)/E(7x7) is a fraction of energies stored in the $\eta\times\phi$ grid of the cells around the shower axis. png (13kB) pdf (15kB) |
 |
|
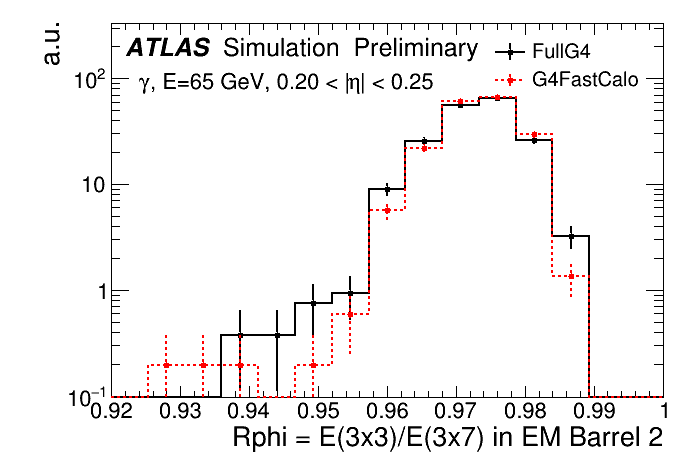
Figure 06: Distribution describing the shower shape in the $\phi$ direction in the middle EM barrel layer. Rphi = E(3x3)/E(3x7) is a fraction of energies stored in the $\eta\times\phi$ grid of the cells around the shower axis. png (14kB) pdf (15kB) |
 |
|
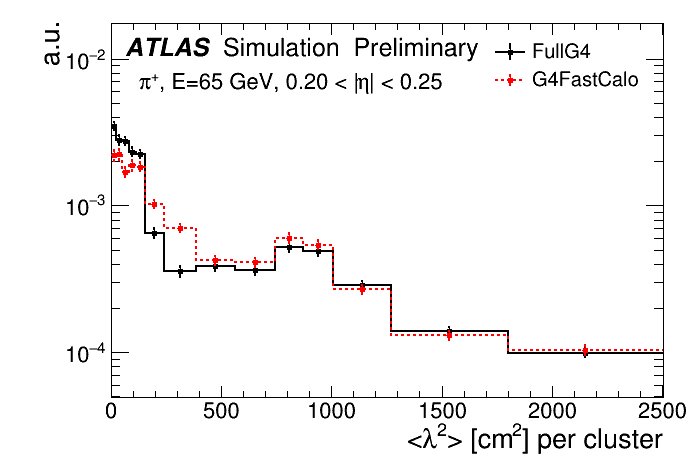
Figure 07: Second cluster moment in $\lambda$, where $\lambda$ is the distance of the cell from the shower center along the shower axis. Cluster moments are defined as $<\lambda^{2}> = \sum\limits_{i} E_{i}\cdot \lambda_{i}^{2} / \sum\limits_{\text{i}} E_{i}$, where sum is over all the cells in the cluster. The cluster moments of all clusters in an event are included in the distribution. png (12kB) pdf (16kB) |
 |
|
Figure 08: Second cluster moment in $r$, where $r$ is the distance of the cell from the shower center along the shower axis. Cluster moments are defined as $ png (12kB) pdf (16kB) |
 |