LSP data files are written to the pool directory on jena where the
logging and monitoring processes can find them.
LSP data files are identified by the data type, followed by a time
stamp which corresponds to the time at which the data acquisition
for this batch of data was finished.
The numbers are two digit pairs of month/day/hour/minute/second.
This ensures that a simple file listing will present the data of each
given data type in chronological order.
The data pool is 'drained' by the logging process which has the
responsibility to delete files after they are logged.
This means that if the logging process crashes, no data is lost, although
the pool will become very full.
All LSP data files are binary, with a uniform data header followed by
a number of valid data structure objects as described in the header.
The header is the LSPhead structure as defined in
/user/specop/os9/lsp/inc/LSPdata.h
and has the format
   typedef struct {          /* 32 bytes in total */
     unsigned int dataType;  /* Type flag to identify data records following */
     unsigned int dataBytes; /* Number of valid data bytes following header  */
     double beginTime;       /* Time acquisition cycle began                 */
     double writeTime;       /* Time data was recieved by frontend           */
     char name[8];           /* Name of equipment writing data (member only) */
   } LSPhead;
A simple utility lspDataDump can be used to dump the contents of any file
found in the LSP data pool, or this can be done from the lspOnline status
panel.
Data Logger
LSP data files are taken from the pool directory and written to flat ascii
data files by the lspLogger process.
The lspLogger process is not run directly, but rather is called as a pipe
by the lspDataFeed script.
This script checks the pool directory every few seconds, and for any file
which is older than two minutes, the name is written to the stdin of the
lspLogger process.
By a command line switch, lspDataFeed then deletes the files from the pool
when lspLogger indicates that is has completed the logging of the data.
The two minute delay in calling lspLogger allows other processes, either
driven by lspDataFeed or running on their own, to access the data as well.
By default, if lspLogger crashes on a particular LSP data file, that file
is moved from the pool directory to the dead directory:
/user/specop/dead
The final Ascii data files can be found in the directory
/user/specop/data
where one file is written each calendar day.
Each line in this file is the result of one LSP data object which was
written by the front end.
The first two entries are always the front end data time in days,
converted from GMT by the unix routine localtime(), and a four
character string indicating the type of data which is to follow.
This data type matches the dataType member of the LSPhead structure,
and is primarily intended to be able to separate DVM status blocks
from the real DVM data records.
For the data acquired from the DVMs, the remaining columns are the
data read out in order from each channel.
Tools and Utilities
A number of handy utilities have been written to monitor the LSP data
acquisition and view the recorded data. This section gives a brief
introduction to a few of these tools.
extract
Usage: extract [-since time] [-from tlo thi] type

   This routine extracts data from the LSP data files
   for a given time range (default: last day) and dumps
   the result to stdout.

 Arguments:
   type              --  LSP data type (BPM/WIRE/TEMP/etc...)

 Options:
  -from  <.tlo> <.thi> --  time range in days
  -since <.time>      --  time in hours [24]
  -tag   <.tag>       --  data tag to extract [DATA]
  -notag             --  ignore the tag matching
The extract script is a handy way to get raw LSP data from the data
files for a given time range.
This range can either be given in terms of an explicit range in days,
or for a given number of hours previous to the current time.
The extract script matches those entries with a given tag
(DATA by default), and dumps all matching entries to stdout.
These resulting files are then suitable to be read into PAW as an
ntuple.
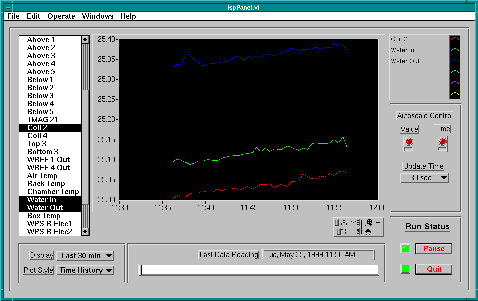
lspPanel
 The lspPanel application is a LabVIEW based online data viewer.
This process reads new LSP data files as they arrive in the data
pool, and presents a time history of selected channels.
The channel labels are determined at execution time by reading the
config files in
/user/specop/labview/cfg
A separate lspPanel process is needed for each data stream.
lspBrowser
The lspBrowser application is closely related to the lspPanel process,
except that this panel looks at old data files which have already been
recorded. Note that parsing the thousands of entries in a typical LSP
data file can take several seconds, so please be patient.
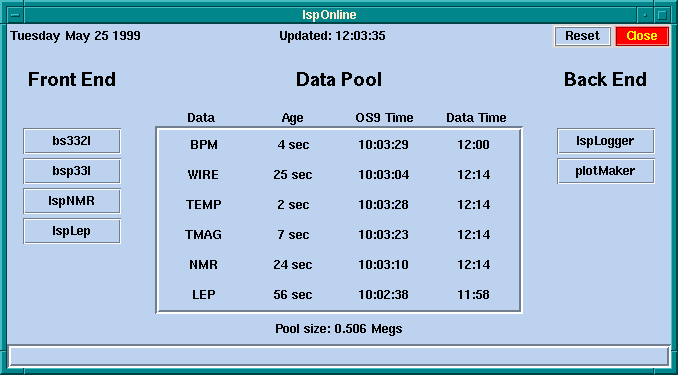
lspOnline
 The lspOnline panel shows the current status of the LSP data acquisition.
The various front end processes writing data to the pool are shown as
menu buttons on the left.
From these buttons, the front end crates can be rebooted, and the
log files for the various processes can be viewed.
If any button is red, it indicates that the data for that type is missing
for some number of minutes.
If all of the data is missing, first try the Reset button to reset the
Pool spy process.
The Pool display shows which files have been recently written to the data
pool.
A dump of the most recent data file can be viewed by clicking on the
name of the desired data type.
The OS9 time is the writeTime found in the data header, and corresponds
to GMT.
The Data Time is the time stamp of the last entry into the Ascii data file
written by lspLogger.
The Back end processes show various standard processes which act upon the
pool files, like the logging process and the automatic plot maker.
These should all be running, and if they are not, the button will turn red.
The information for the lspOnline panel is loaded at startup from a config
file
/user/specop/lspAcq/lspOnline/lspOnlineCfg.tcl
which describes the various front end and back end processes, as well as the
data dependencies between them.
Information on the jena-based Unix processes can also be obtained in
text format using the process lspAcq.
By typing lspAcq -start, the entire online acquisition on jena can be
restarted.
The front end crates may need to be rebooted independently.
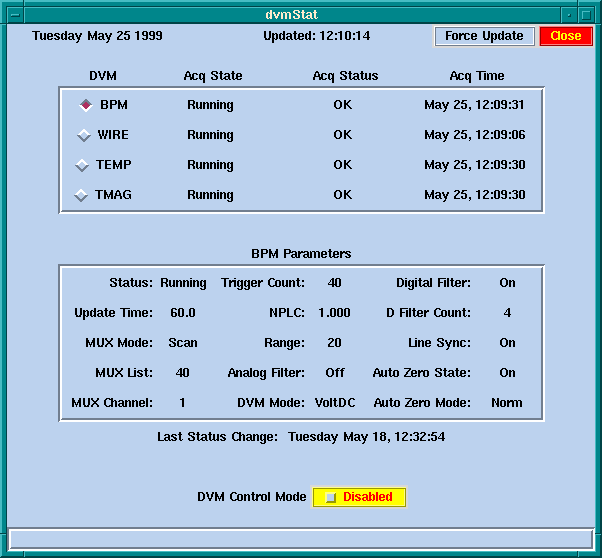
dvmStat
 The dvmStat panel shows the current status of the front end DVM acquisition.
This panel also allows temporary modifications of the DVM configuration
until the next time a front end crate is rebooted.
Permanent changes need to be made to the DVM config files found in
/h0/USR/LEPBI/LSP/CFG/[name].cfg
on the OS9 file system.
To change a parameter, first select the desired DVM from the list
at the top of the panel.
Second, enable the DVM update mode, by selecting the DVM Control Mode
button.
No changes can be made while the DVM acquisition is running,
so the first thing which must be changed is the Status.
After clicking on Status, you will be presented with a dialog box.
The menu button provides common values, which in this case are the
only allowed choices.
Type Stop, or select it from the menu list, and press the OK button.
The commands are send via EQUIP call, and the results will be returned
into the status window at the bottom of the panel.
The multiplexer scanning can be stopped by changing the MUX Mode to NONE.
In this mode, the MUX List parameter selects the channel to read out.
Each channel can also be read in order by using the MUX Mode of CYCLE.
In this mode, each acquisition cycle only reads data from one channel,
but the channel number in incremented before the next cycle starts.
The time between the start of each cycle is controlled with the Update
Time parameter.
The safest way to reset the DVM parameters after making some temporary
changes is to reboot the crate.
Note that at every change of the DVM run status, a status block record is
written to the ascii data files.
This allows changes in various operating parameters to be tracked offline.
Eric.Torrence@cern.ch
CERN Phonebook Info
Updated May 25st, 1999
