|
| |||||||||||

|
|

|


|
 (excl)
 |
|||||||
|
Efficiencies in % | |||||||||||
 v v
|
|||||||||||
 v v
|
|||||||||||
 v v v v
|
|||||||||||
 v v
|
|||||||||||
| |
| ||||||||||
| |
| ||||||||||
L= 41.89 pb-1 |
|||||||||||
|
|
|||||||||||
|
SM in ( ) |
|
|
|||||||||
|
|
|||||||||||
Remarks:
efficiencies and background take into account inefficiencies due to beam related background in the lvlv channel
numbers in parentheses are standard model predictions for Mw=80.39 GeV/c2 and Ecm=188.6 GeV, the leptonic BR is 10.83%, thus the hadronic Br is 45.58%
qqqq with NN14(WW4Q_TAG).
qqqq column for a cut on NN14>0.3
lvqq channel

qqqq channel
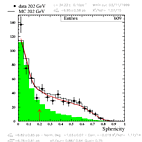
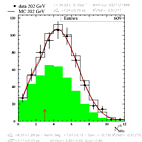
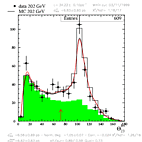
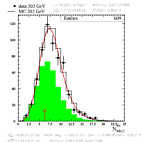
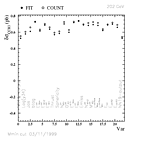
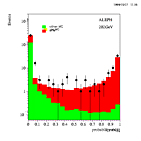
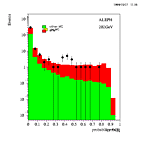
Below are the NN14 output, y34 and the 14 input distributions of the NN after preselection. The NN19 result is also given for its preselection. Data are black dots. MC is normalized to the quoted luminosity (shaded area is the total background including non-4q events. A binned log likelihood fit over the whole range of the distribution is depicted by the smooth black line. The same fit is also performed with a second parameter: a background normalization factor. This fit is depicted by the red line. A simple event counting above or below a cut, set to optimize efficiency*purity, is also performed. Results are given at the top of each figure. Last plots show the variation of the cross section obtained for each distribution with the standard 1 parameter fit, the resulting error, the same for the 2 parameter fit and its error and finally the value of the normalization factor obtained from the 2 parameter fit.


_202_thumb.gif)


