

Compact Muon Solenoid
LHC, CERN
| CERN-LHCC-2015-019 ; LHCC-G-165 | ||
| CMS Phase II Upgrade Scope Document | ||
| CMS Collaboration | ||
| 25 September 2015 | ||
| Abstract: The High-Luminosity LHC (HL-LHC) has been identified as the highest priority program in High Energy Physics by both the European Strategy Group and the US Particle Physics Project Prioritization Panel. To fulfil the full potential of this program, which includes the study of the nature of the Higgs boson, the investigation of the properties of any newly discovered particles in the upcoming LHC runs, and the extension of the mass reach for further discoveries, an integrated luminosity of 3000 fb$^{-1}$ will have to be accumulated by the end of the program. In preparation for operation at the HL-LHC, CMS has documented the necessary upgrades and their expected costs in a Technical Proposal submitted to the CERN LHC Committee (LHCC) in mid-2015. The ``Scope Document'' provides additional information to assist the LHCC and the CERN Resource Review Board (RRB) in their review of the CMS upgrade. The document commences with a summary of the process followed to develop the scope of the ``reference'' design described in the Technical Proposal. The upgrades of reduced scope that have been explored, along with two representative detector configurations that lower the cost, from the estimate of 265 MCHF for the reference design to 242 MCHF and 208 MCHF, are then presented. The performance of all three configurations is compared, along with the capability of the reference design to operate effectively at a potentially increased instantaneous luminosity, as recently introduced in projections for the HL-LHC. It is shown that the CMS reference upgrade will ensure the success of the full scientific program at the HL-LHC, providing also the opportunity to exploit the highest luminosity potential of the accelerator. An alternate configuration with limited reduction of scope should sustain good performance, but would limit the ability to profit from the highest luminosities for some fundamental and difficult measurements. Large scope reductions, as considered in the third configuration, will irrevocably have adverse effect on major parts of the physics program. | ||
| Links: CDS record (PDF) ; | ||
| Figures | |
png ; pdf ; |
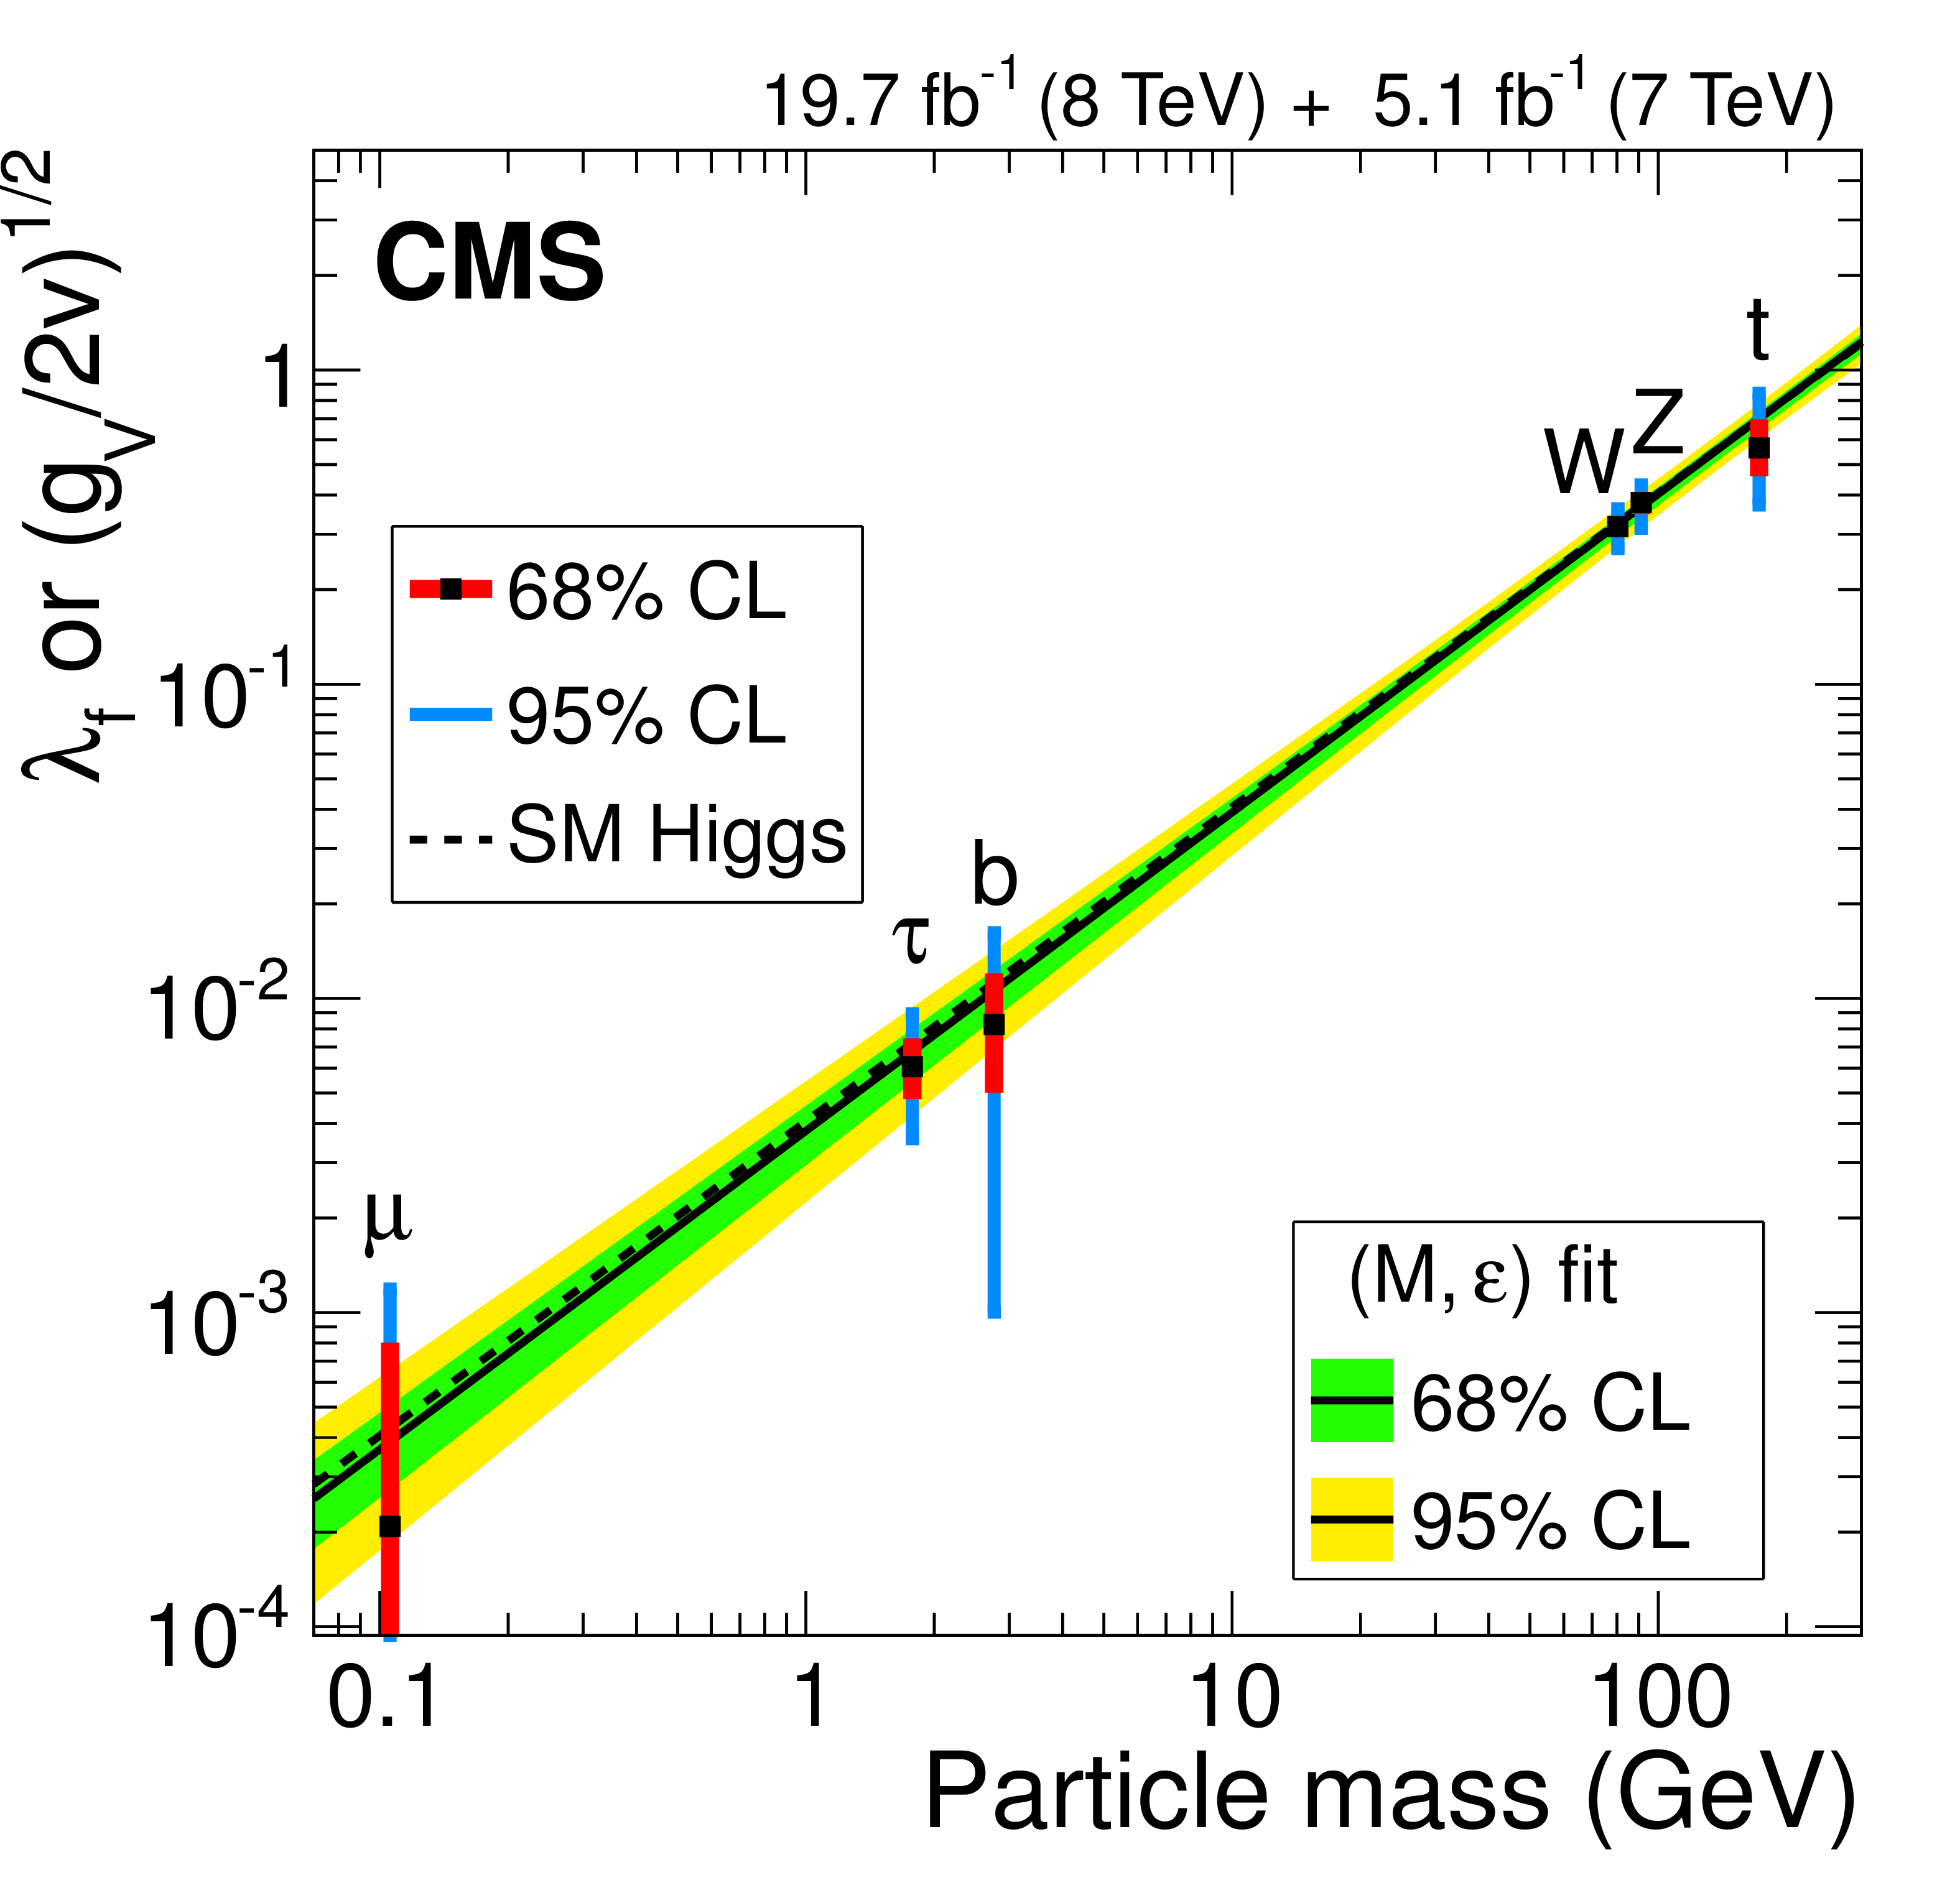
Figure 1-a:
Higgs boson couplings as a function of boson or fermion masses from (left) data from Run I and (right) projections for 3000 fb$^{-1}$ at the HL-LHC. The couplings of fermions and weak vector bosons are parametrized to be $\kappa _f \frac {m_f}{v}$ ($\lambda $) and $\sqrt {\kappa _V} \frac {m_V}{v}$ ($(gV/2v)^{1/2}$), respectively, to preserve a linear mass dependence. The dashed lines indicate the predicted dependence on the particle mass for the SM Higgs boson. |
png ; pdf ; |
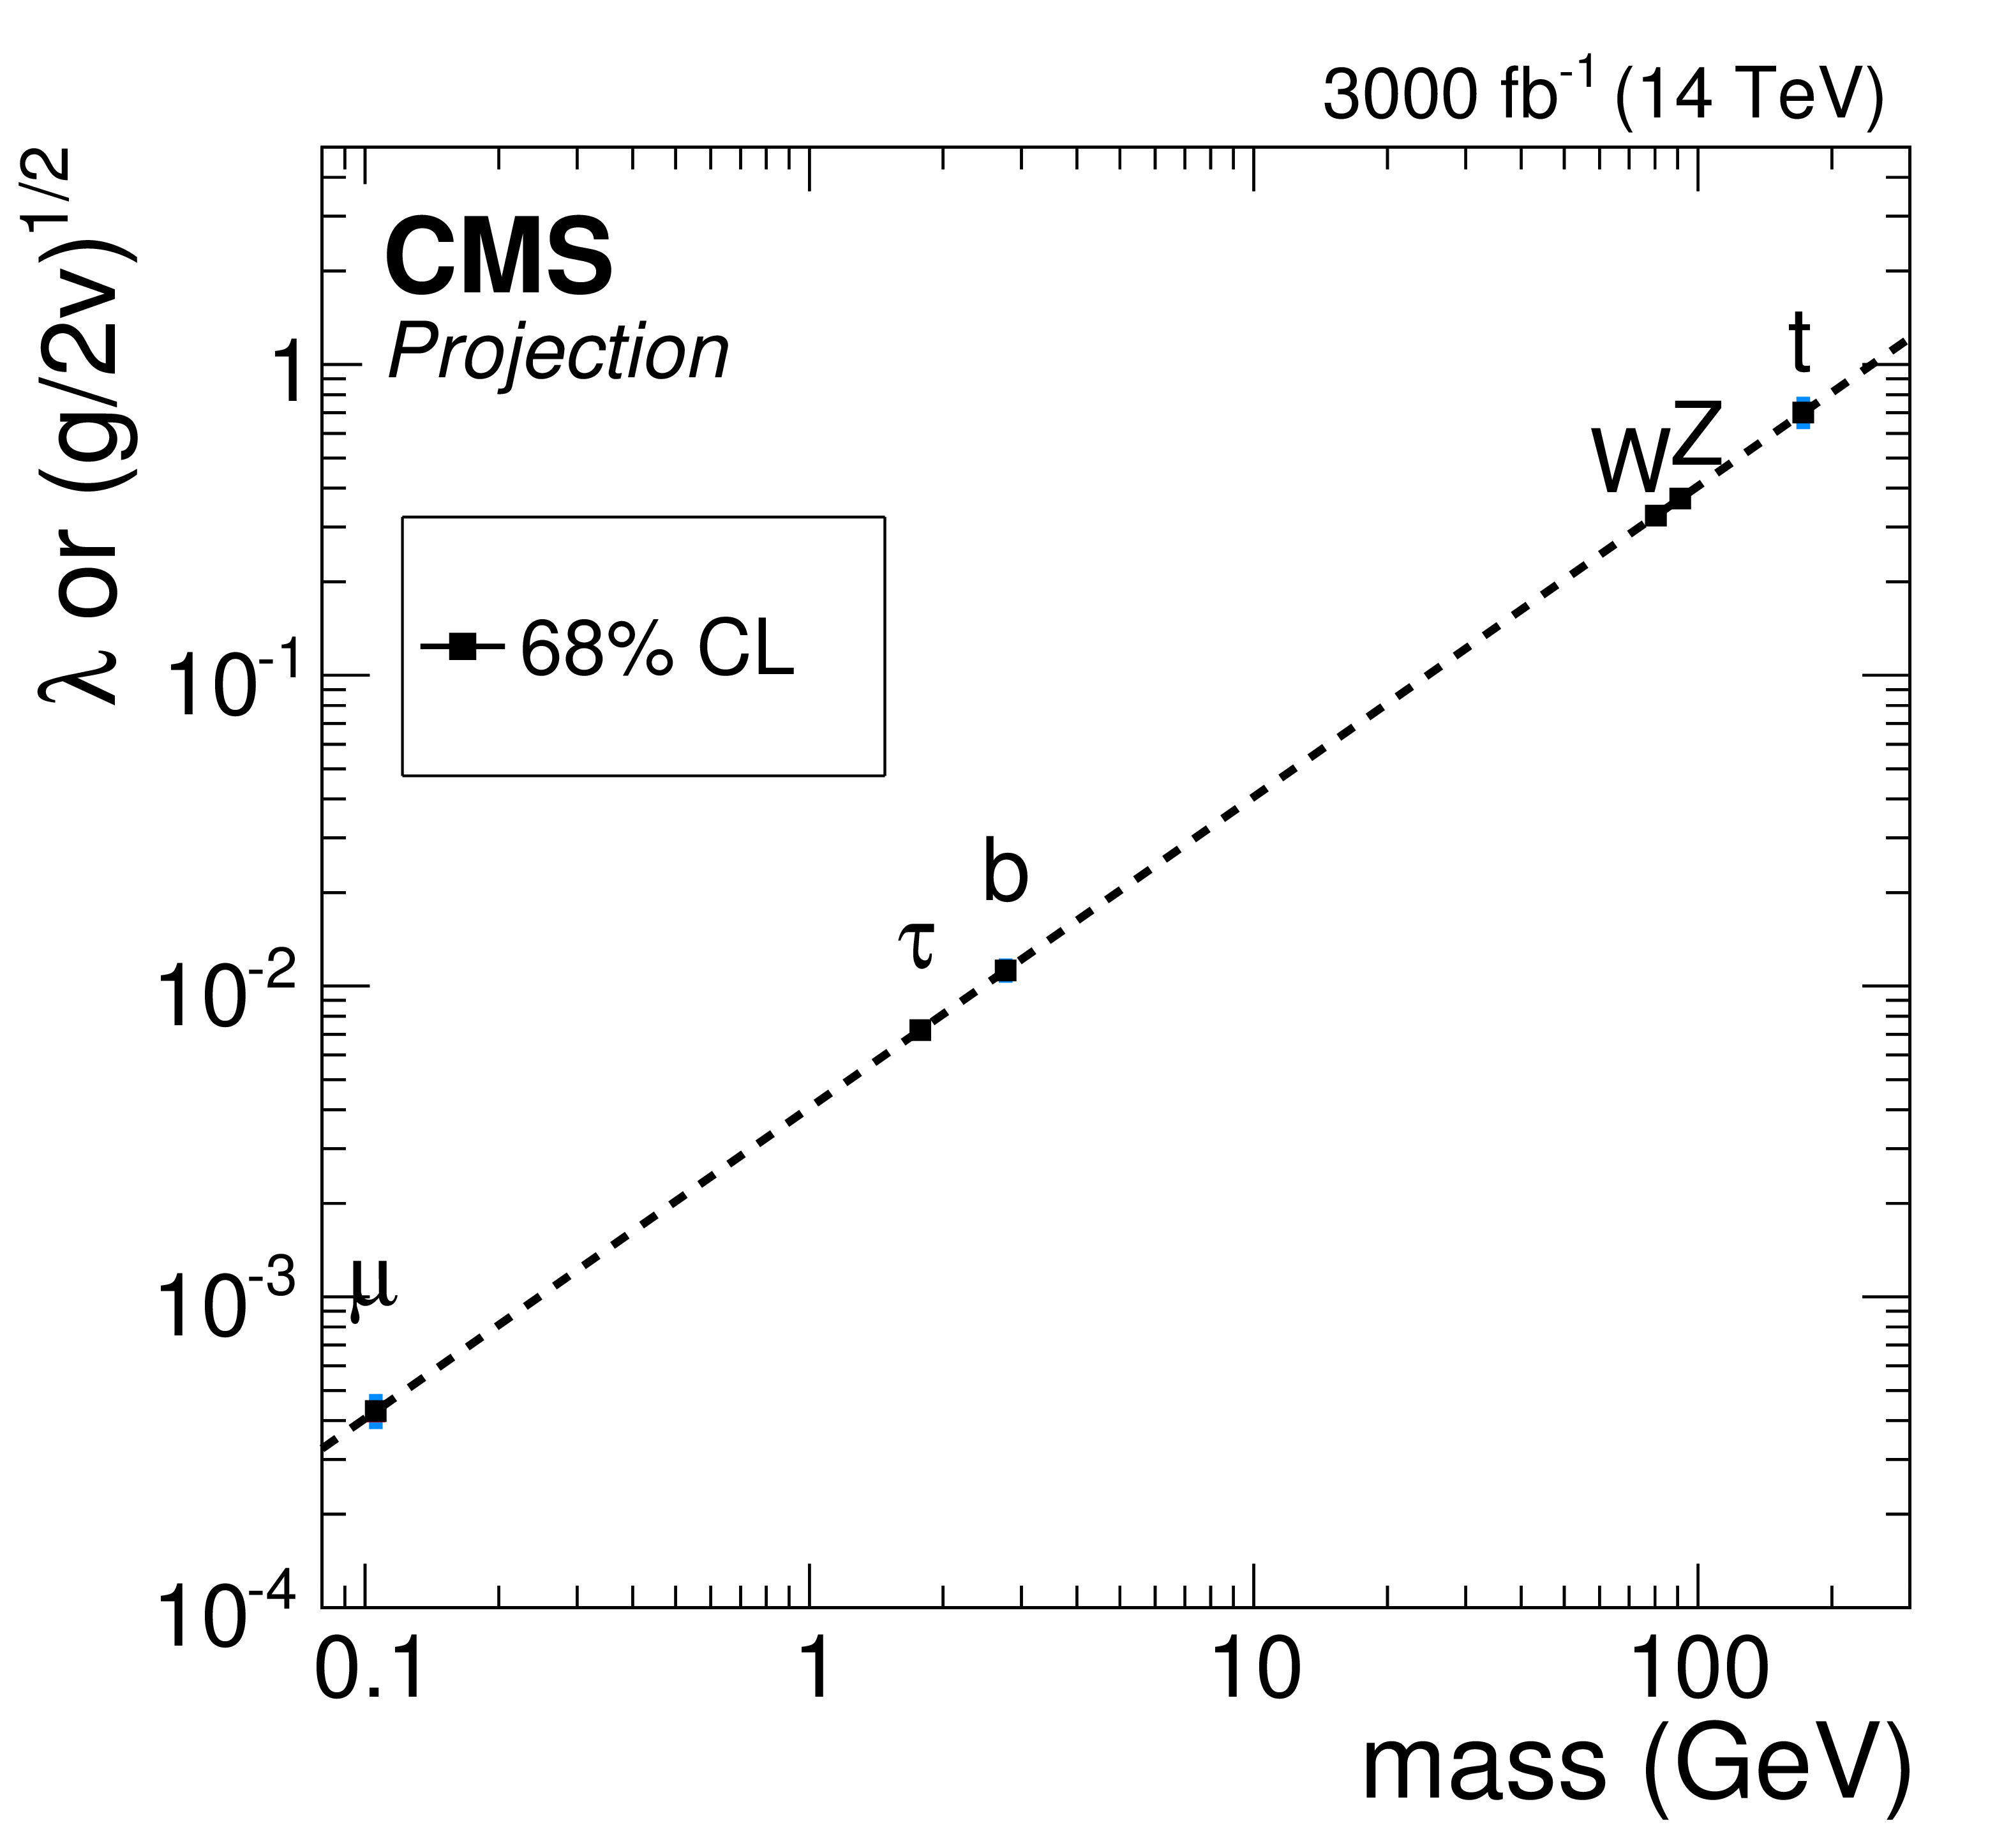
Figure 1-b:
Higgs boson couplings as a function of boson or fermion masses from (left) data from Run I and (right) projections for 3000 fb$^{-1}$ at the HL-LHC. The couplings of fermions and weak vector bosons are parametrized to be $\kappa _f \frac {m_f}{v}$ ($\lambda $) and $\sqrt {\kappa _V} \frac {m_V}{v}$ ($(gV/2v)^{1/2}$), respectively, to preserve a linear mass dependence. The dashed lines indicate the predicted dependence on the particle mass for the SM Higgs boson. |
png ; pdf ; |
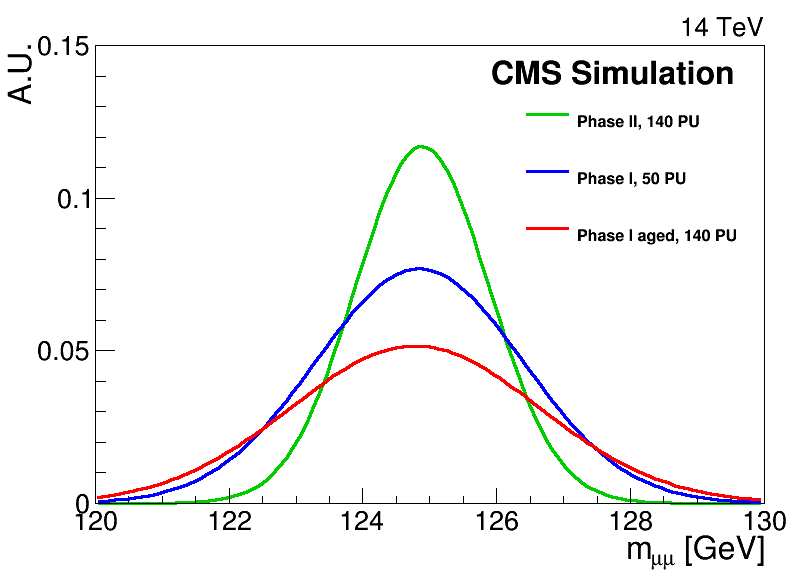
Figure 2:
Di-muon mass distributions for Higgs boson events simulated with the Phase I (nominal and after radiation damage from exposure to 1000 fb$^{-1}$ of luminosity) and Phase II detectors. The distributions are normalized to take the relative selection efficiency of different detectors and conditions into account. |
png ; pdf ; |
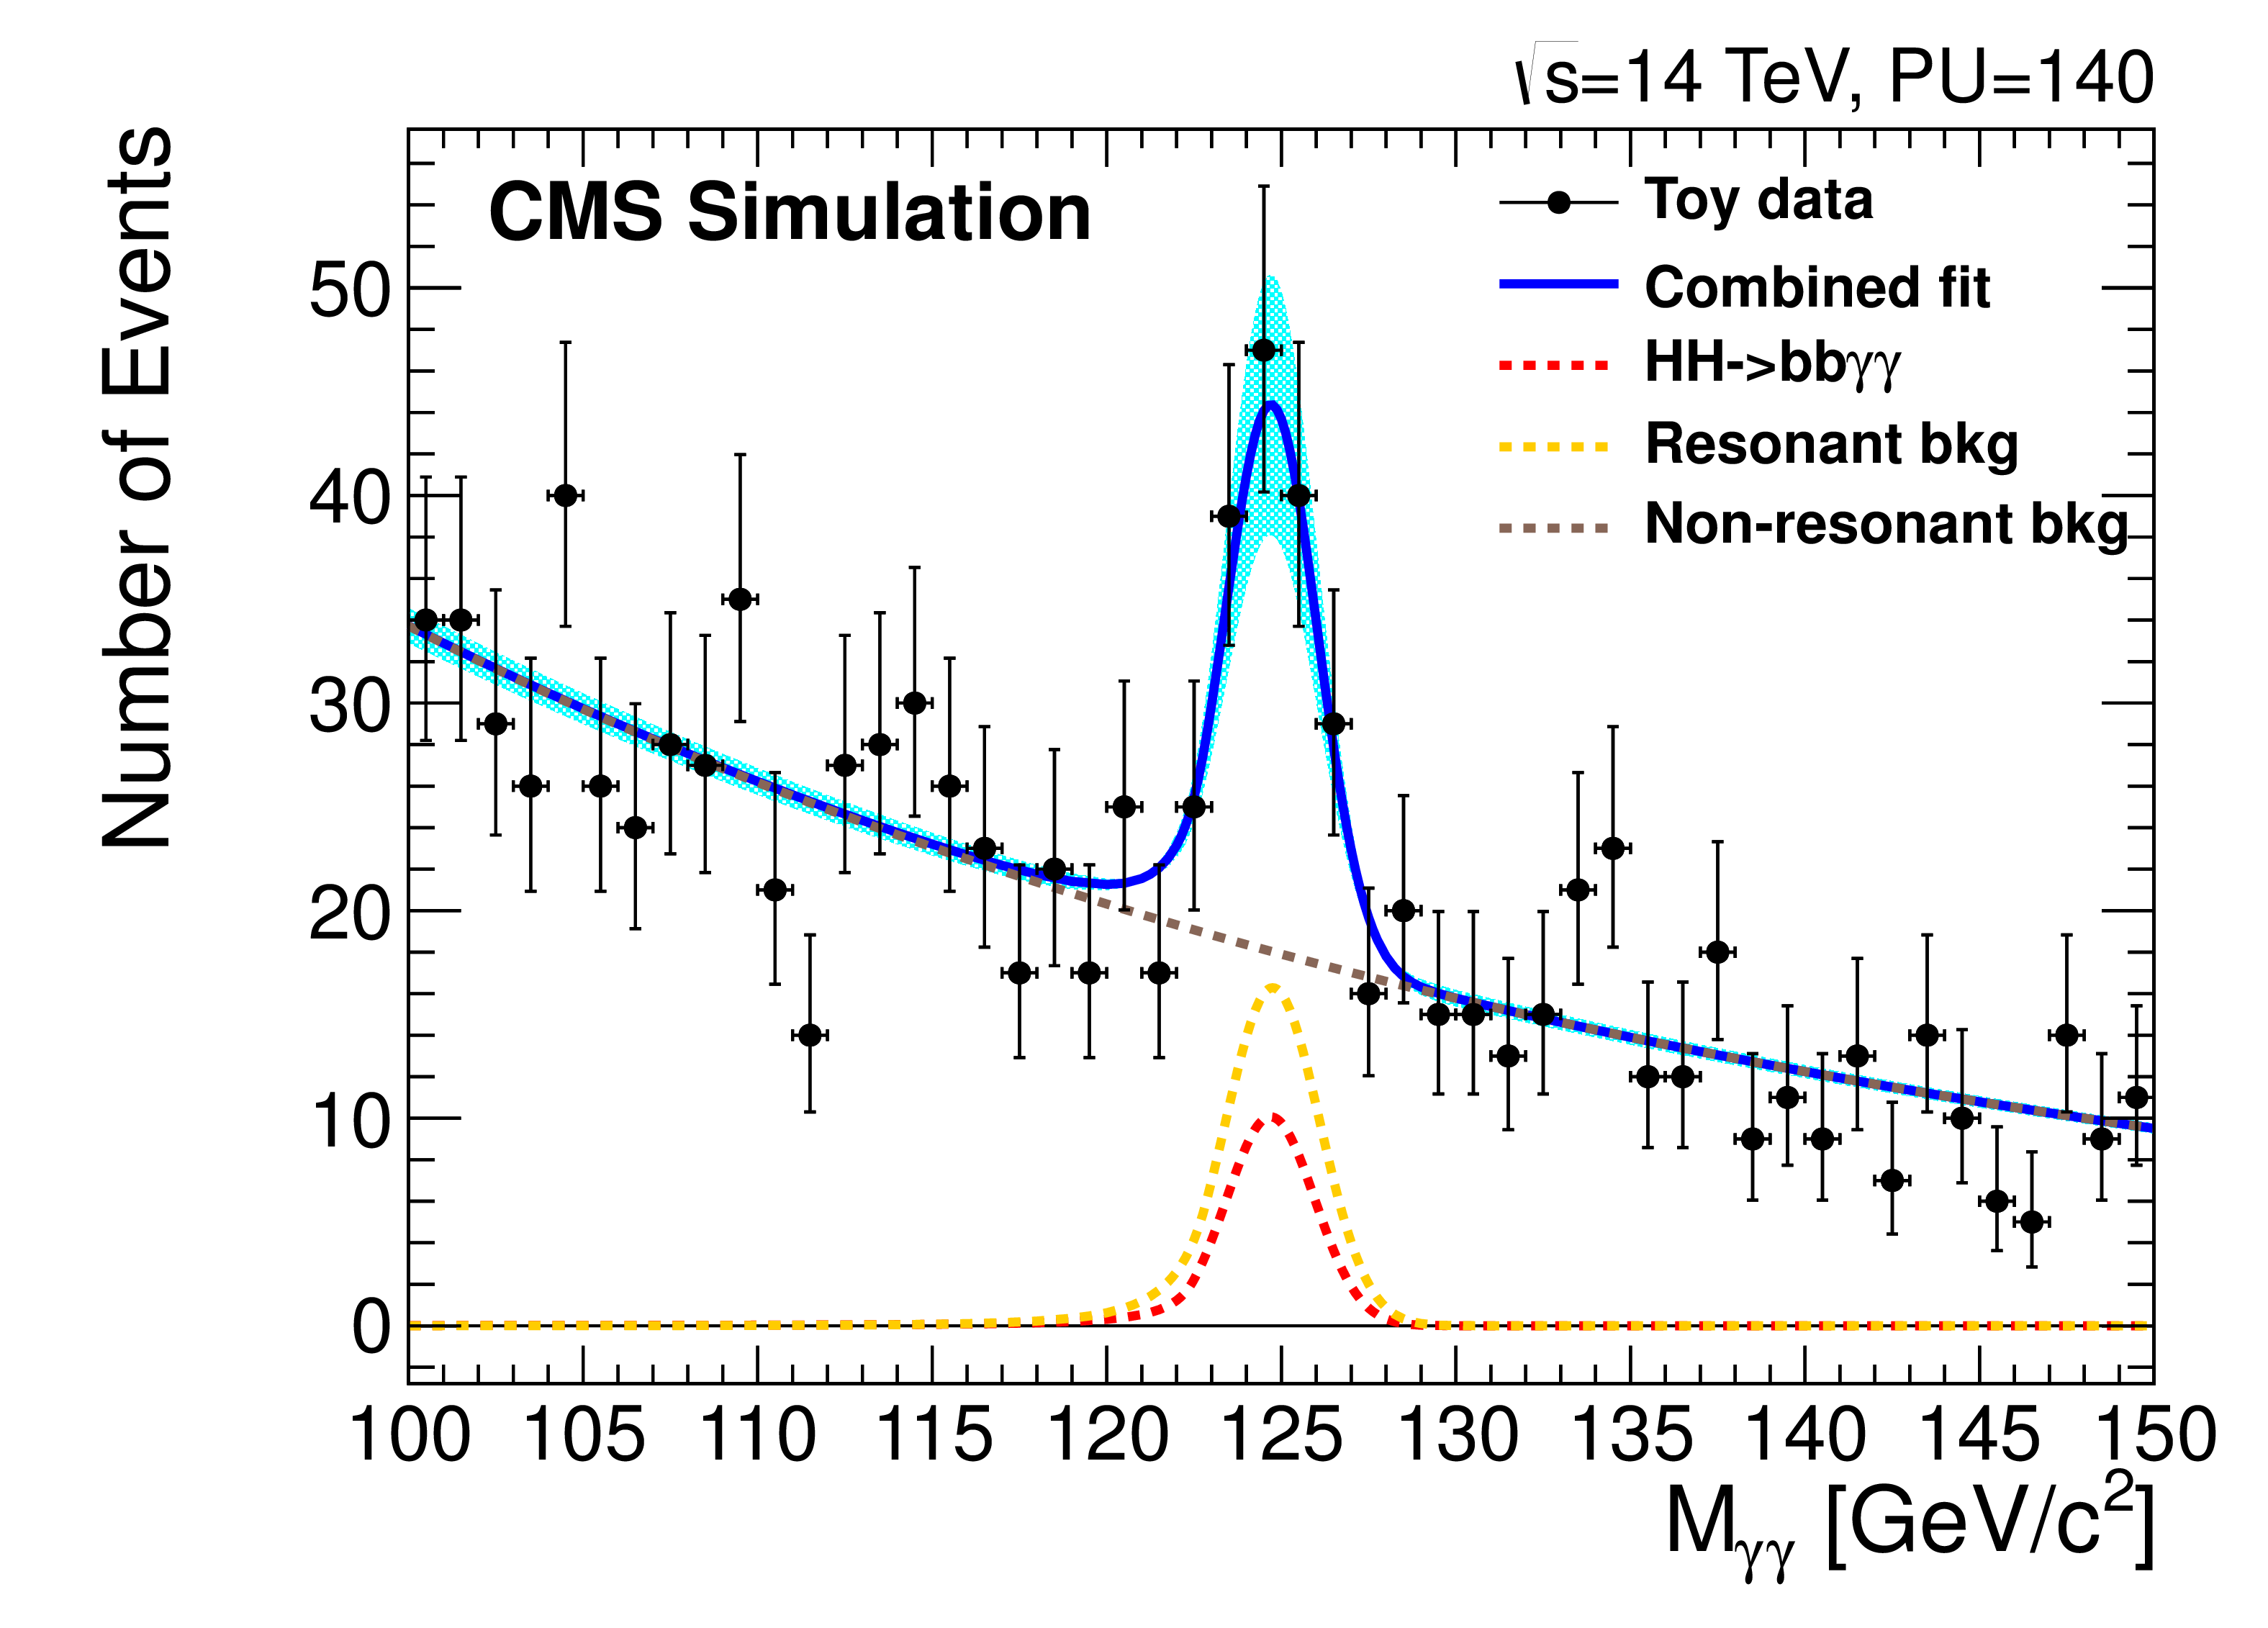
Figure 3:
Di-photon mass distribution for the estimated signal and background contributions in the $HH \rightarrow bb\gamma \gamma $ measurement. The data points show the result of a pseudo-experiment. |
png ; pdf ; |
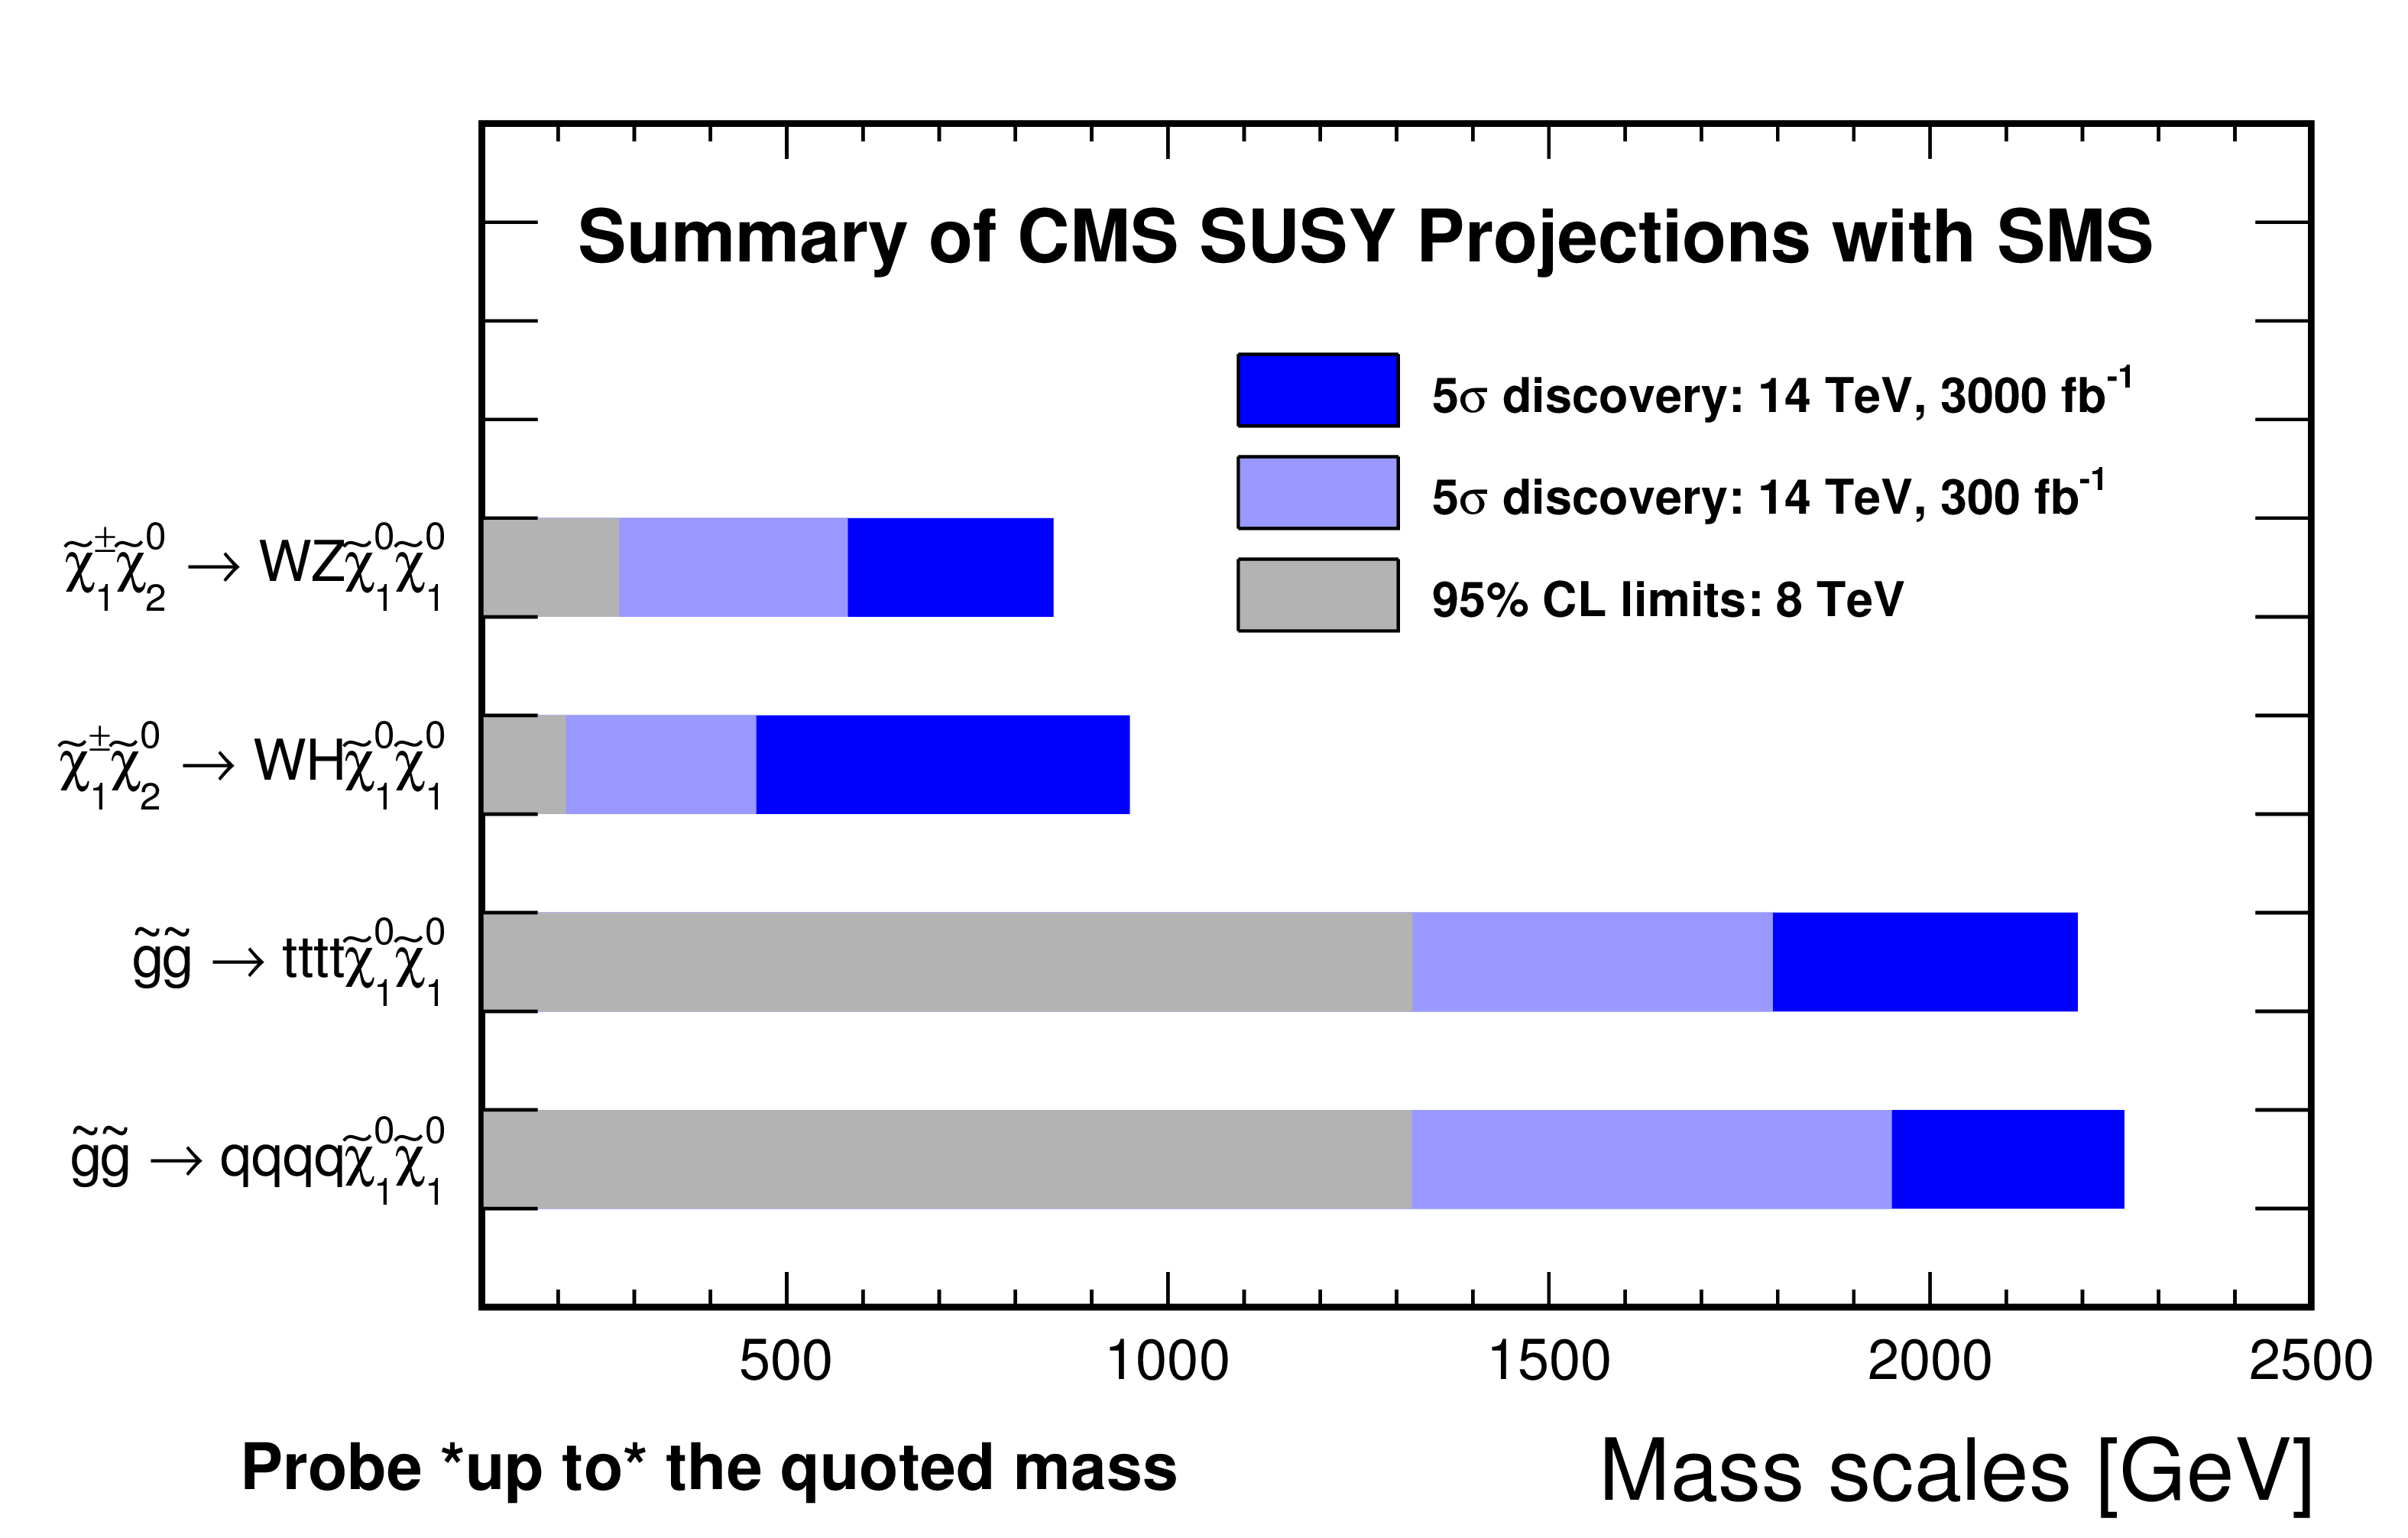
Figure 4:
Reach of searches for supersymmetry. |
png ; pdf ; |
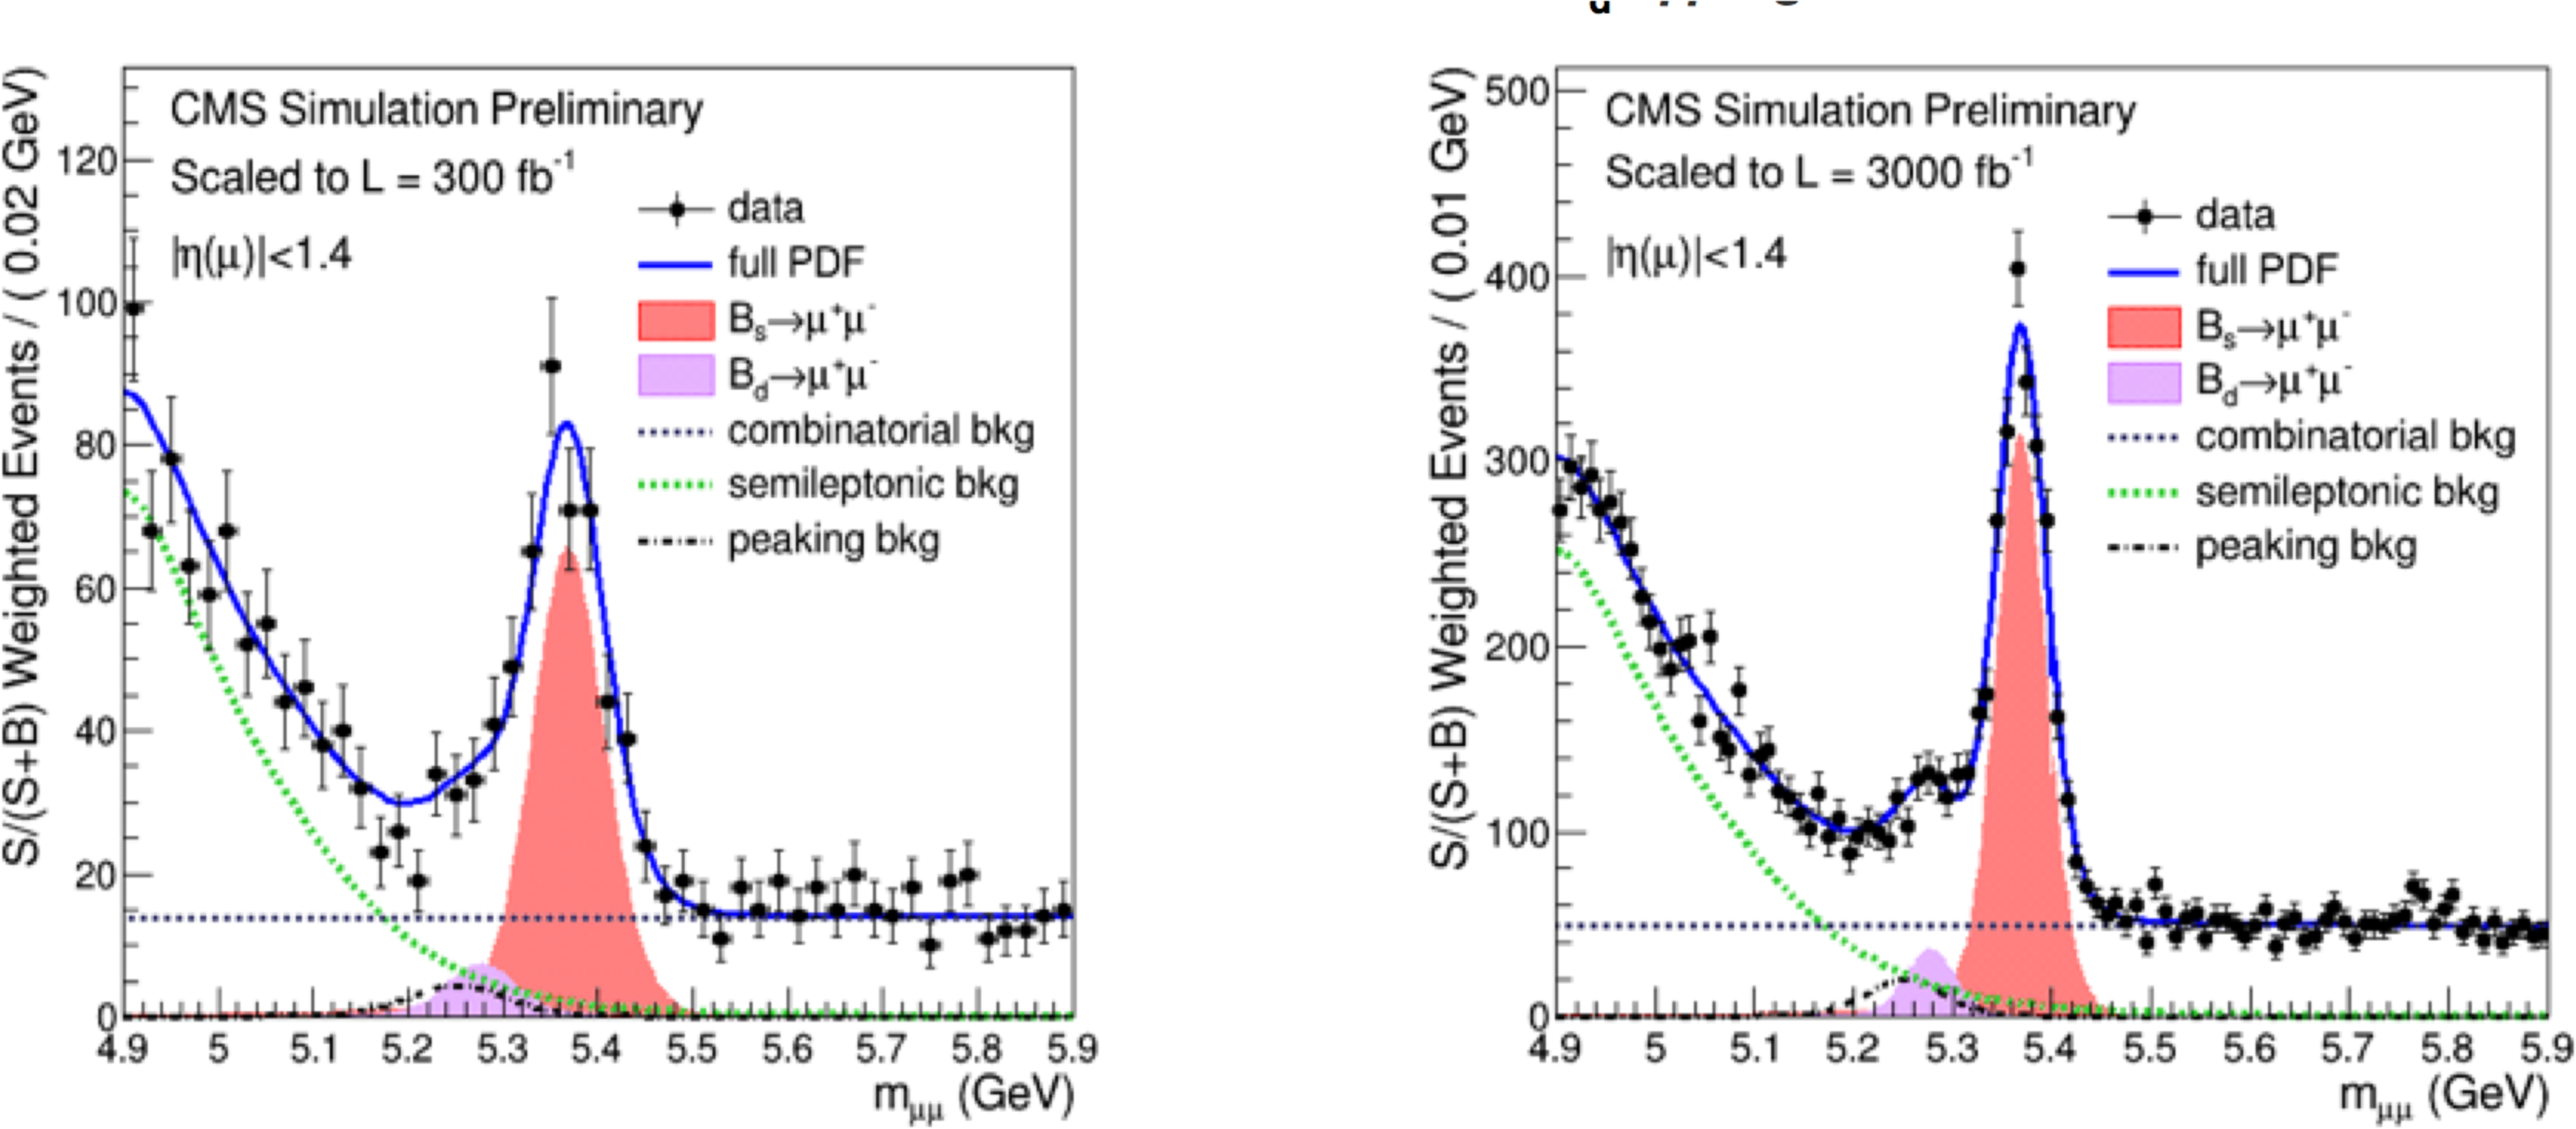
Figure 5:
$B_{s,d}\rightarrow \mu ^{+}\mu ^{-}$ with integrated luminosity of 300 fb$^{-1}$ (left) and 3000 fb$^{-1} (right)$. |
png ; pdf ; |
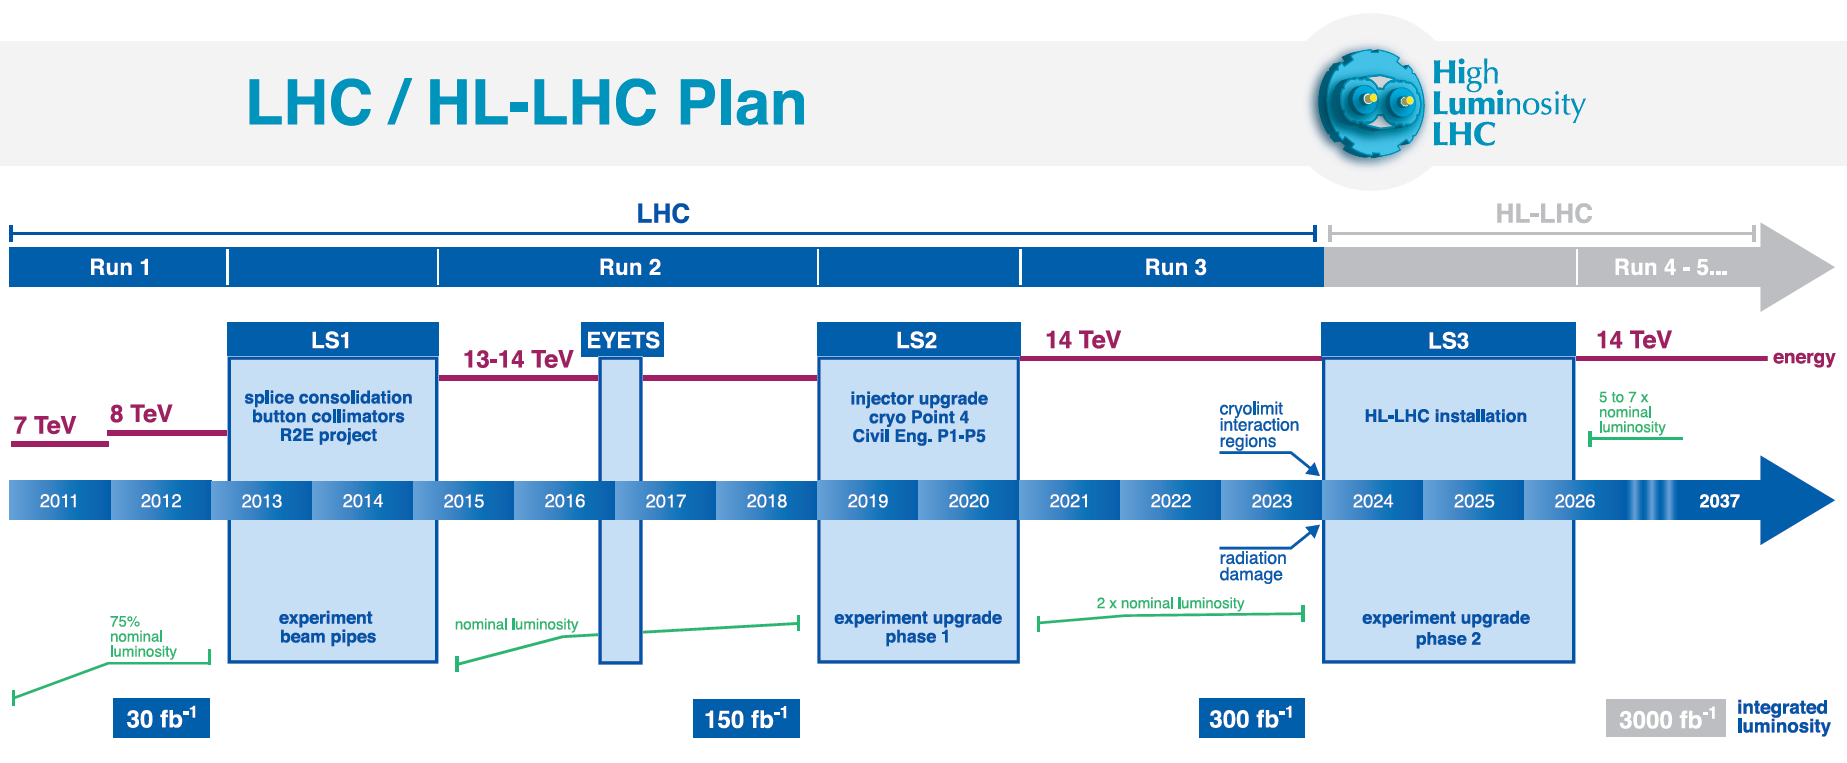
Figure 6:
LHC schedule for long shutdowns and luminosity projections through HL-LHC. |
png ; pdf ; |
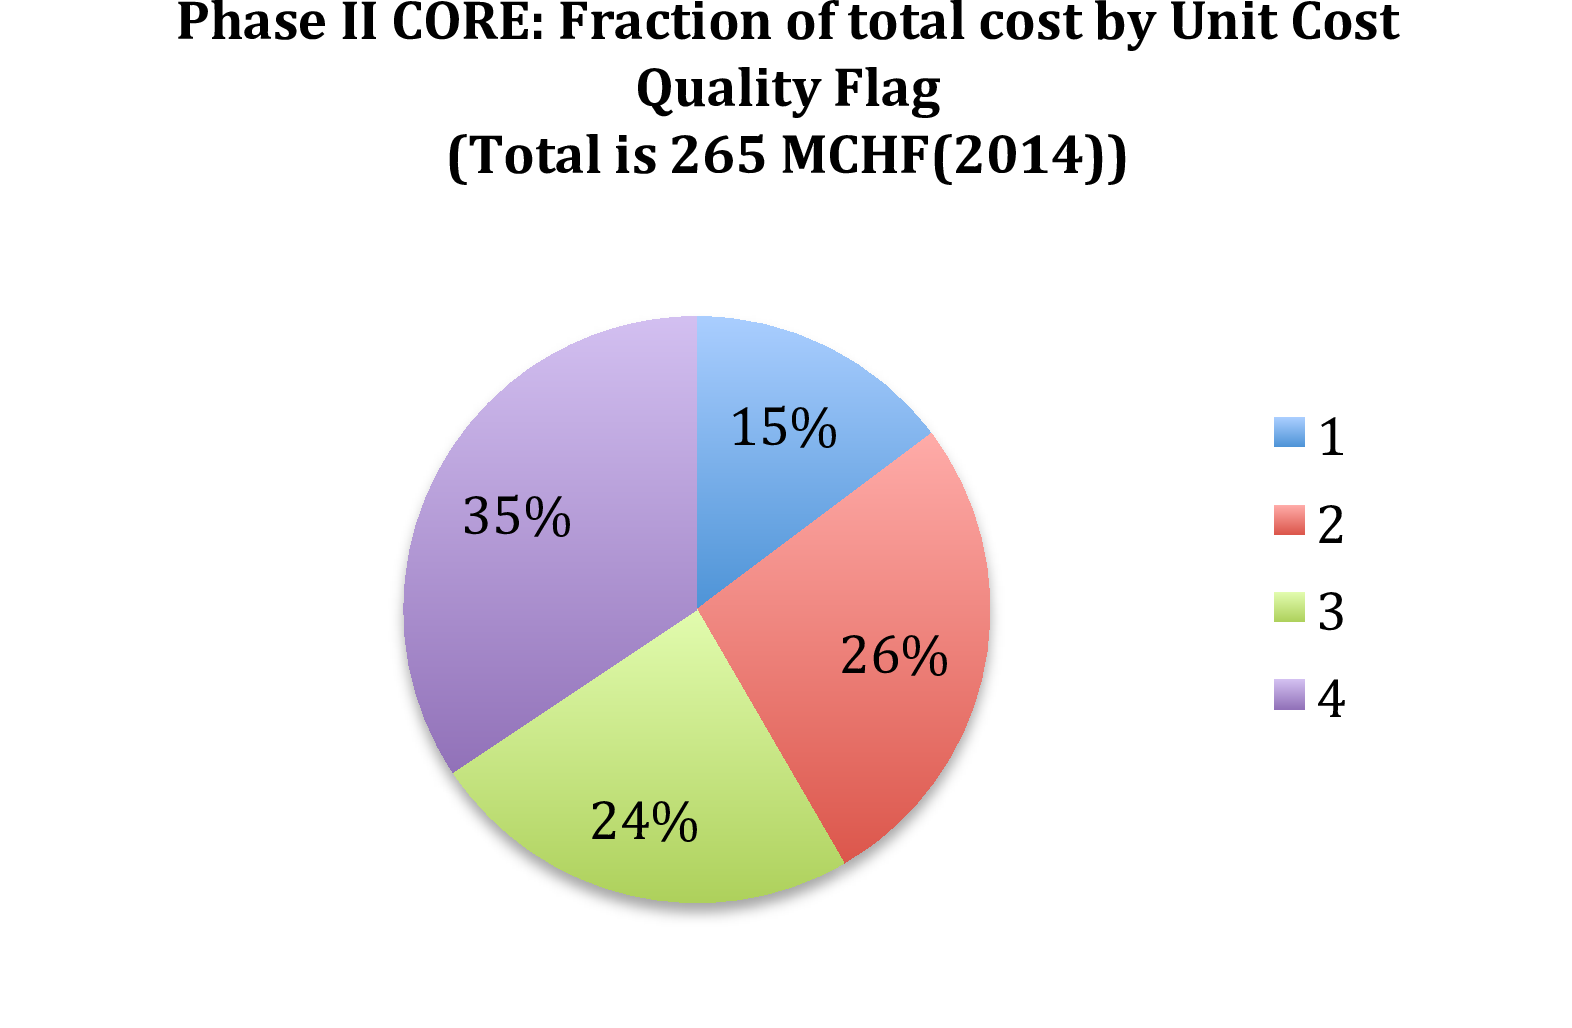
Figure 7:
Breakdown of the total cost of 265 MCHF (2014) by unit cost quality flag (as described in the text). |
png ; pdf ; |
Figure 8:
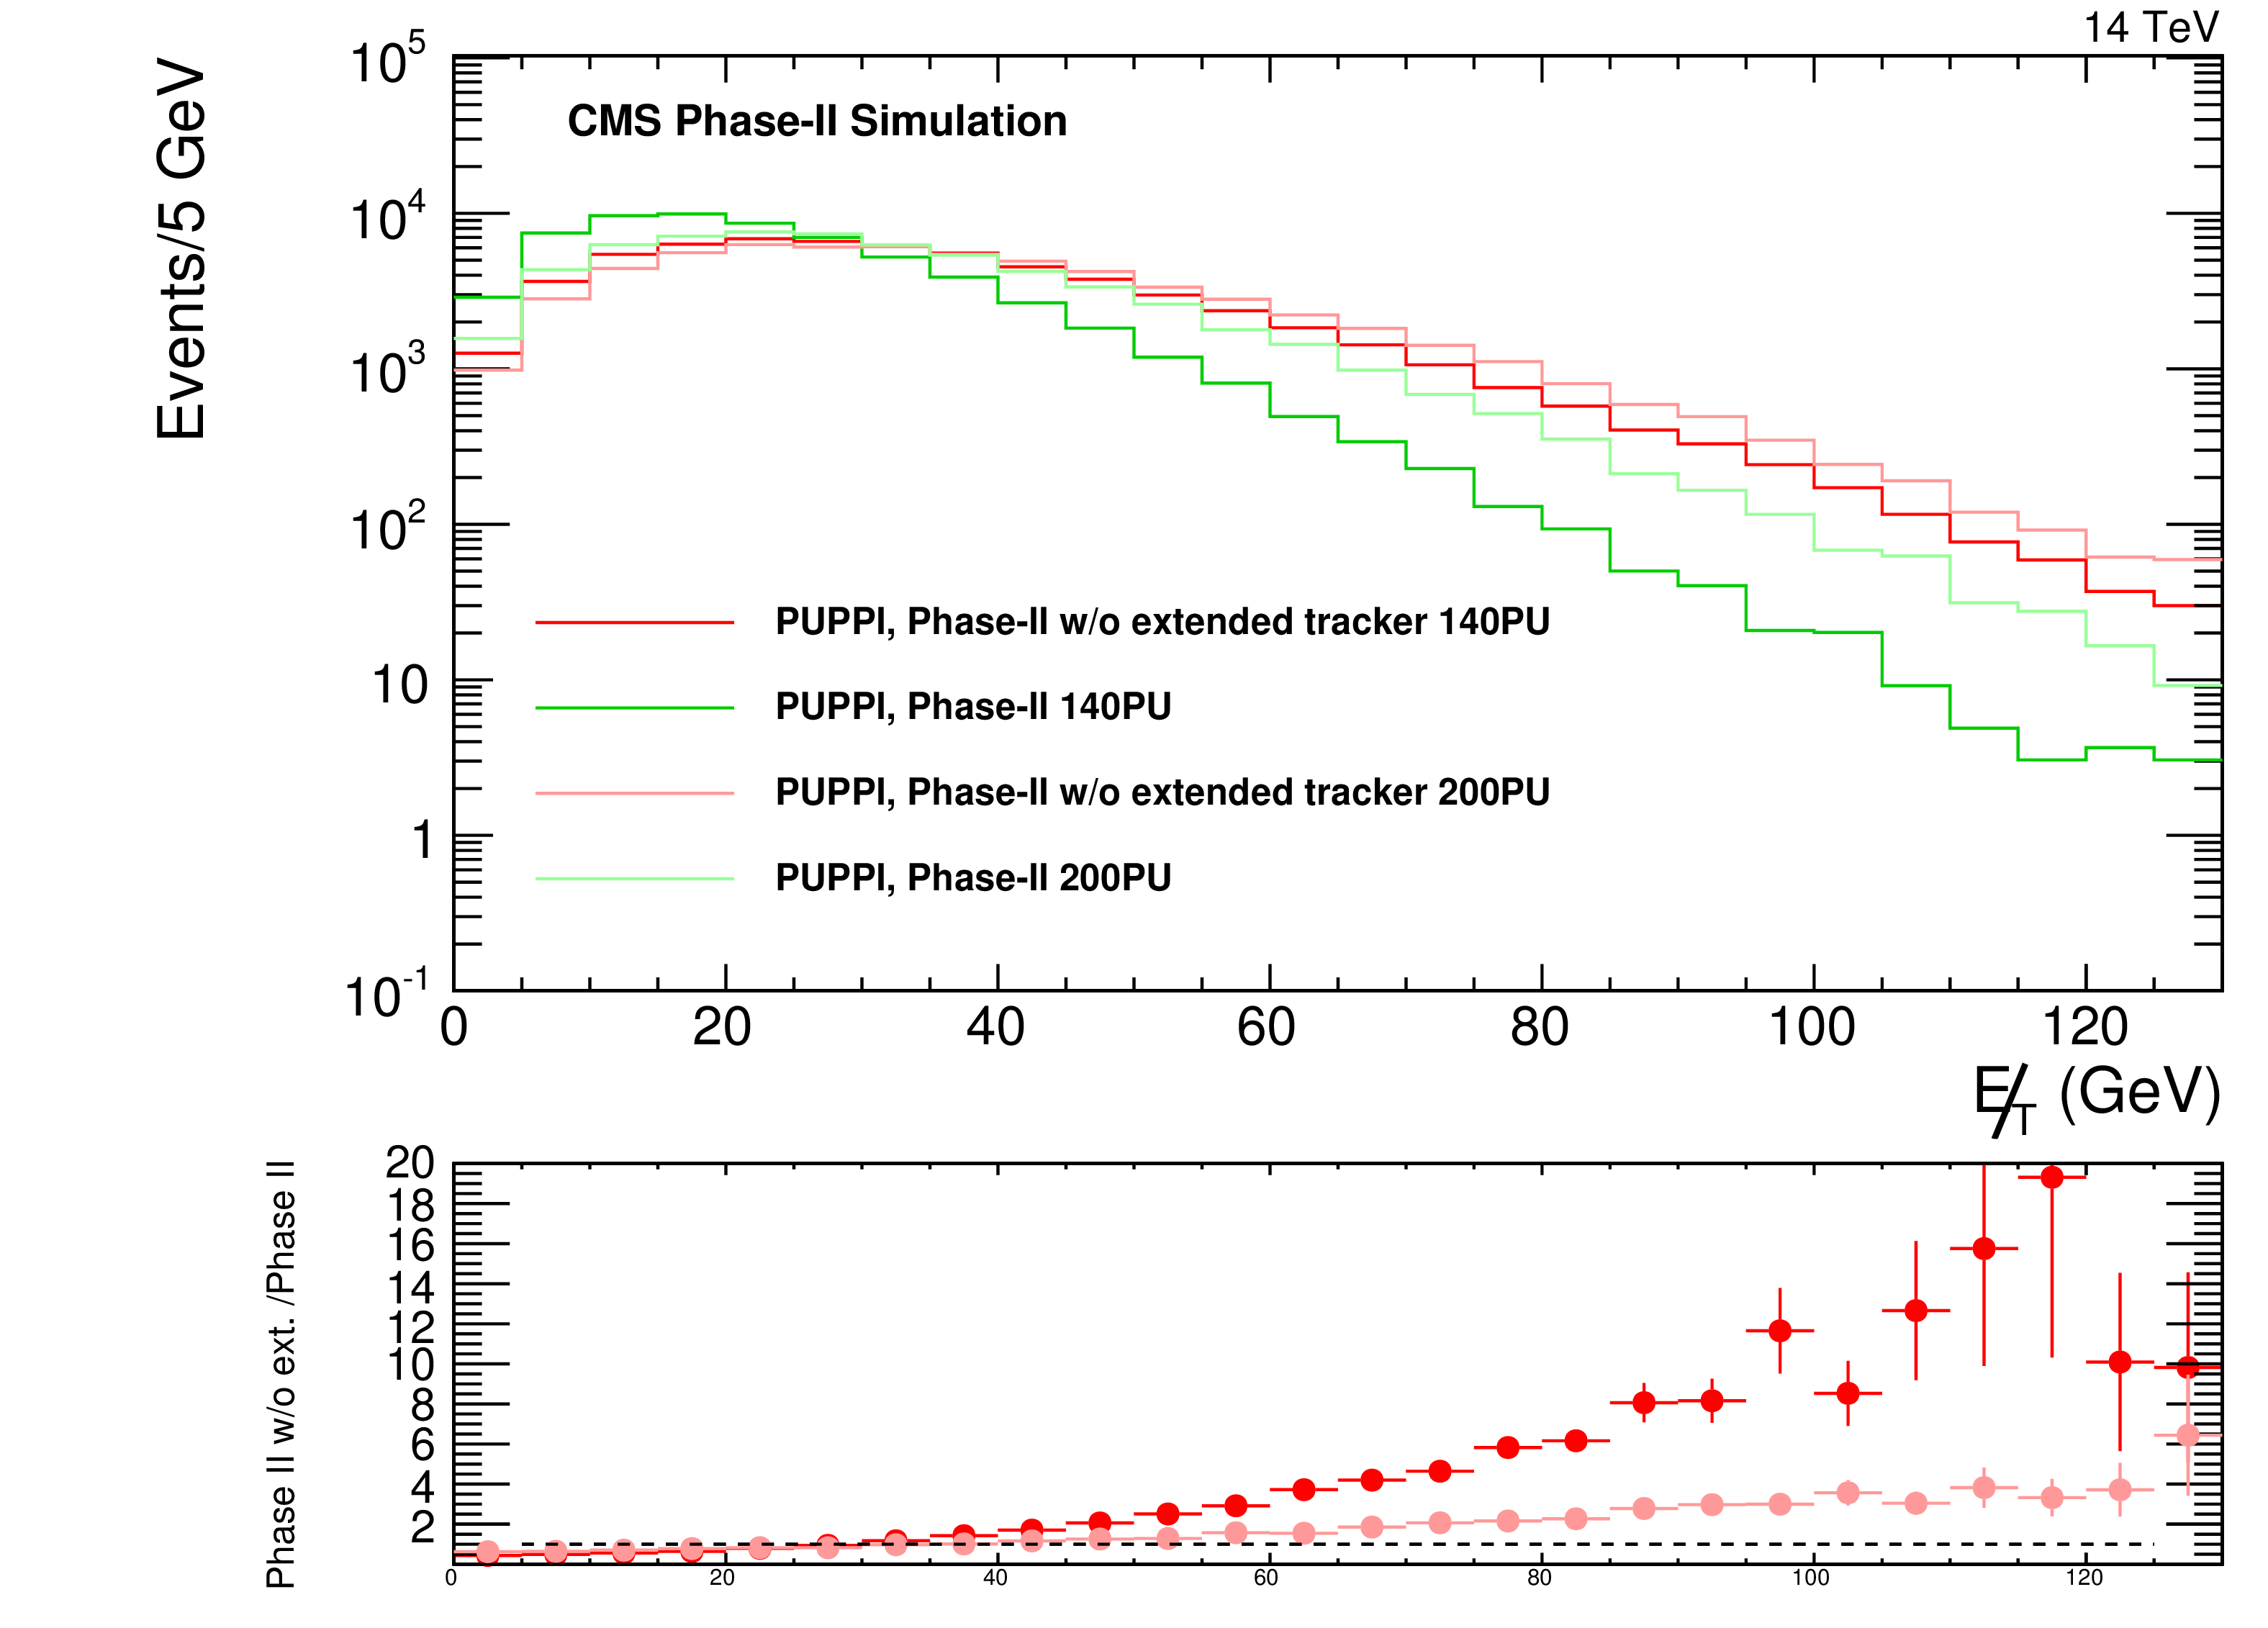
The $ {E_{\mathrm {T}}^{\text {miss}}} $ distribution for the reference detector with (green) and without (red) the high-$\eta $ tracking extension and the ratio of the number of events observed without and with the tracking extension vs $ {E_{\mathrm {T}}^{\text {miss}}} $ for events at $<$PU$>=140$ and $<$PU$>=200$. |
png ; pdf ; |
Figure 9-a:
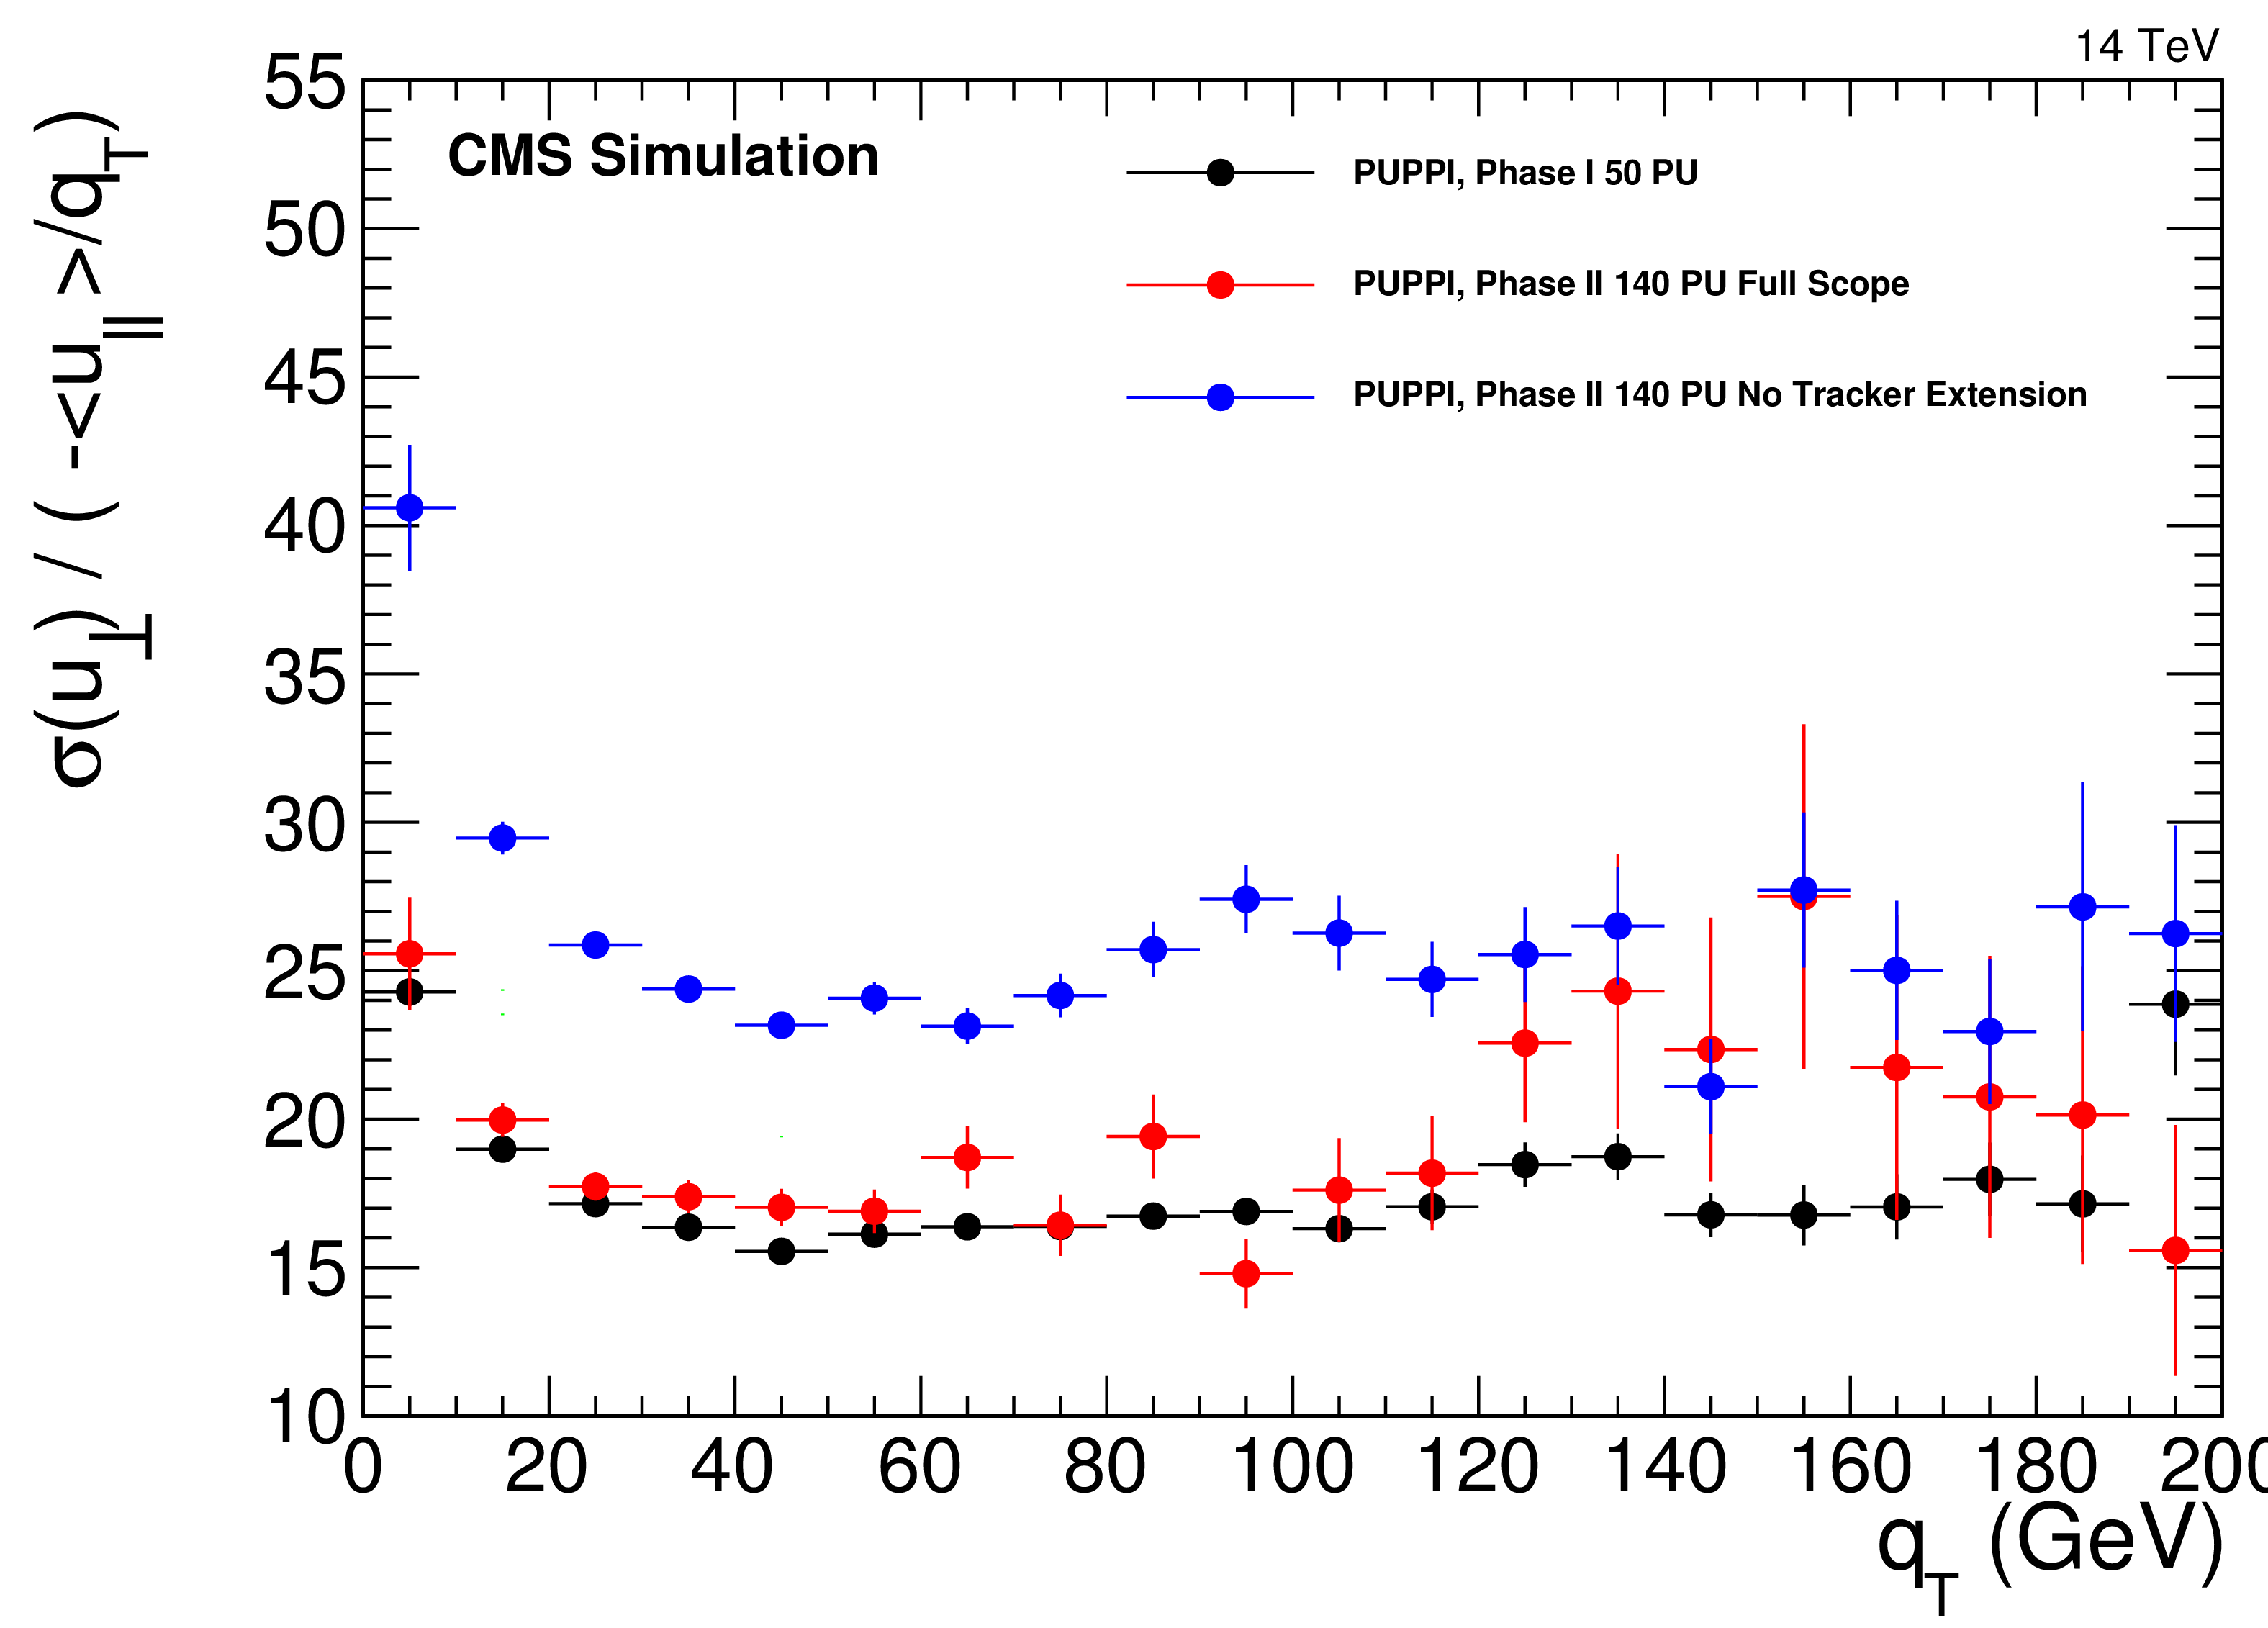
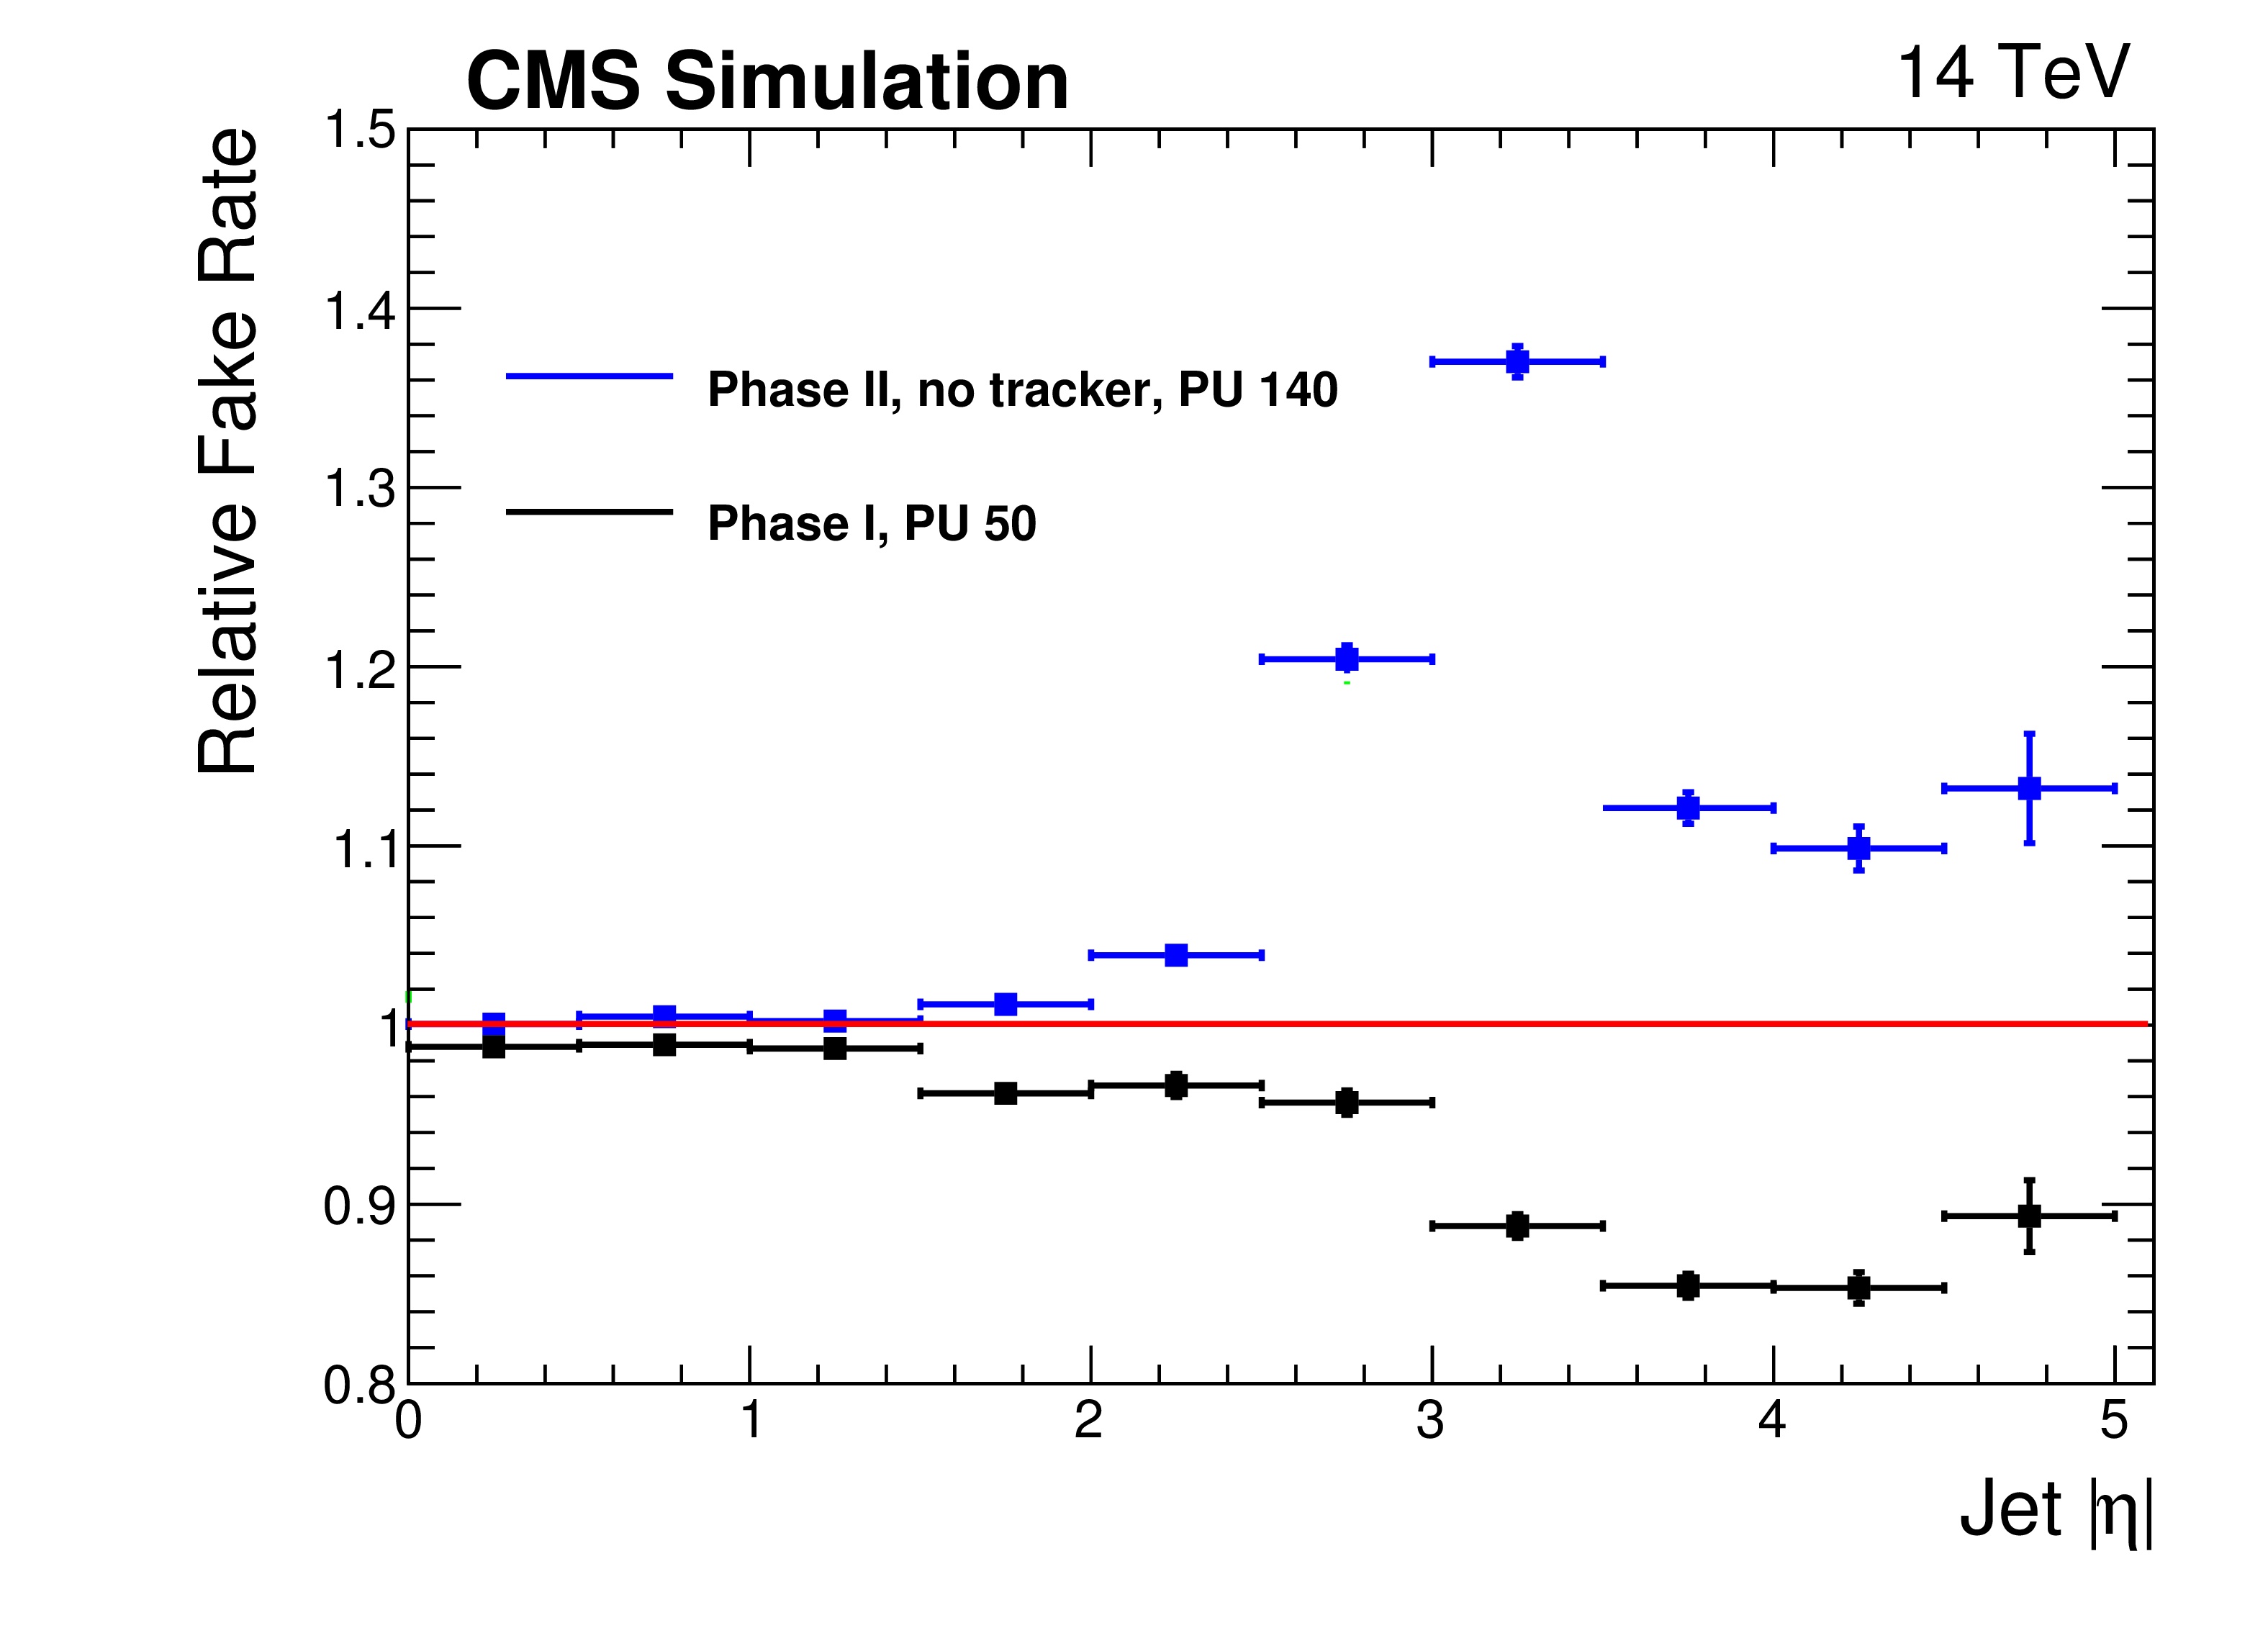
$ {E_{\mathrm {T}}^{\text {miss}}} $ distribution for the perpendicular component of hadronic recoil to Z boson, measured in $Z \rightarrow \mu \mu $, at $<$PU$>=140$ with the high-$\eta $ tracking extension (red) and without (blue). Results for Phase I at $<$PU$>=50$ (black) are also included (left). Relative rate of additional misidentified jets as a function of pseudorapidity for different pileup configuration. Results are shown relative to the performance of the reference reference detector at $<$PU$>=140$ for the reference detector without tracking extension at $<$PU$>=140$ (blue) and Phase I at $<$PU$>=50$ (black) (right). |
png ; pdf ; |
Figure 9-b:
$ {E_{\mathrm {T}}^{\text {miss}}} $ distribution for the perpendicular component of hadronic recoil to Z boson, measured in $Z \rightarrow \mu \mu $, at $<$PU$>=140$ with the high-$\eta $ tracking extension (red) and without (blue). Results for Phase I at $<$PU$>=50$ (black) are also included (left). Relative rate of additional misidentified jets as a function of pseudorapidity for different pileup configuration. Results are shown relative to the performance of the reference reference detector at $<$PU$>=140$ for the reference detector without tracking extension at $<$PU$>=140$ (blue) and Phase I at $<$PU$>=50$ (black) (right). |

png ; pdf ; |
Figure 10:
Four lepton mass distributions obtained with 3000 fb$^{-1}$ for the signal sample, $H \rightarrow ZZ \rightarrow 4\mu $, and for the irreducible $ZZ \rightarrow 4\mu $ background. The mass distributions are shown for a muon pseudorapidity coverage of 2.4 and 3.0 (right). |
png ; pdf ; |
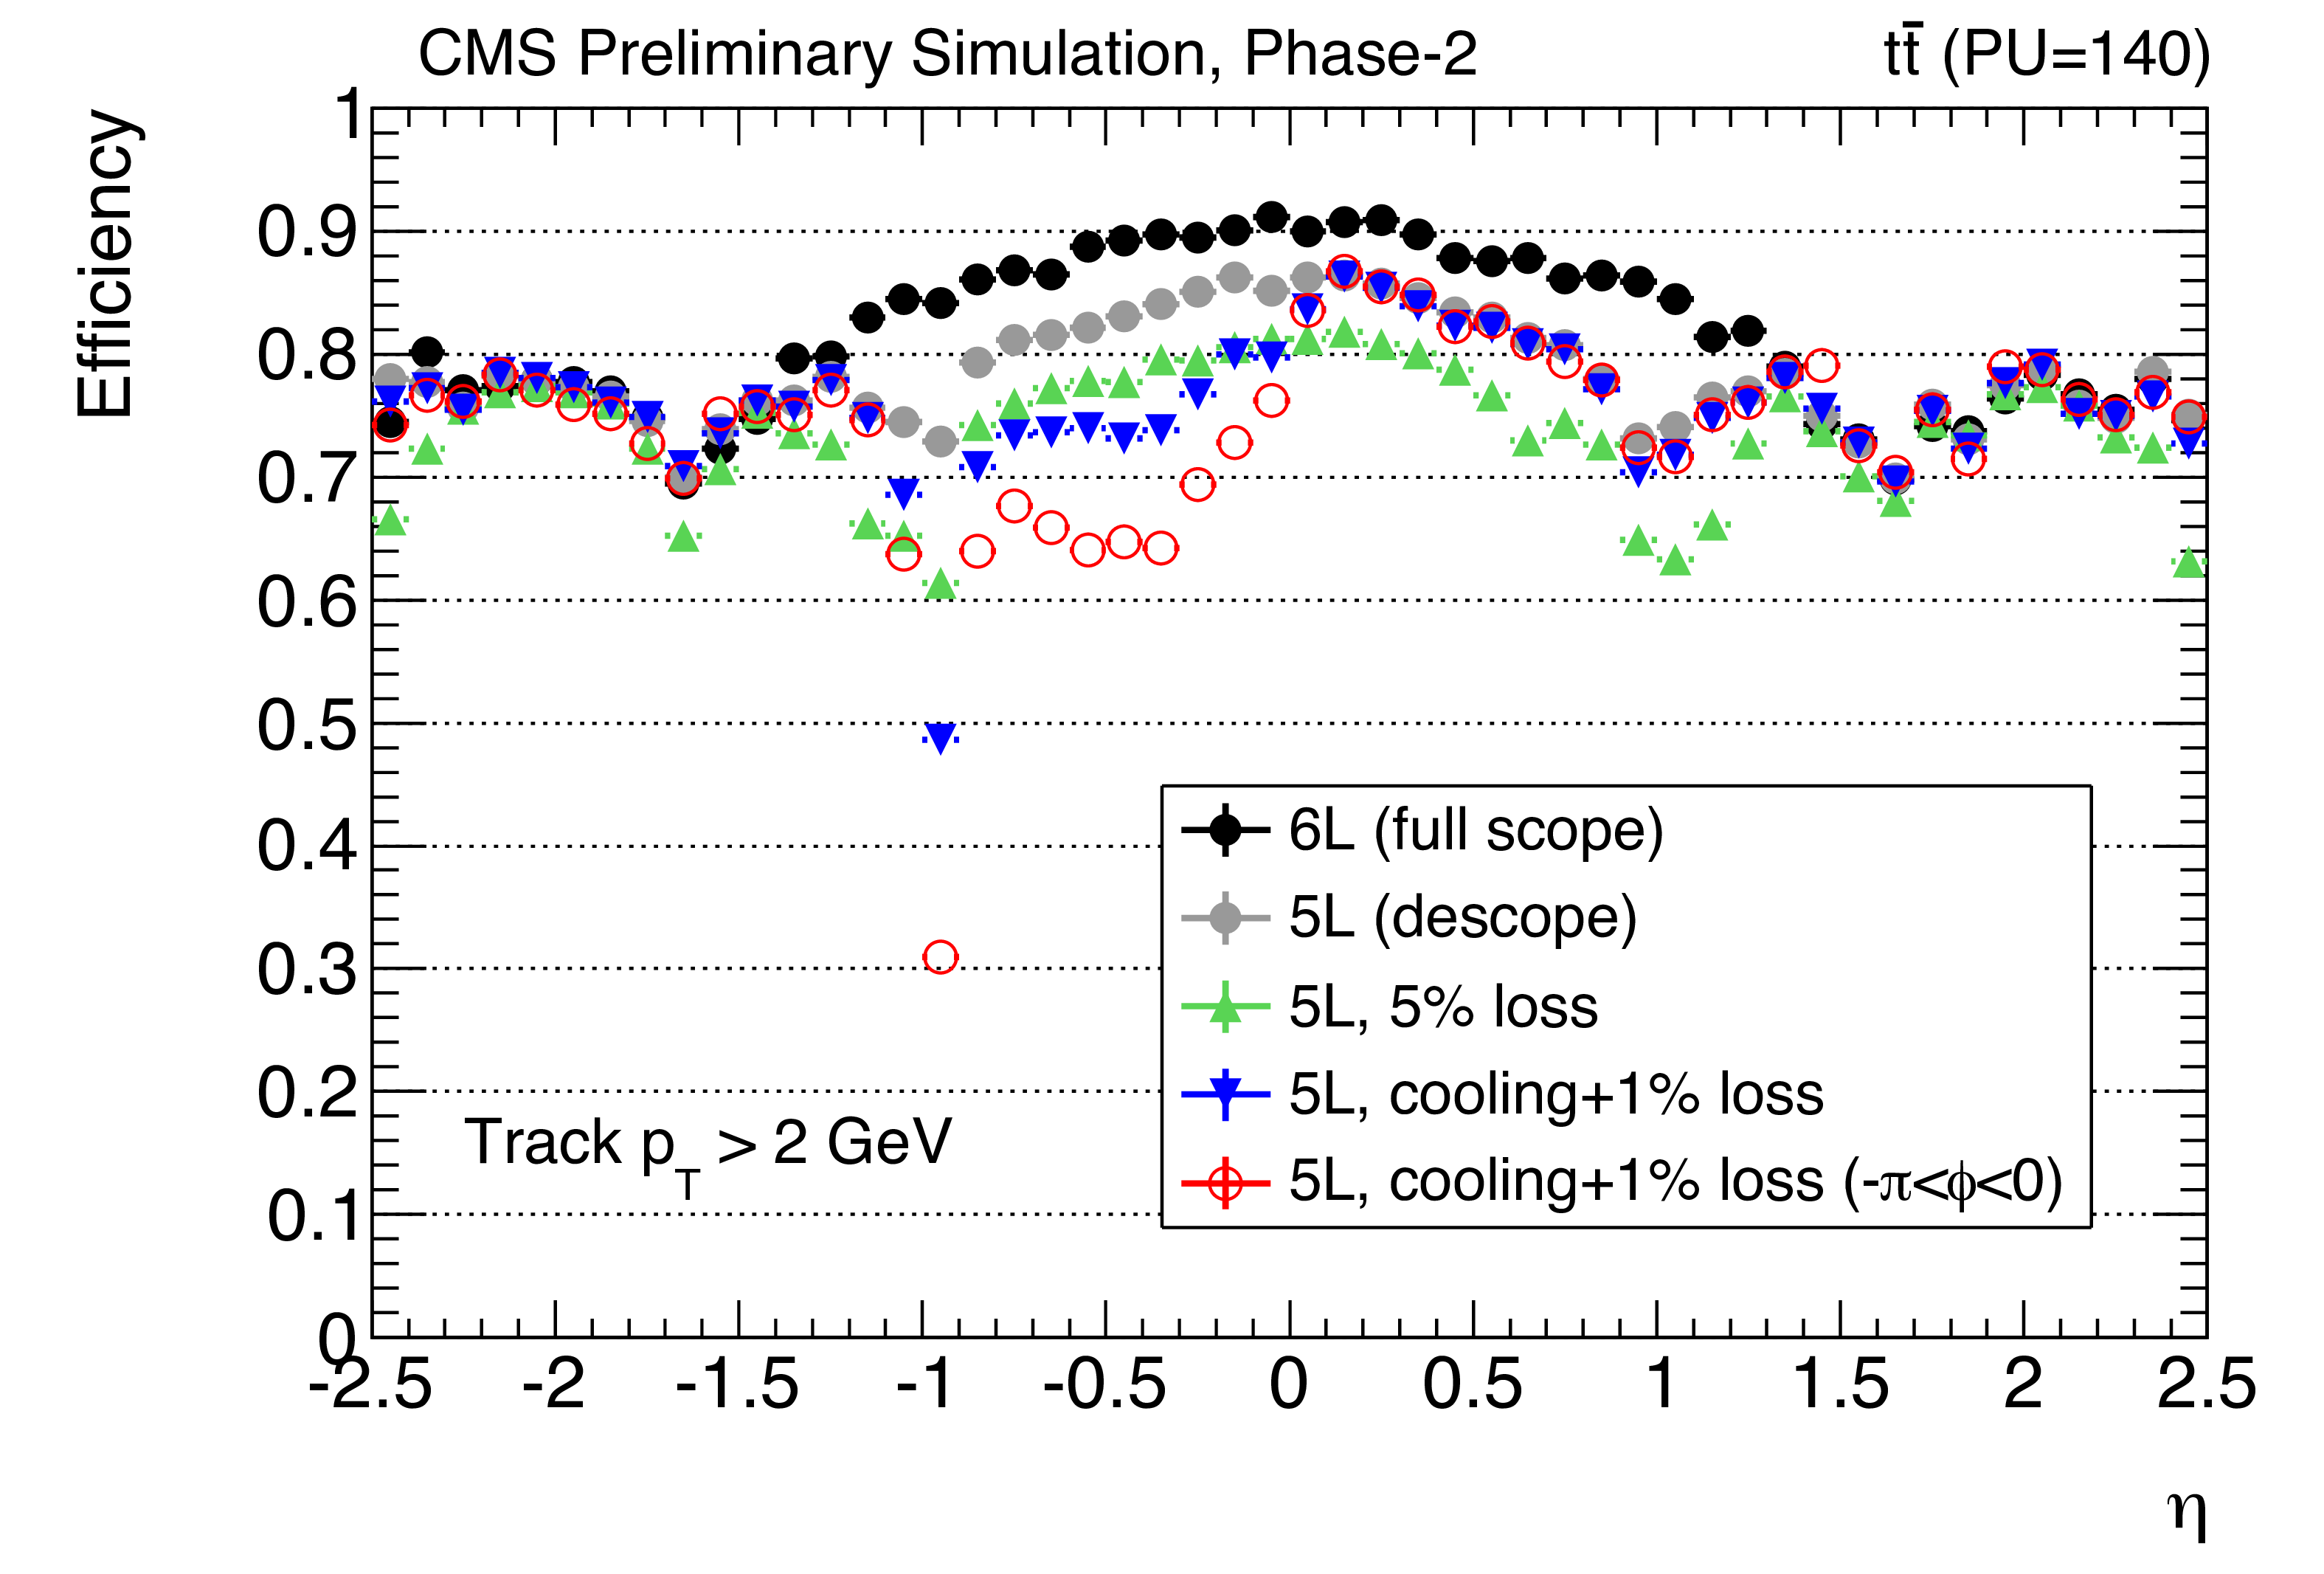
Figure 11-a:
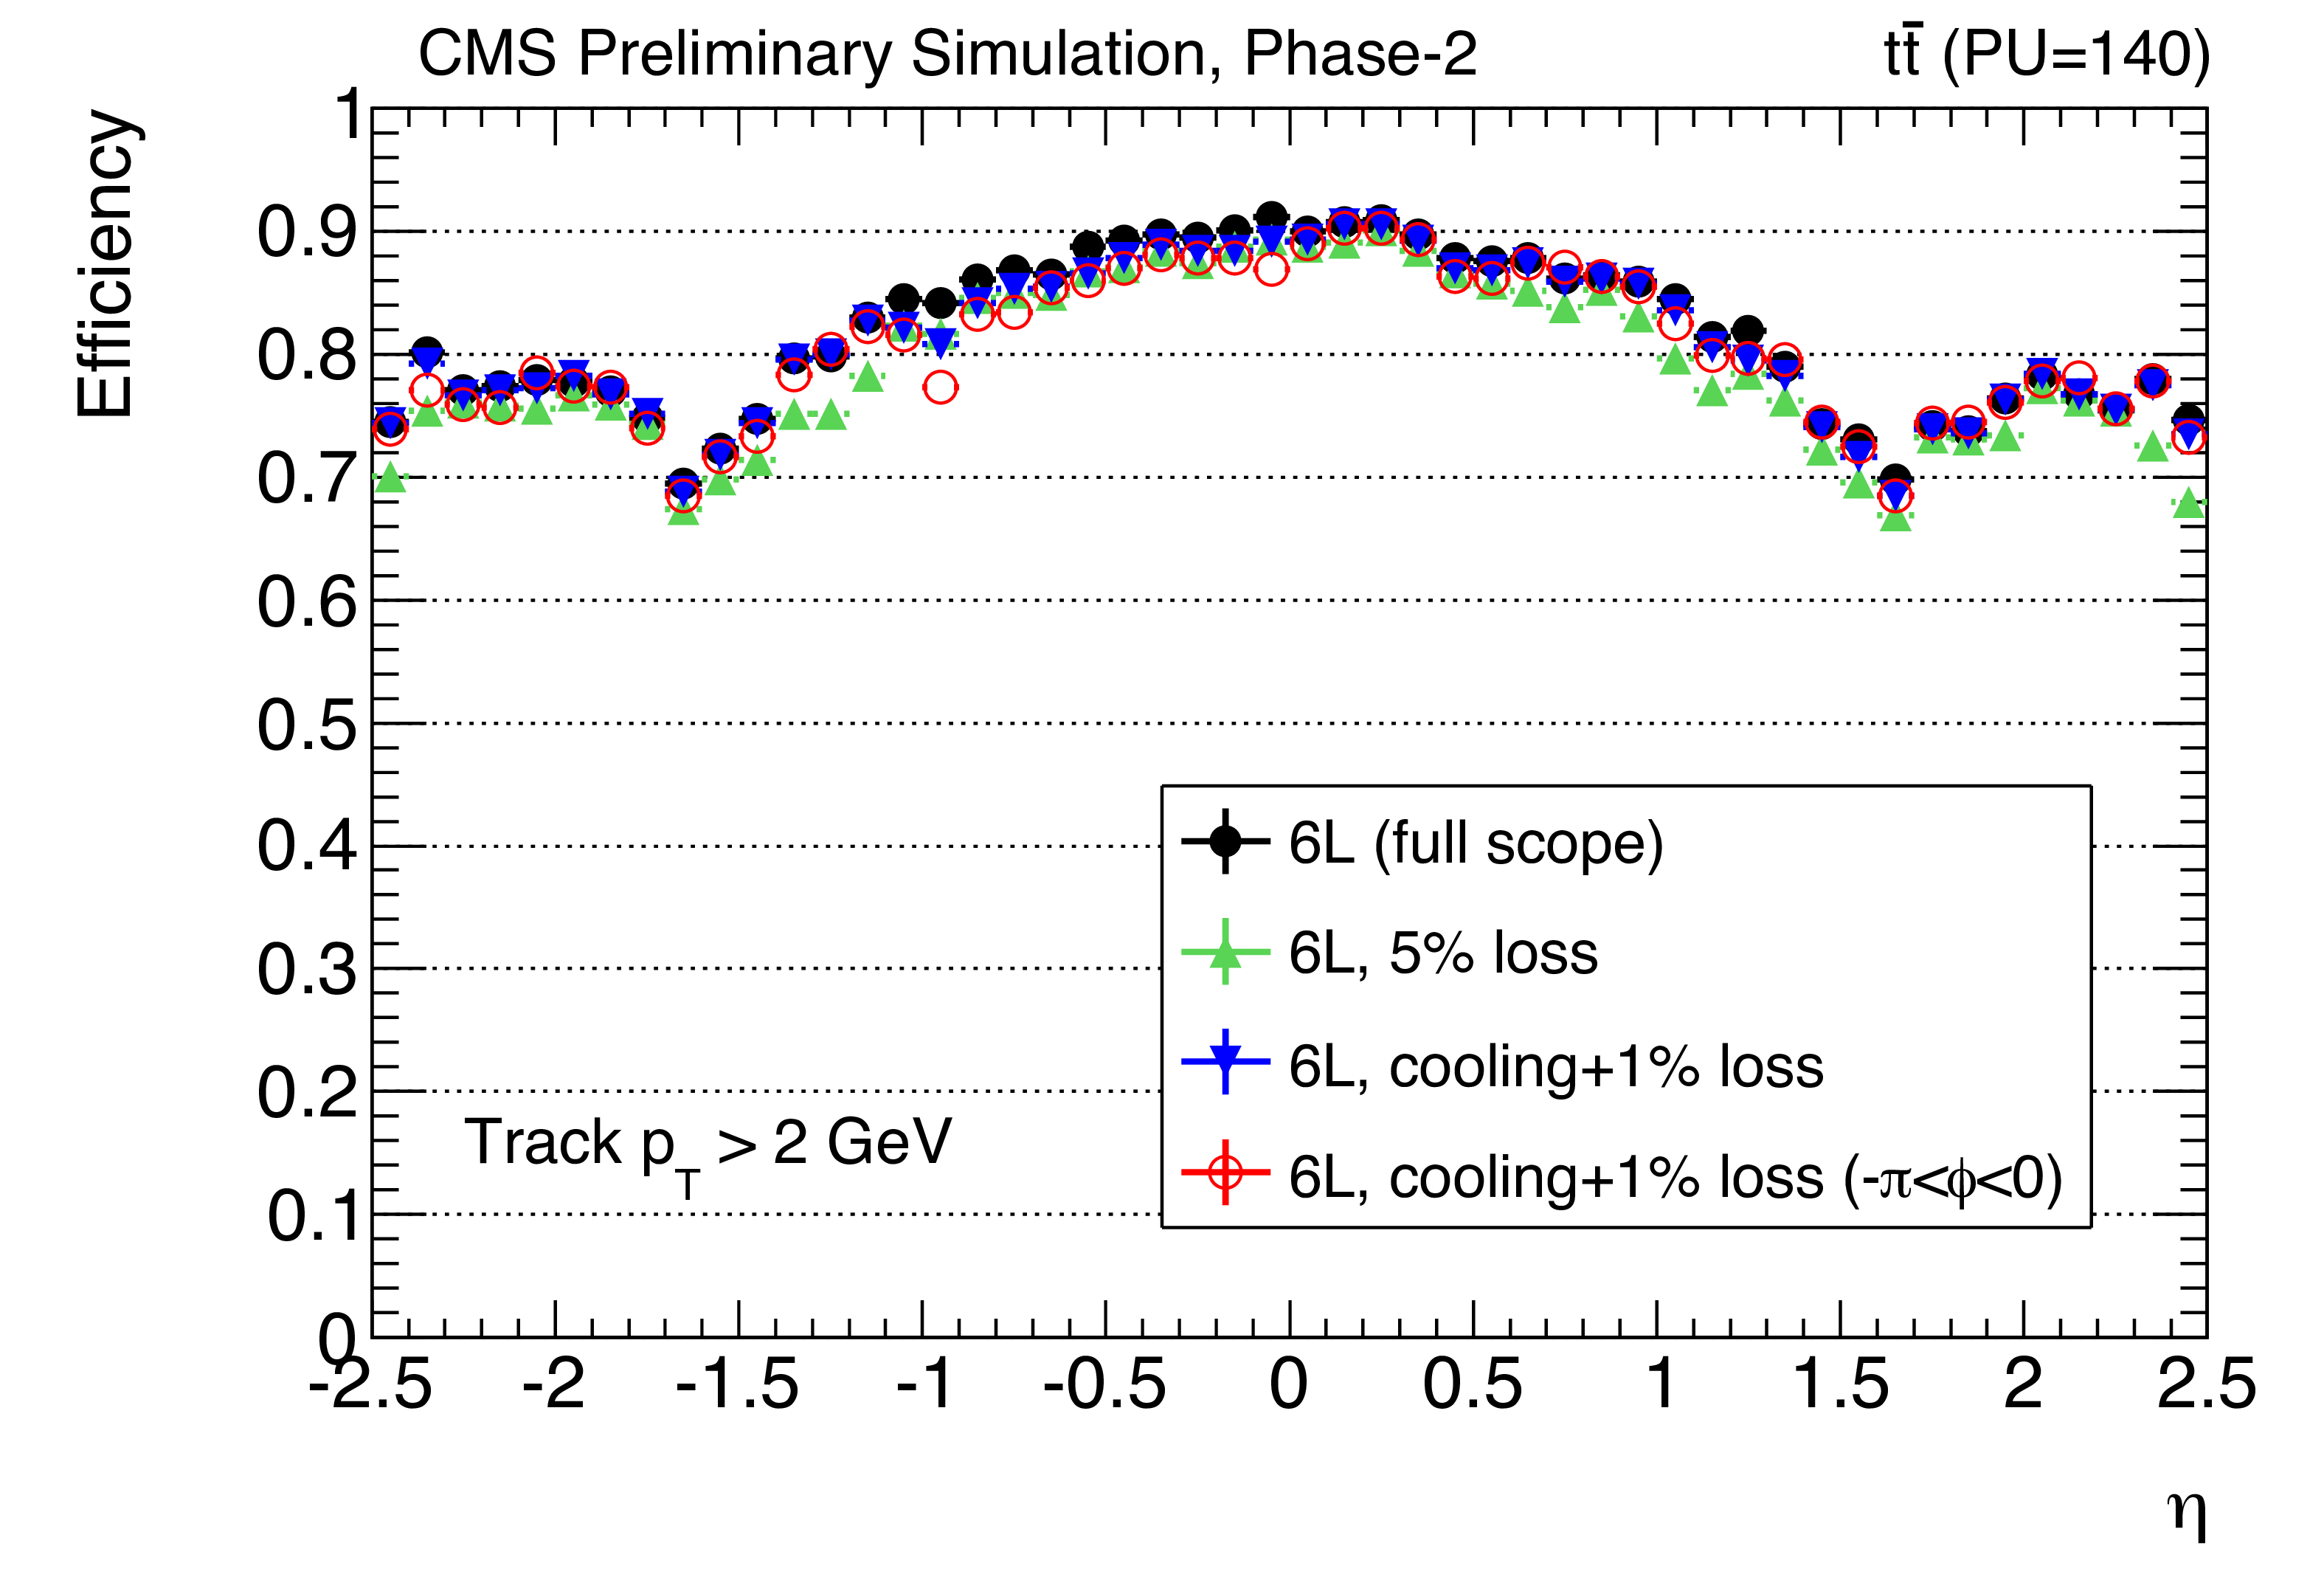
Track trigger efficiency as function of pseudo-rapidity and transverse momentum for different detector configurations and charged particles (top-pair, electrons). The red dots show the efficiency in the limited angular region of the missing cooling loop. |
png ; pdf ; |
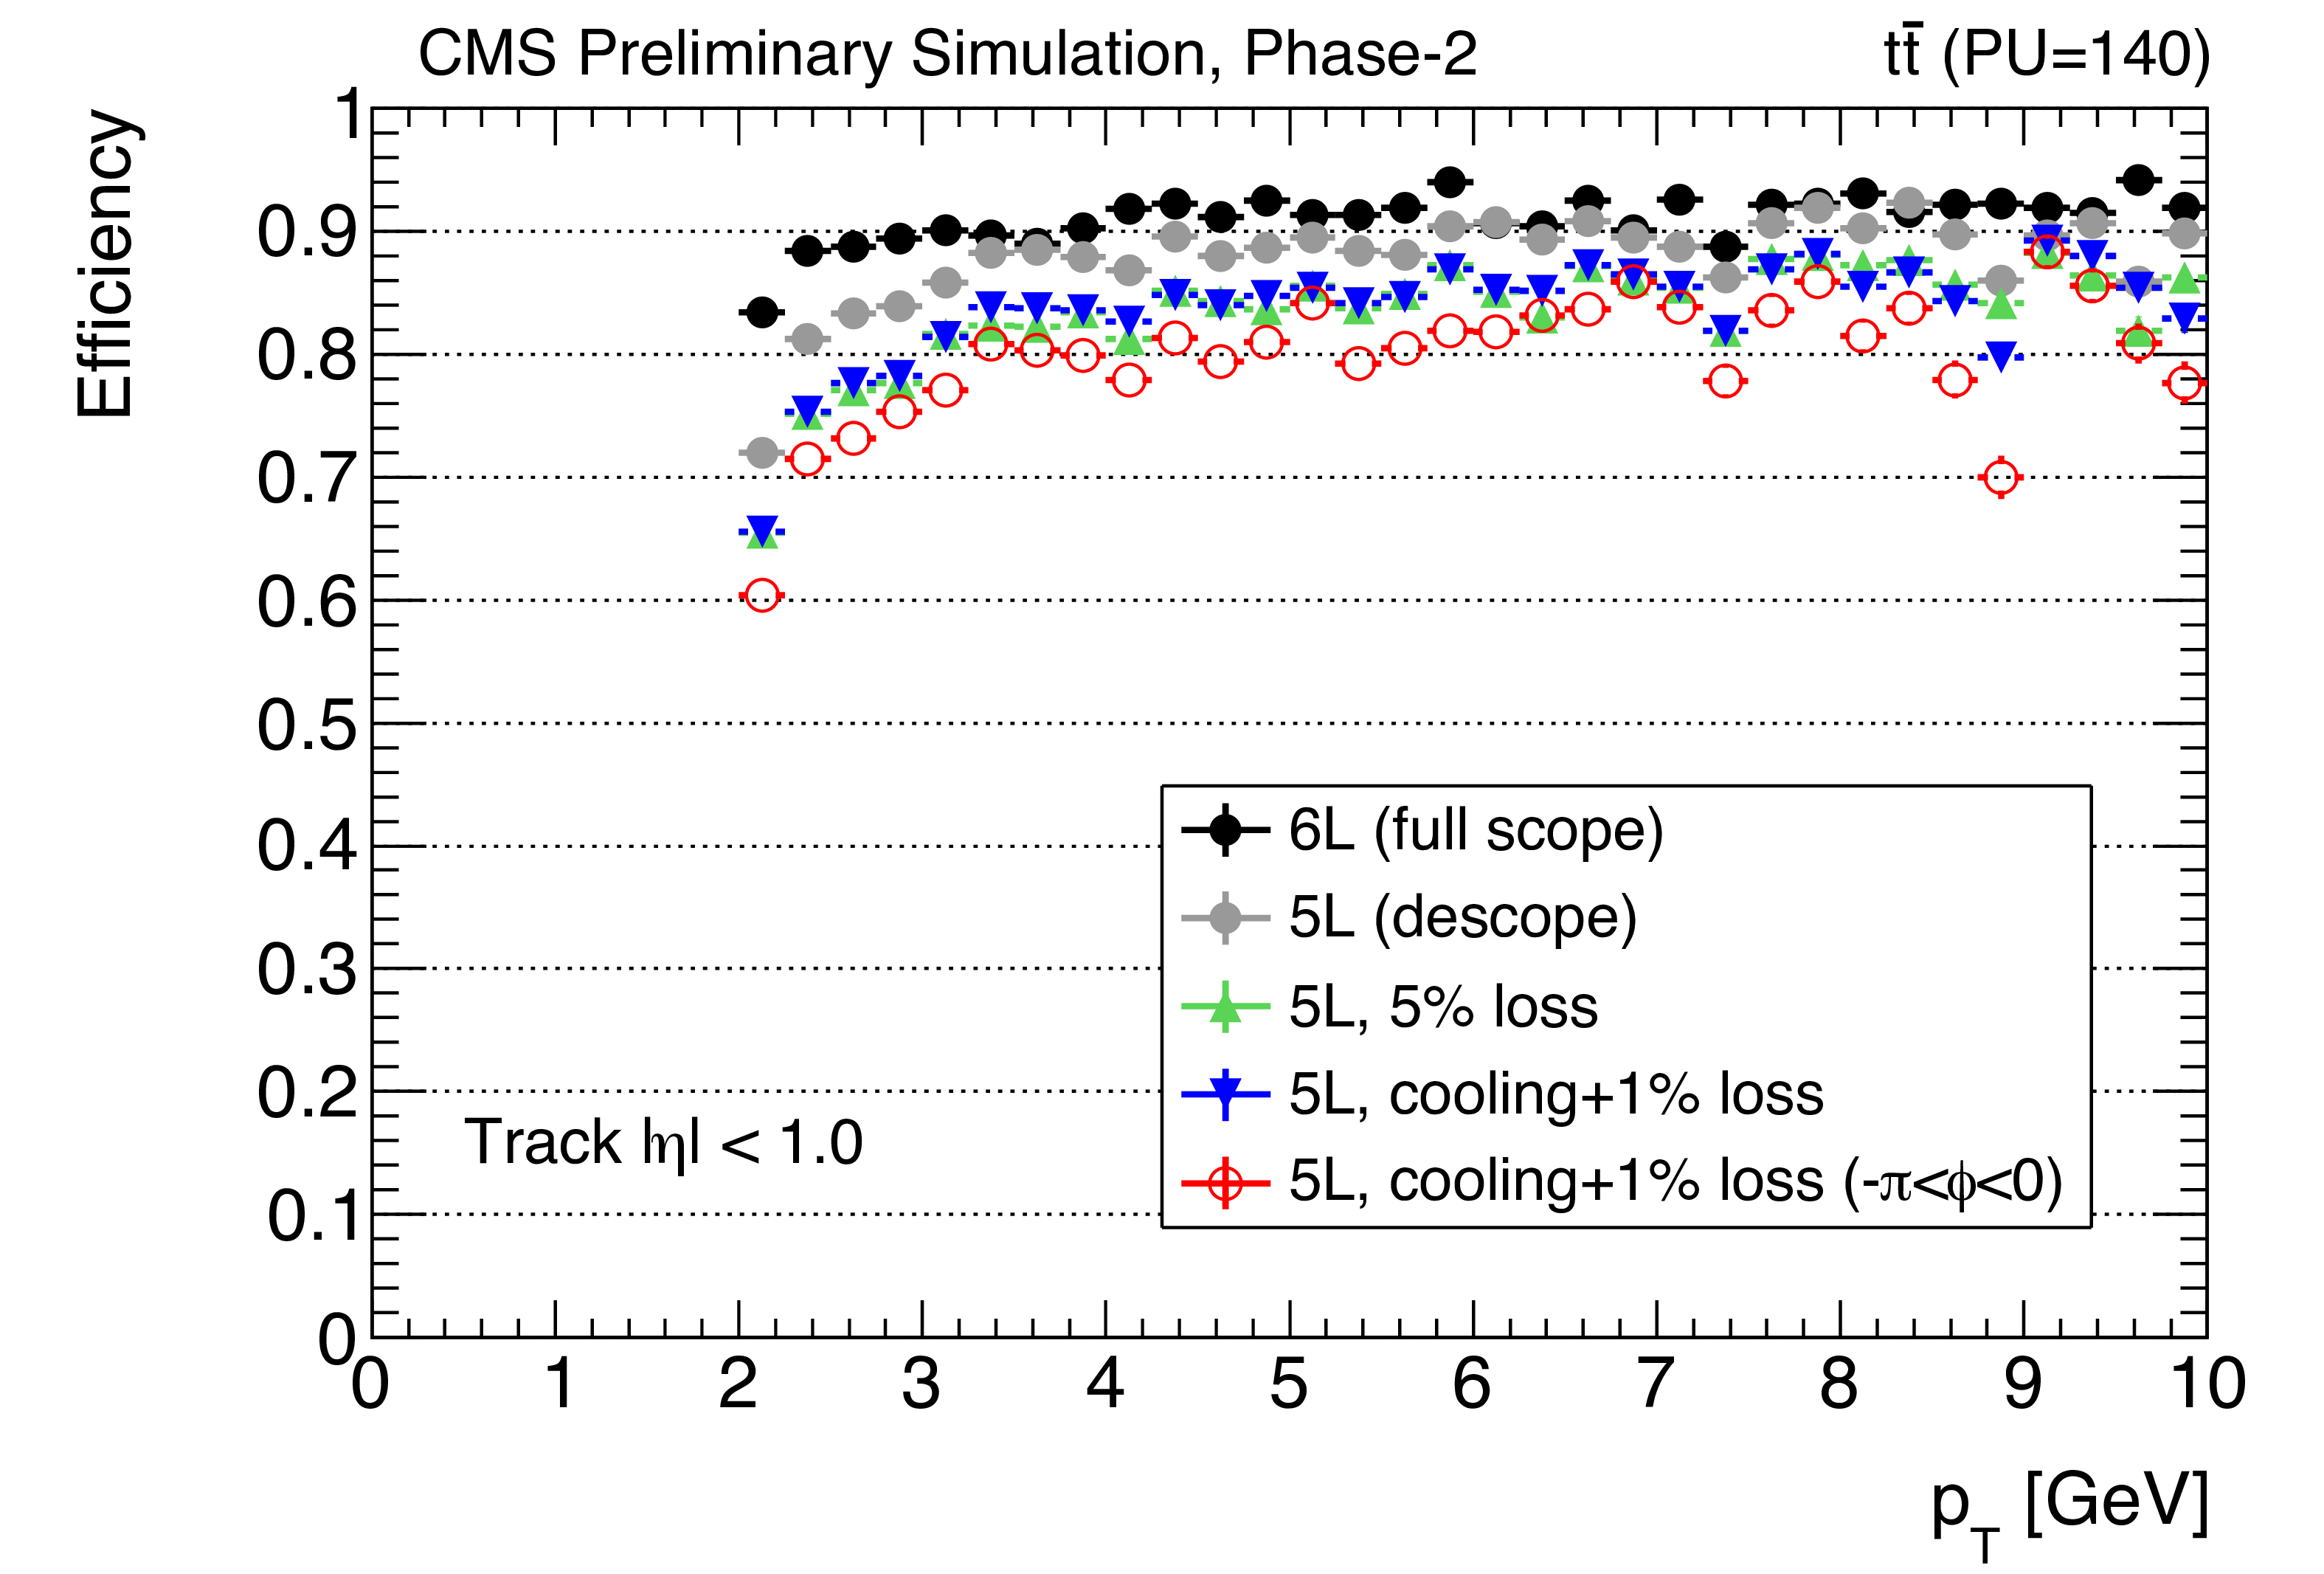
Figure 11-b:
Track trigger efficiency as function of pseudo-rapidity and transverse momentum for different detector configurations and charged particles (top-pair, electrons). The red dots show the efficiency in the limited angular region of the missing cooling loop. |
png ; pdf ; |
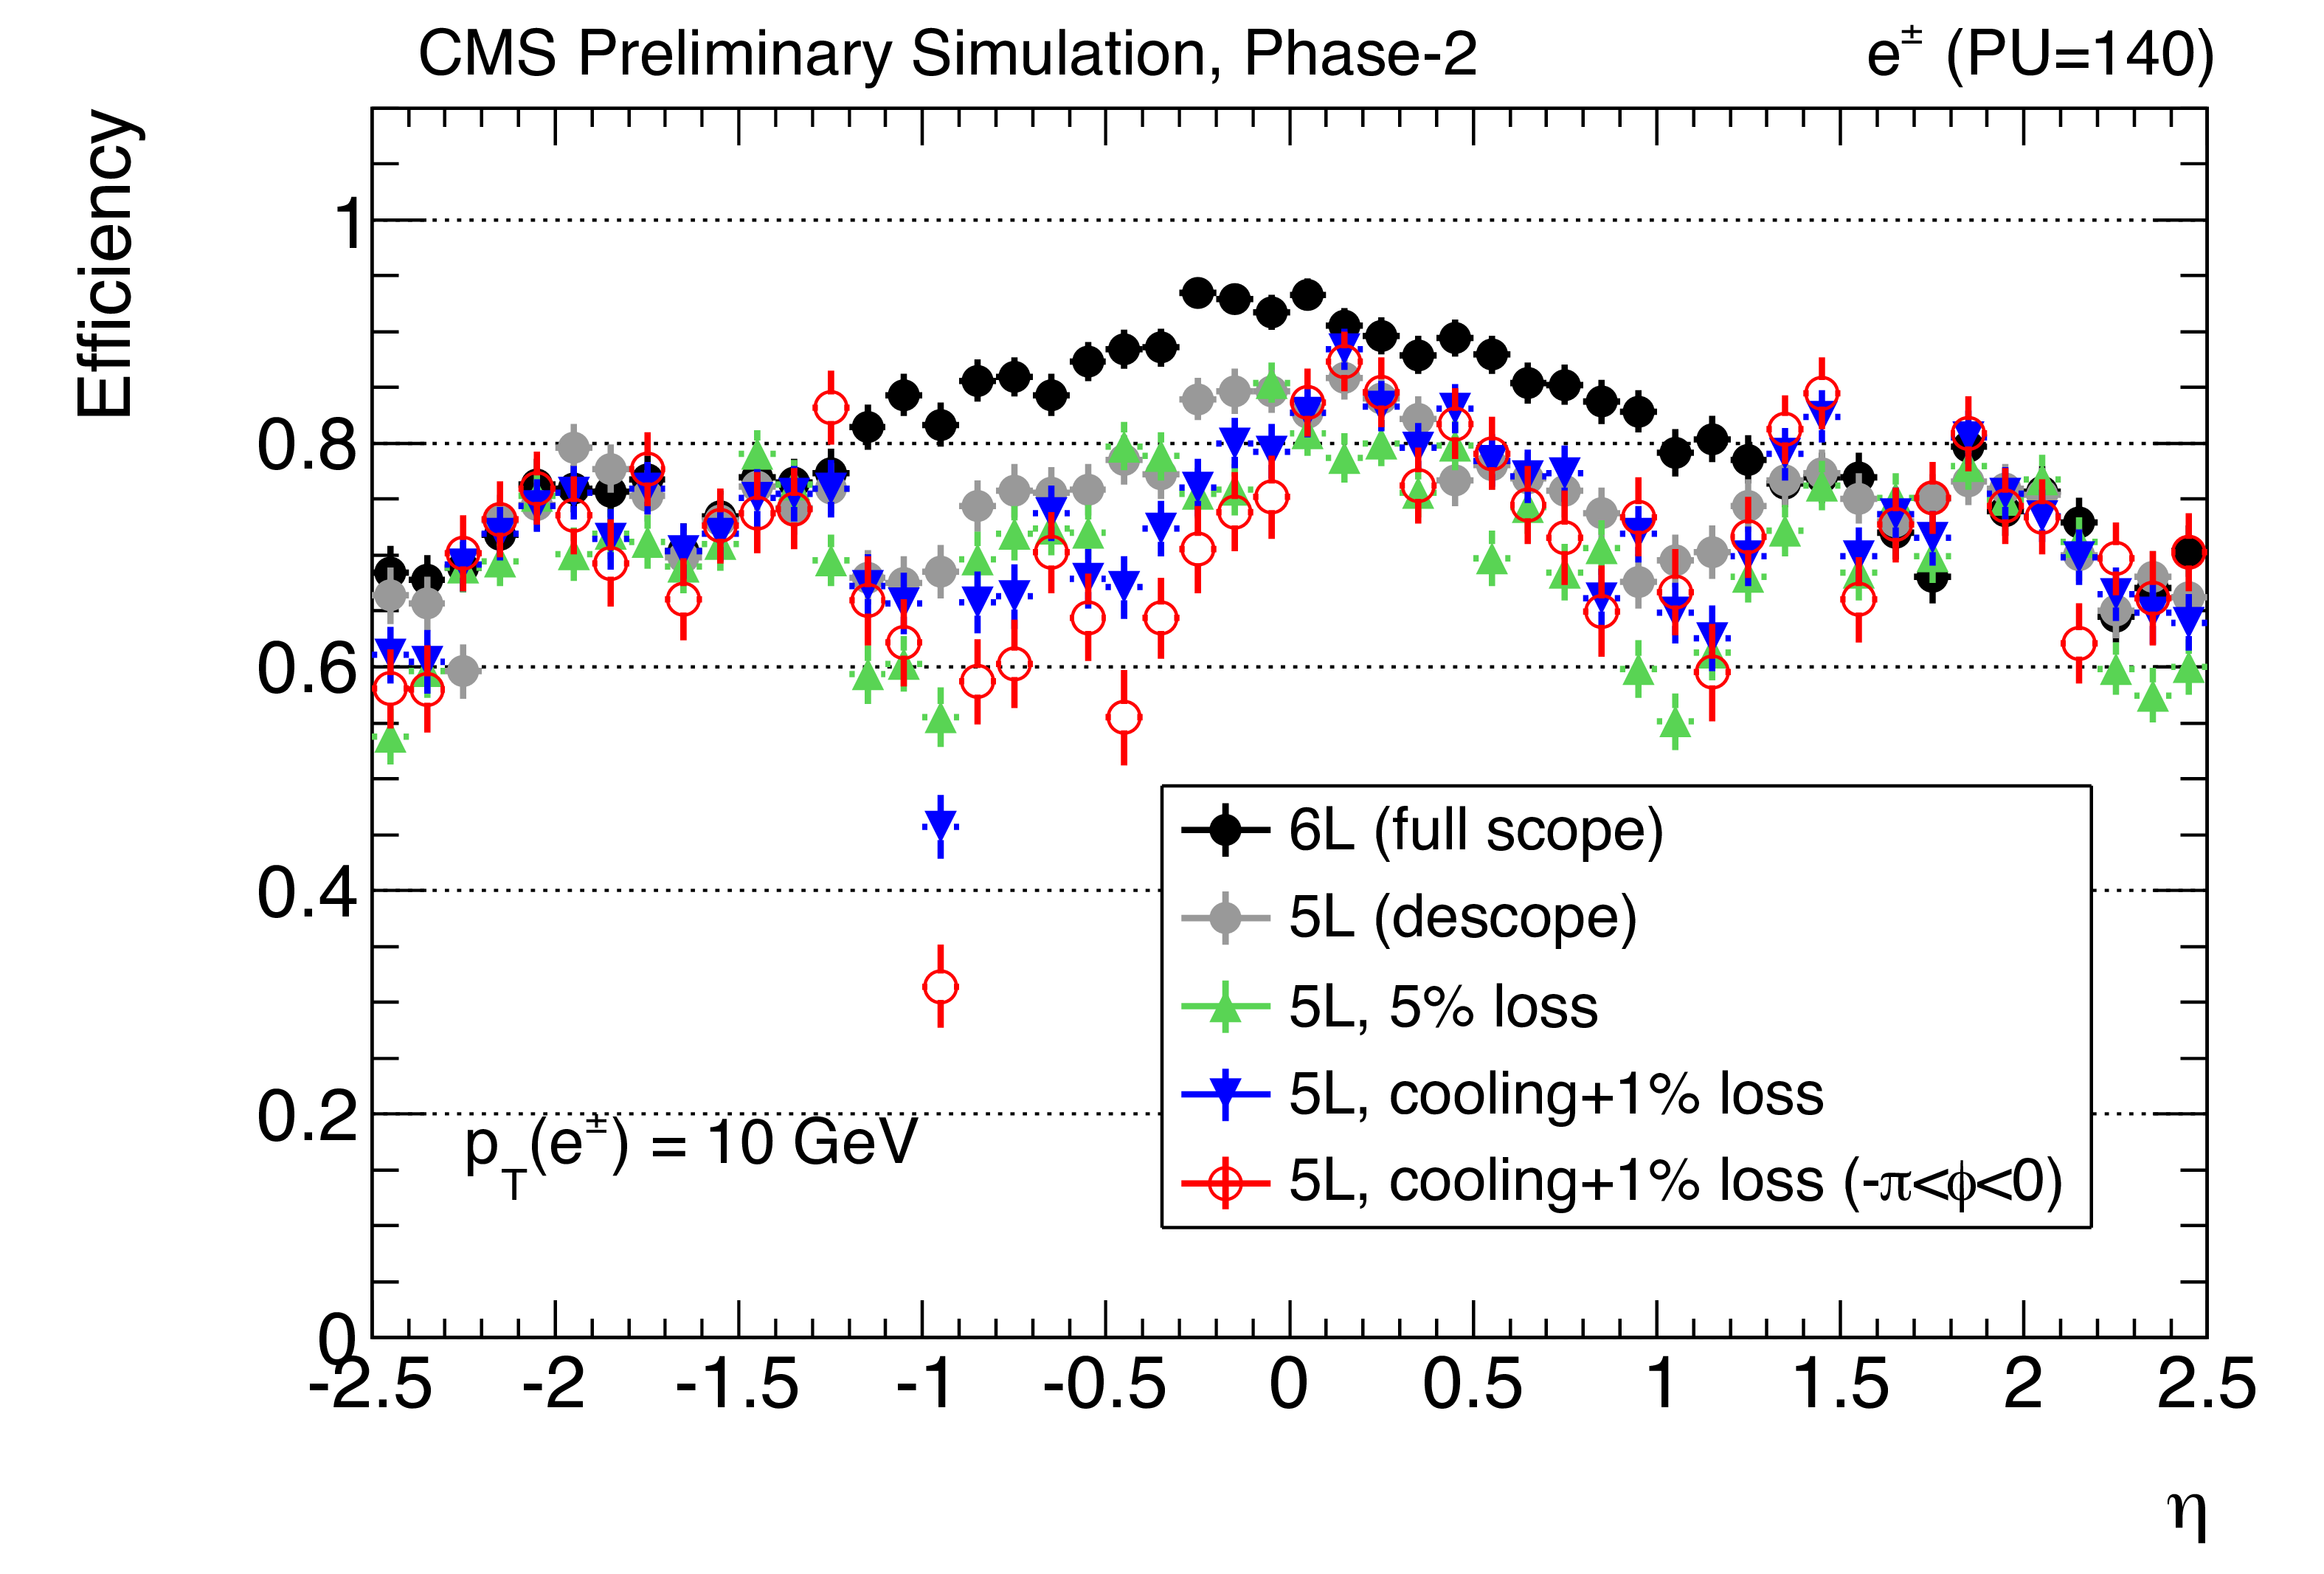
Figure 11-c:
Track trigger efficiency as function of pseudo-rapidity and transverse momentum for different detector configurations and charged particles (top-pair, electrons). The red dots show the efficiency in the limited angular region of the missing cooling loop. |
png ; pdf ; |
Figure 11-d:
Track trigger efficiency as function of pseudo-rapidity and transverse momentum for different detector configurations and charged particles (top-pair, electrons). The red dots show the efficiency in the limited angular region of the missing cooling loop. |
png ; pdf ; |
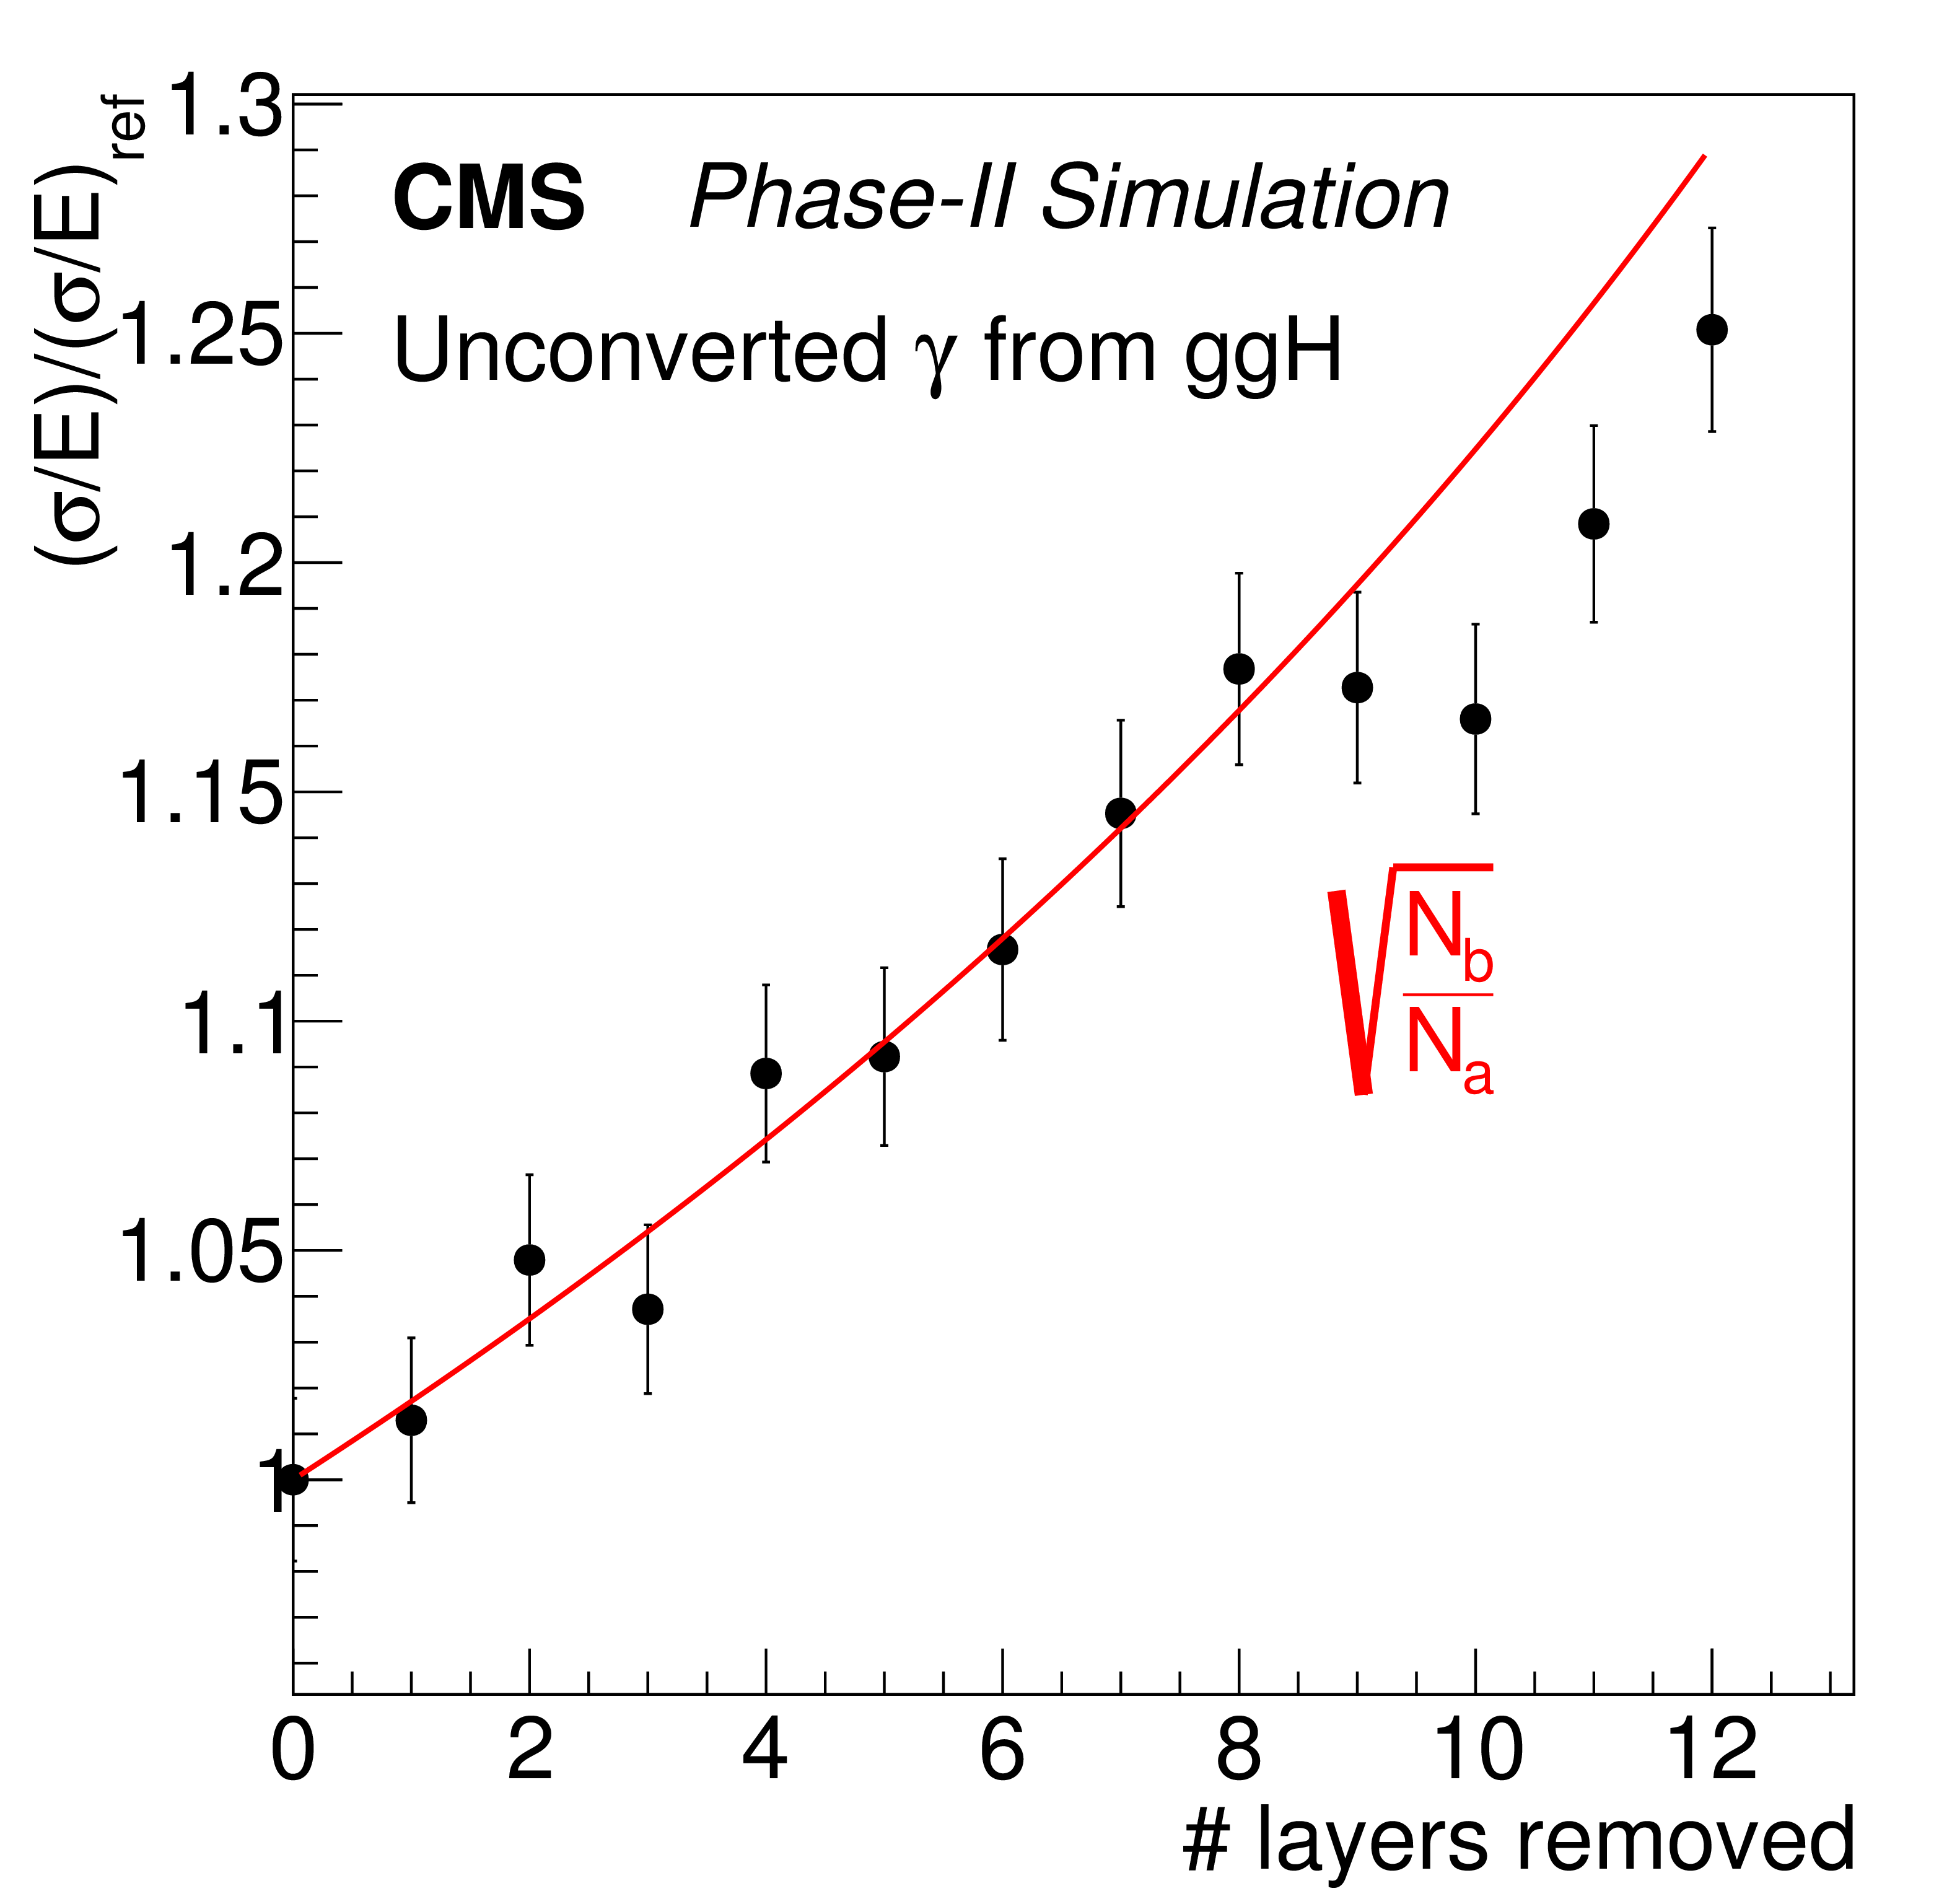
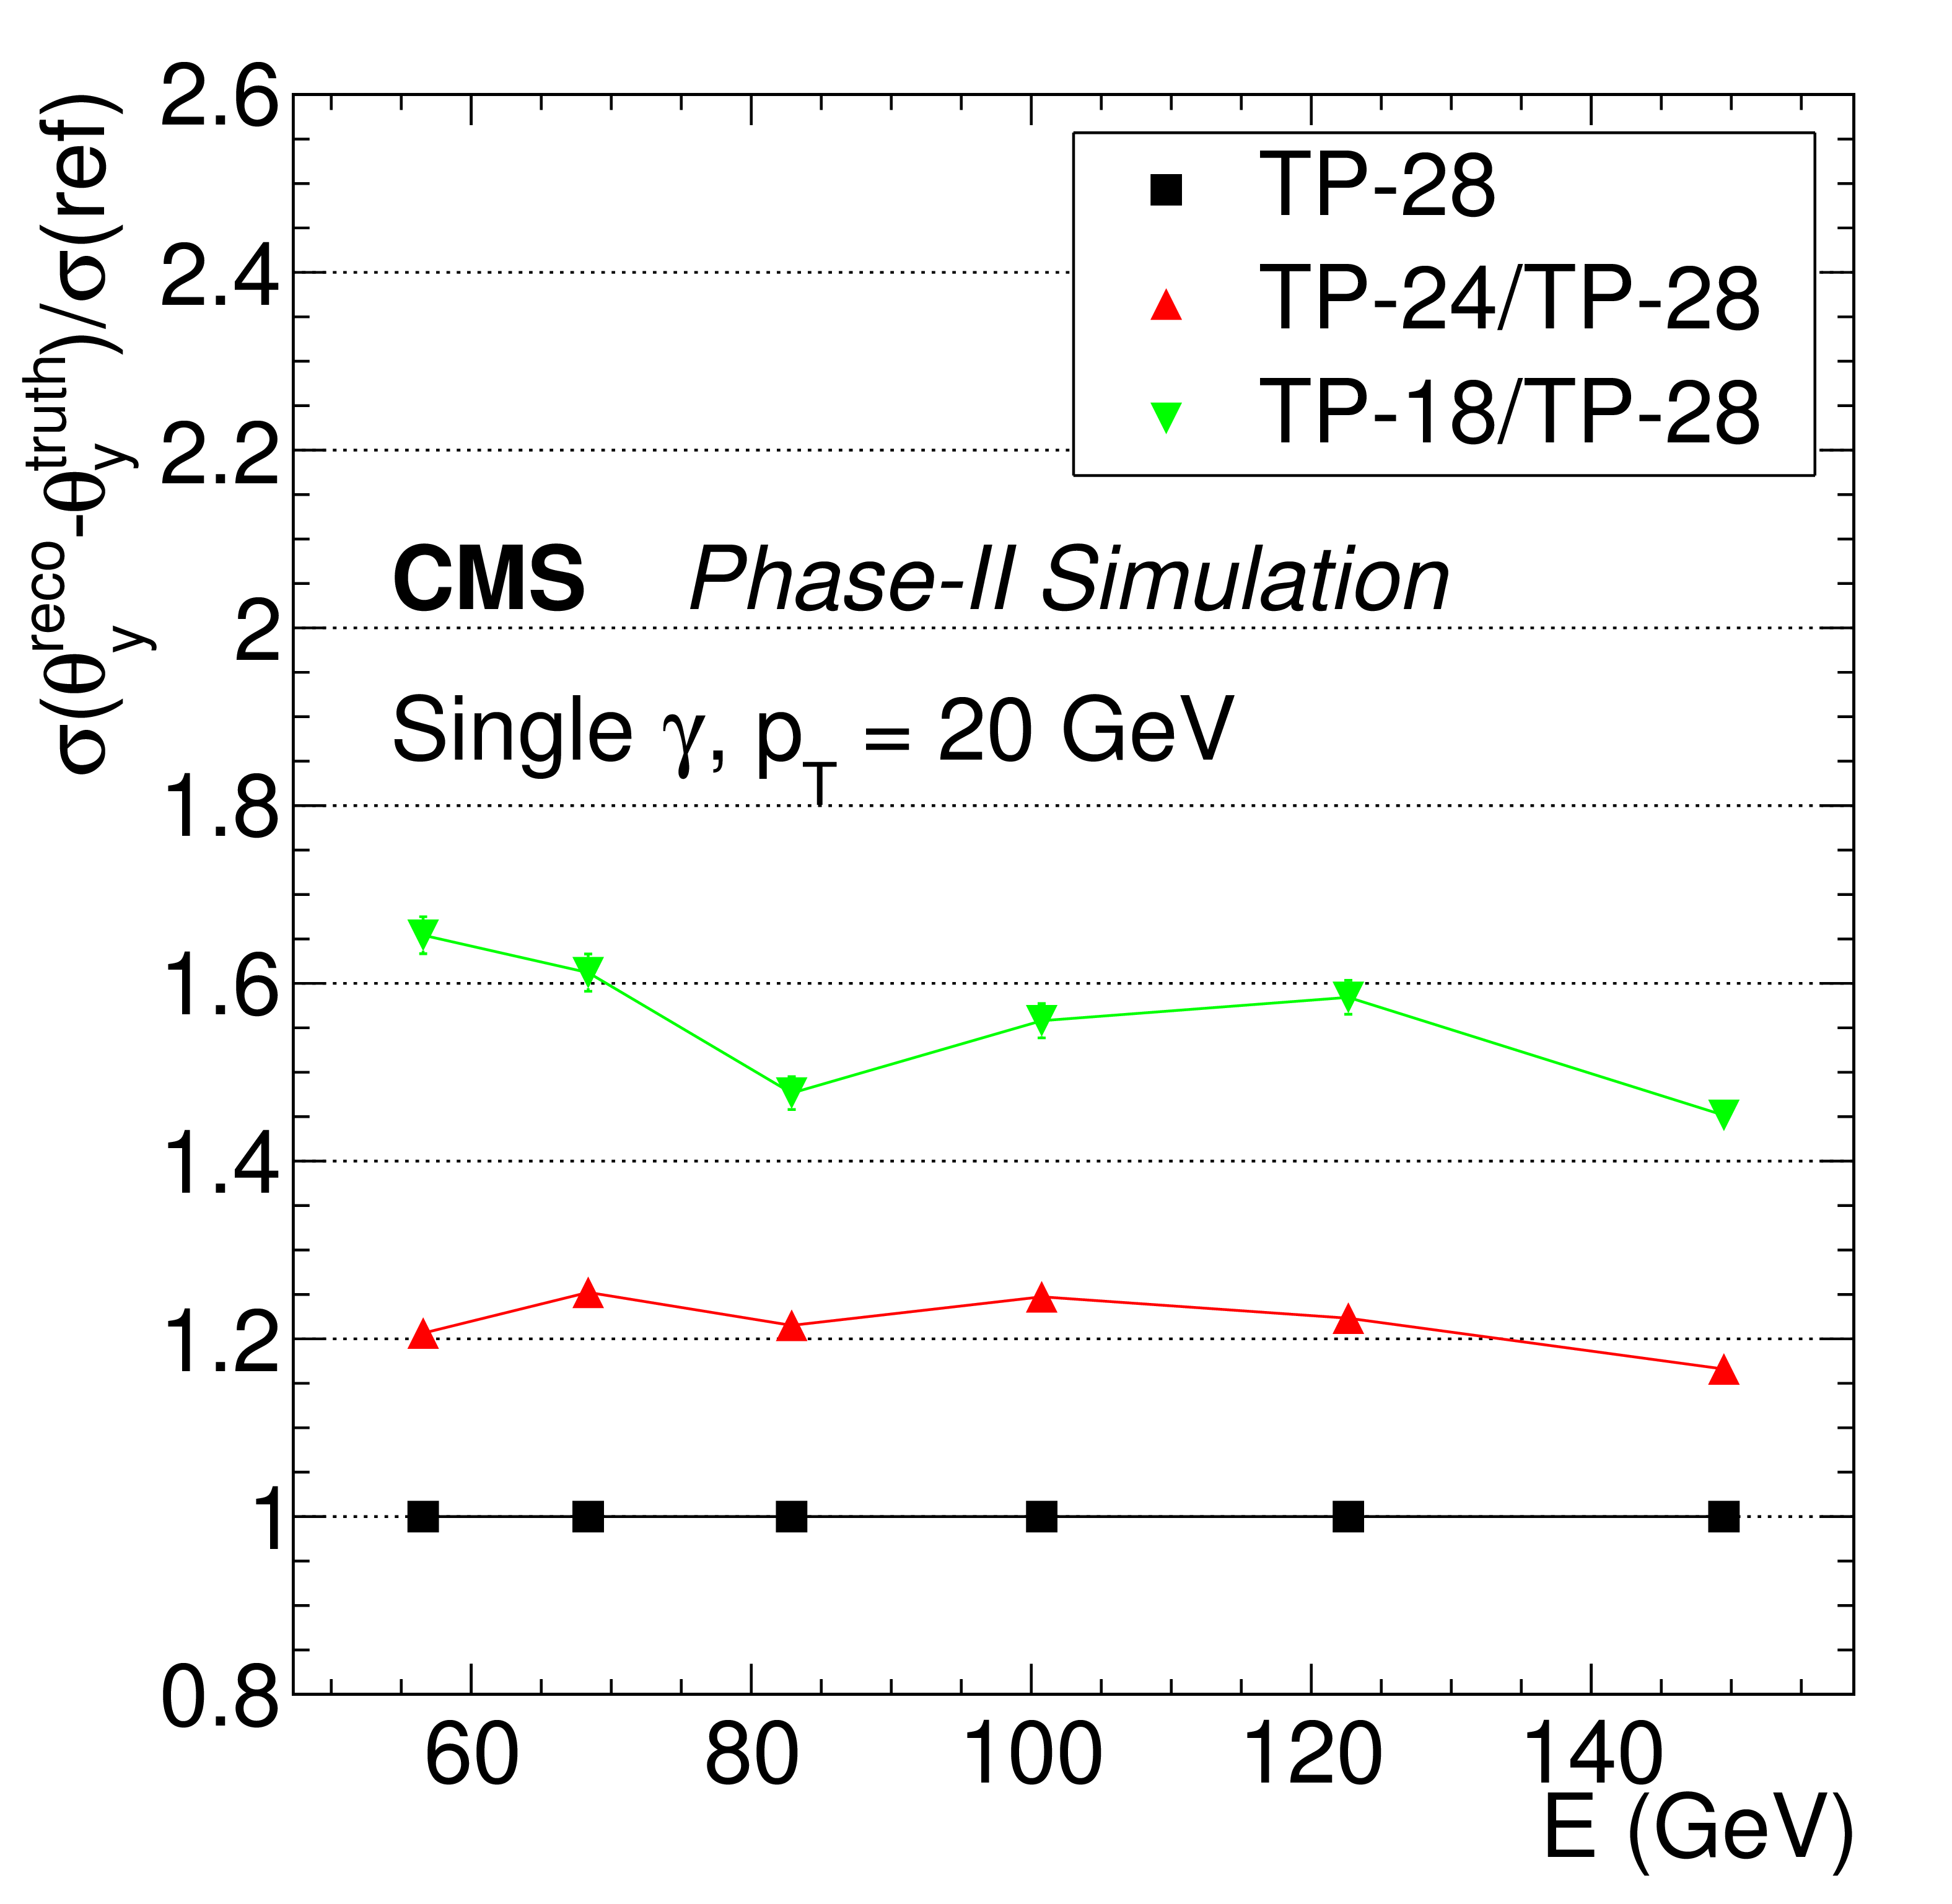
Figure 12-a:
Relative degradation in electromagnetic energy resolution as a function of the number of layers removed (left). Relative increase in pointing resolution as function of shower energy (right), as seen in standalone simulation which includes the effect of the reduced depth of the electromagnetic compartment in the descoped configurations. |
png ; pdf ; |
Figure 12-b:
Relative degradation in electromagnetic energy resolution as a function of the number of layers removed (left). Relative increase in pointing resolution as function of shower energy (right), as seen in standalone simulation which includes the effect of the reduced depth of the electromagnetic compartment in the descoped configurations. |
png ; pdf ; |
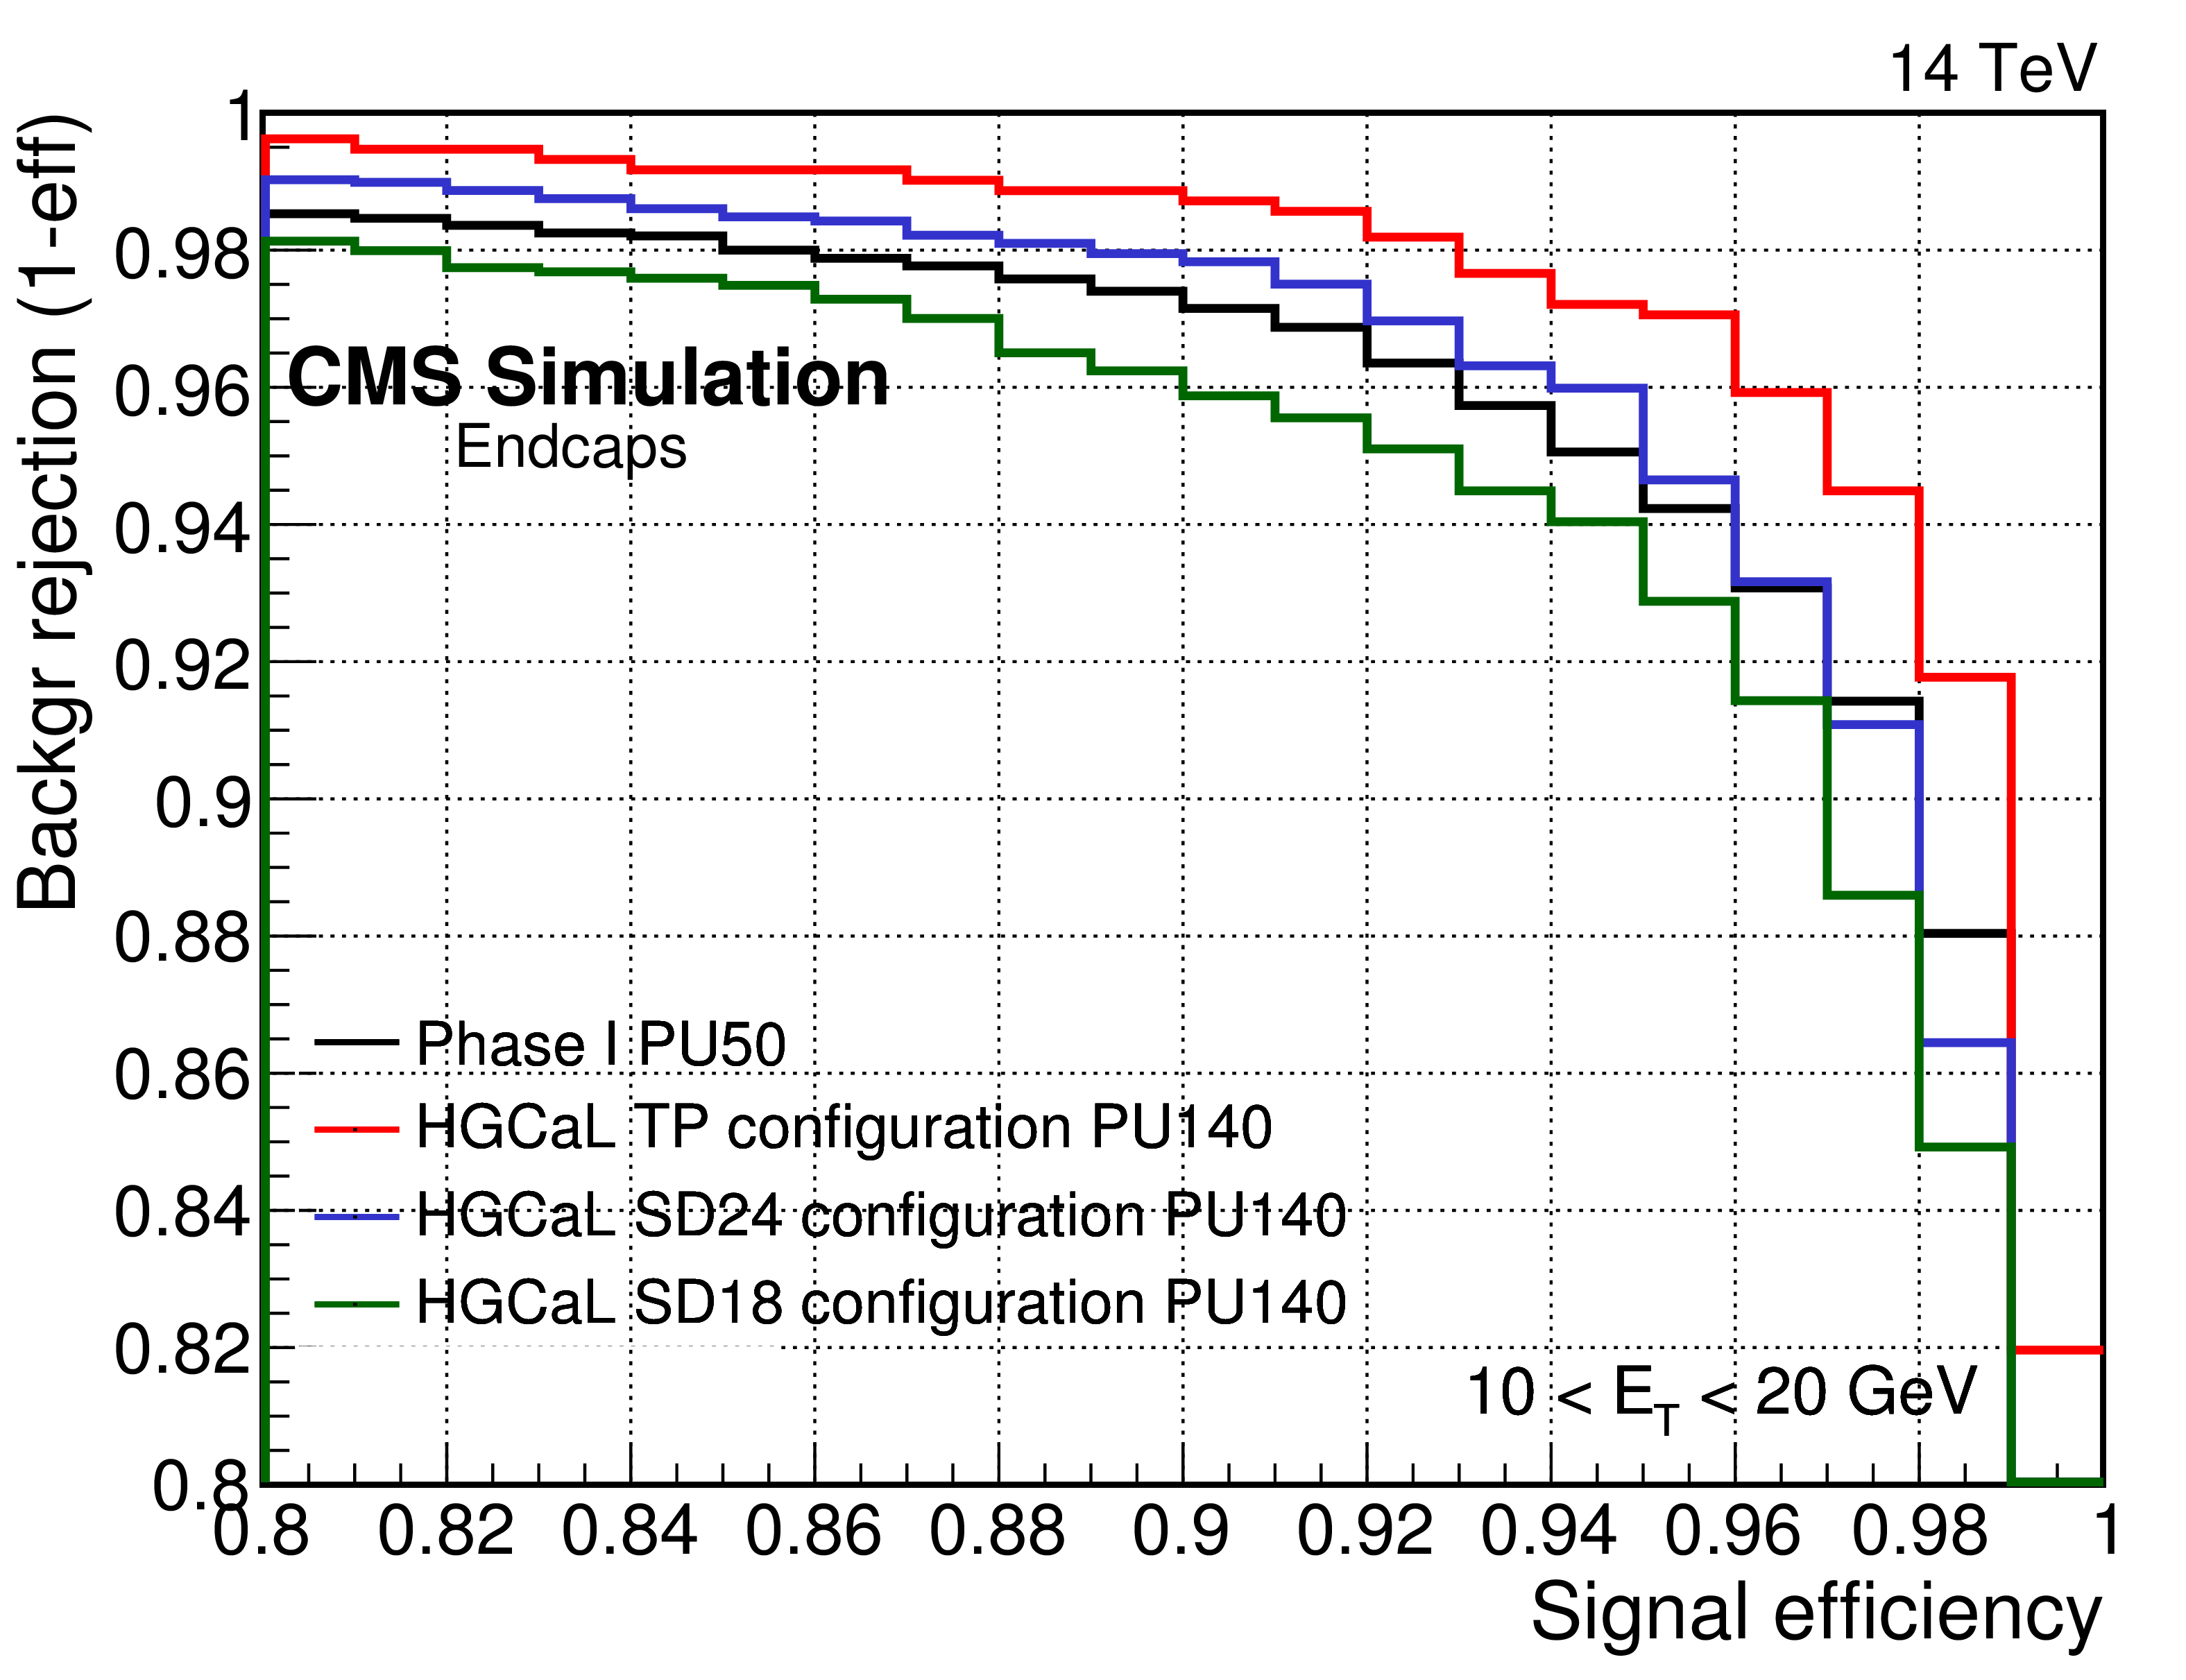
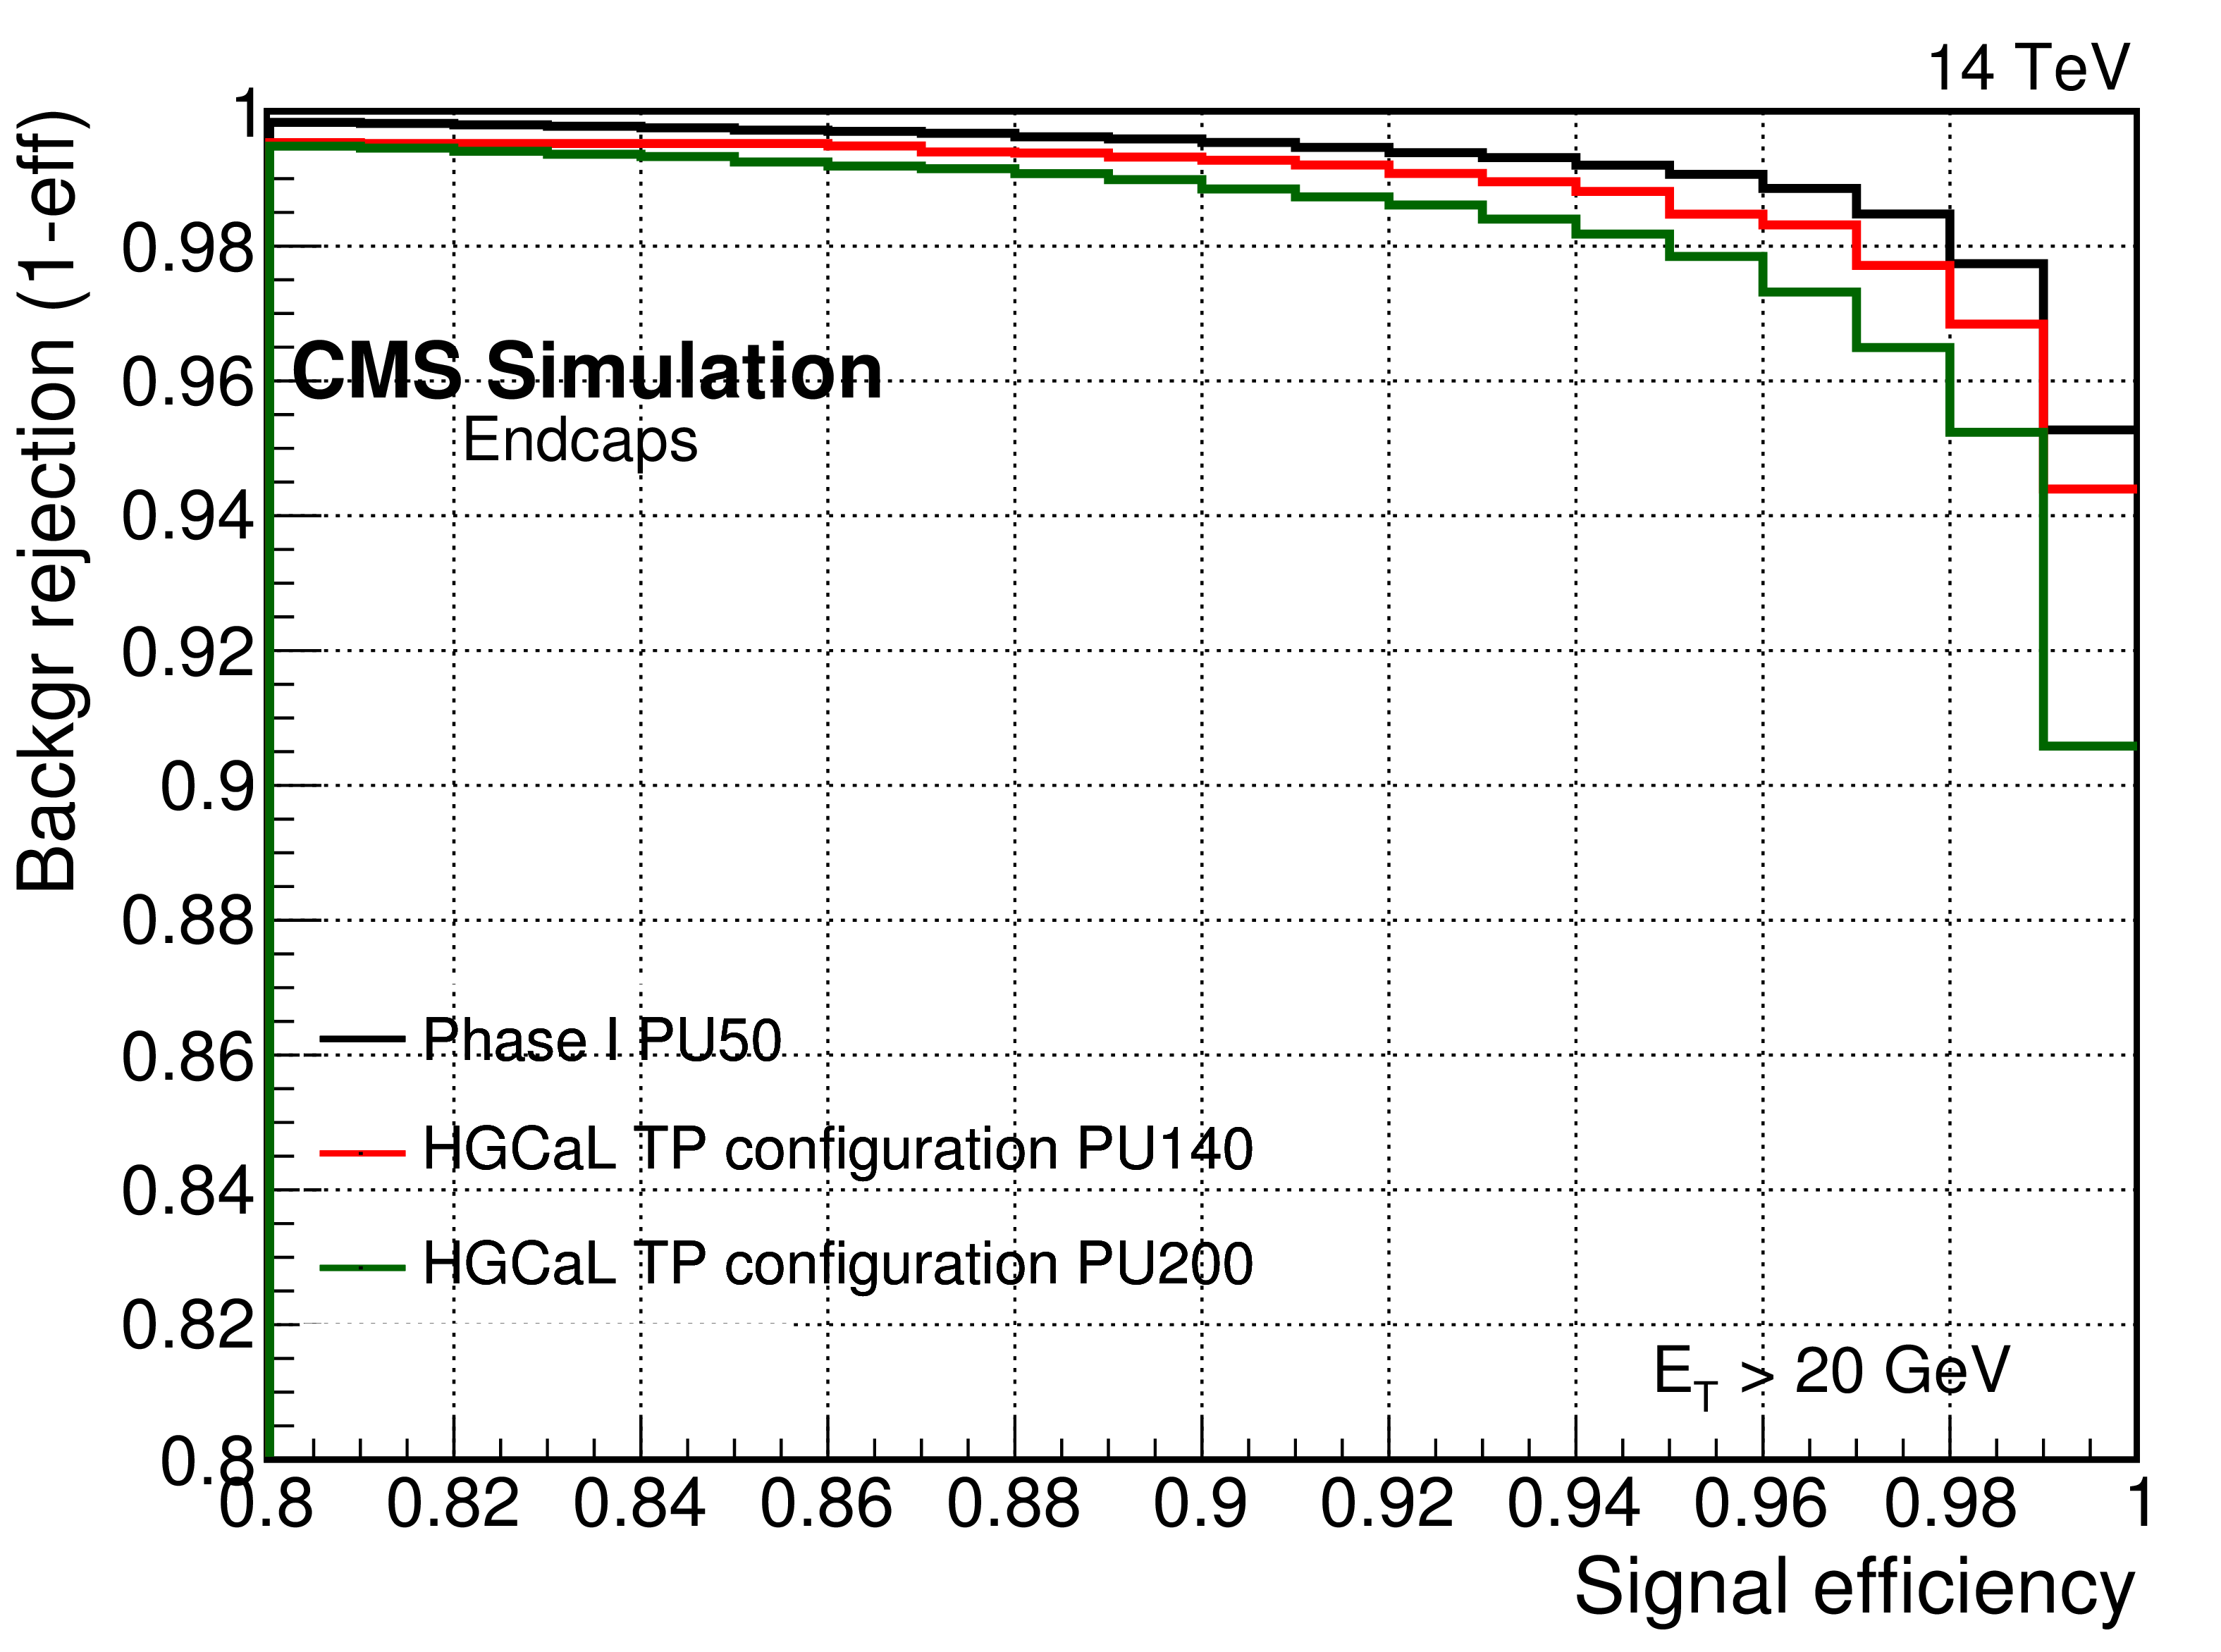
Figure 13-a:
Operating characteristic for electron identification in the endcap calorimeter, in Drell-Yan events, for $<$PU$>=140$ for electrons with transverse momentum between 10 and 20 GeV (left) and larger than 20 GeV (right). |
png ; pdf ; |
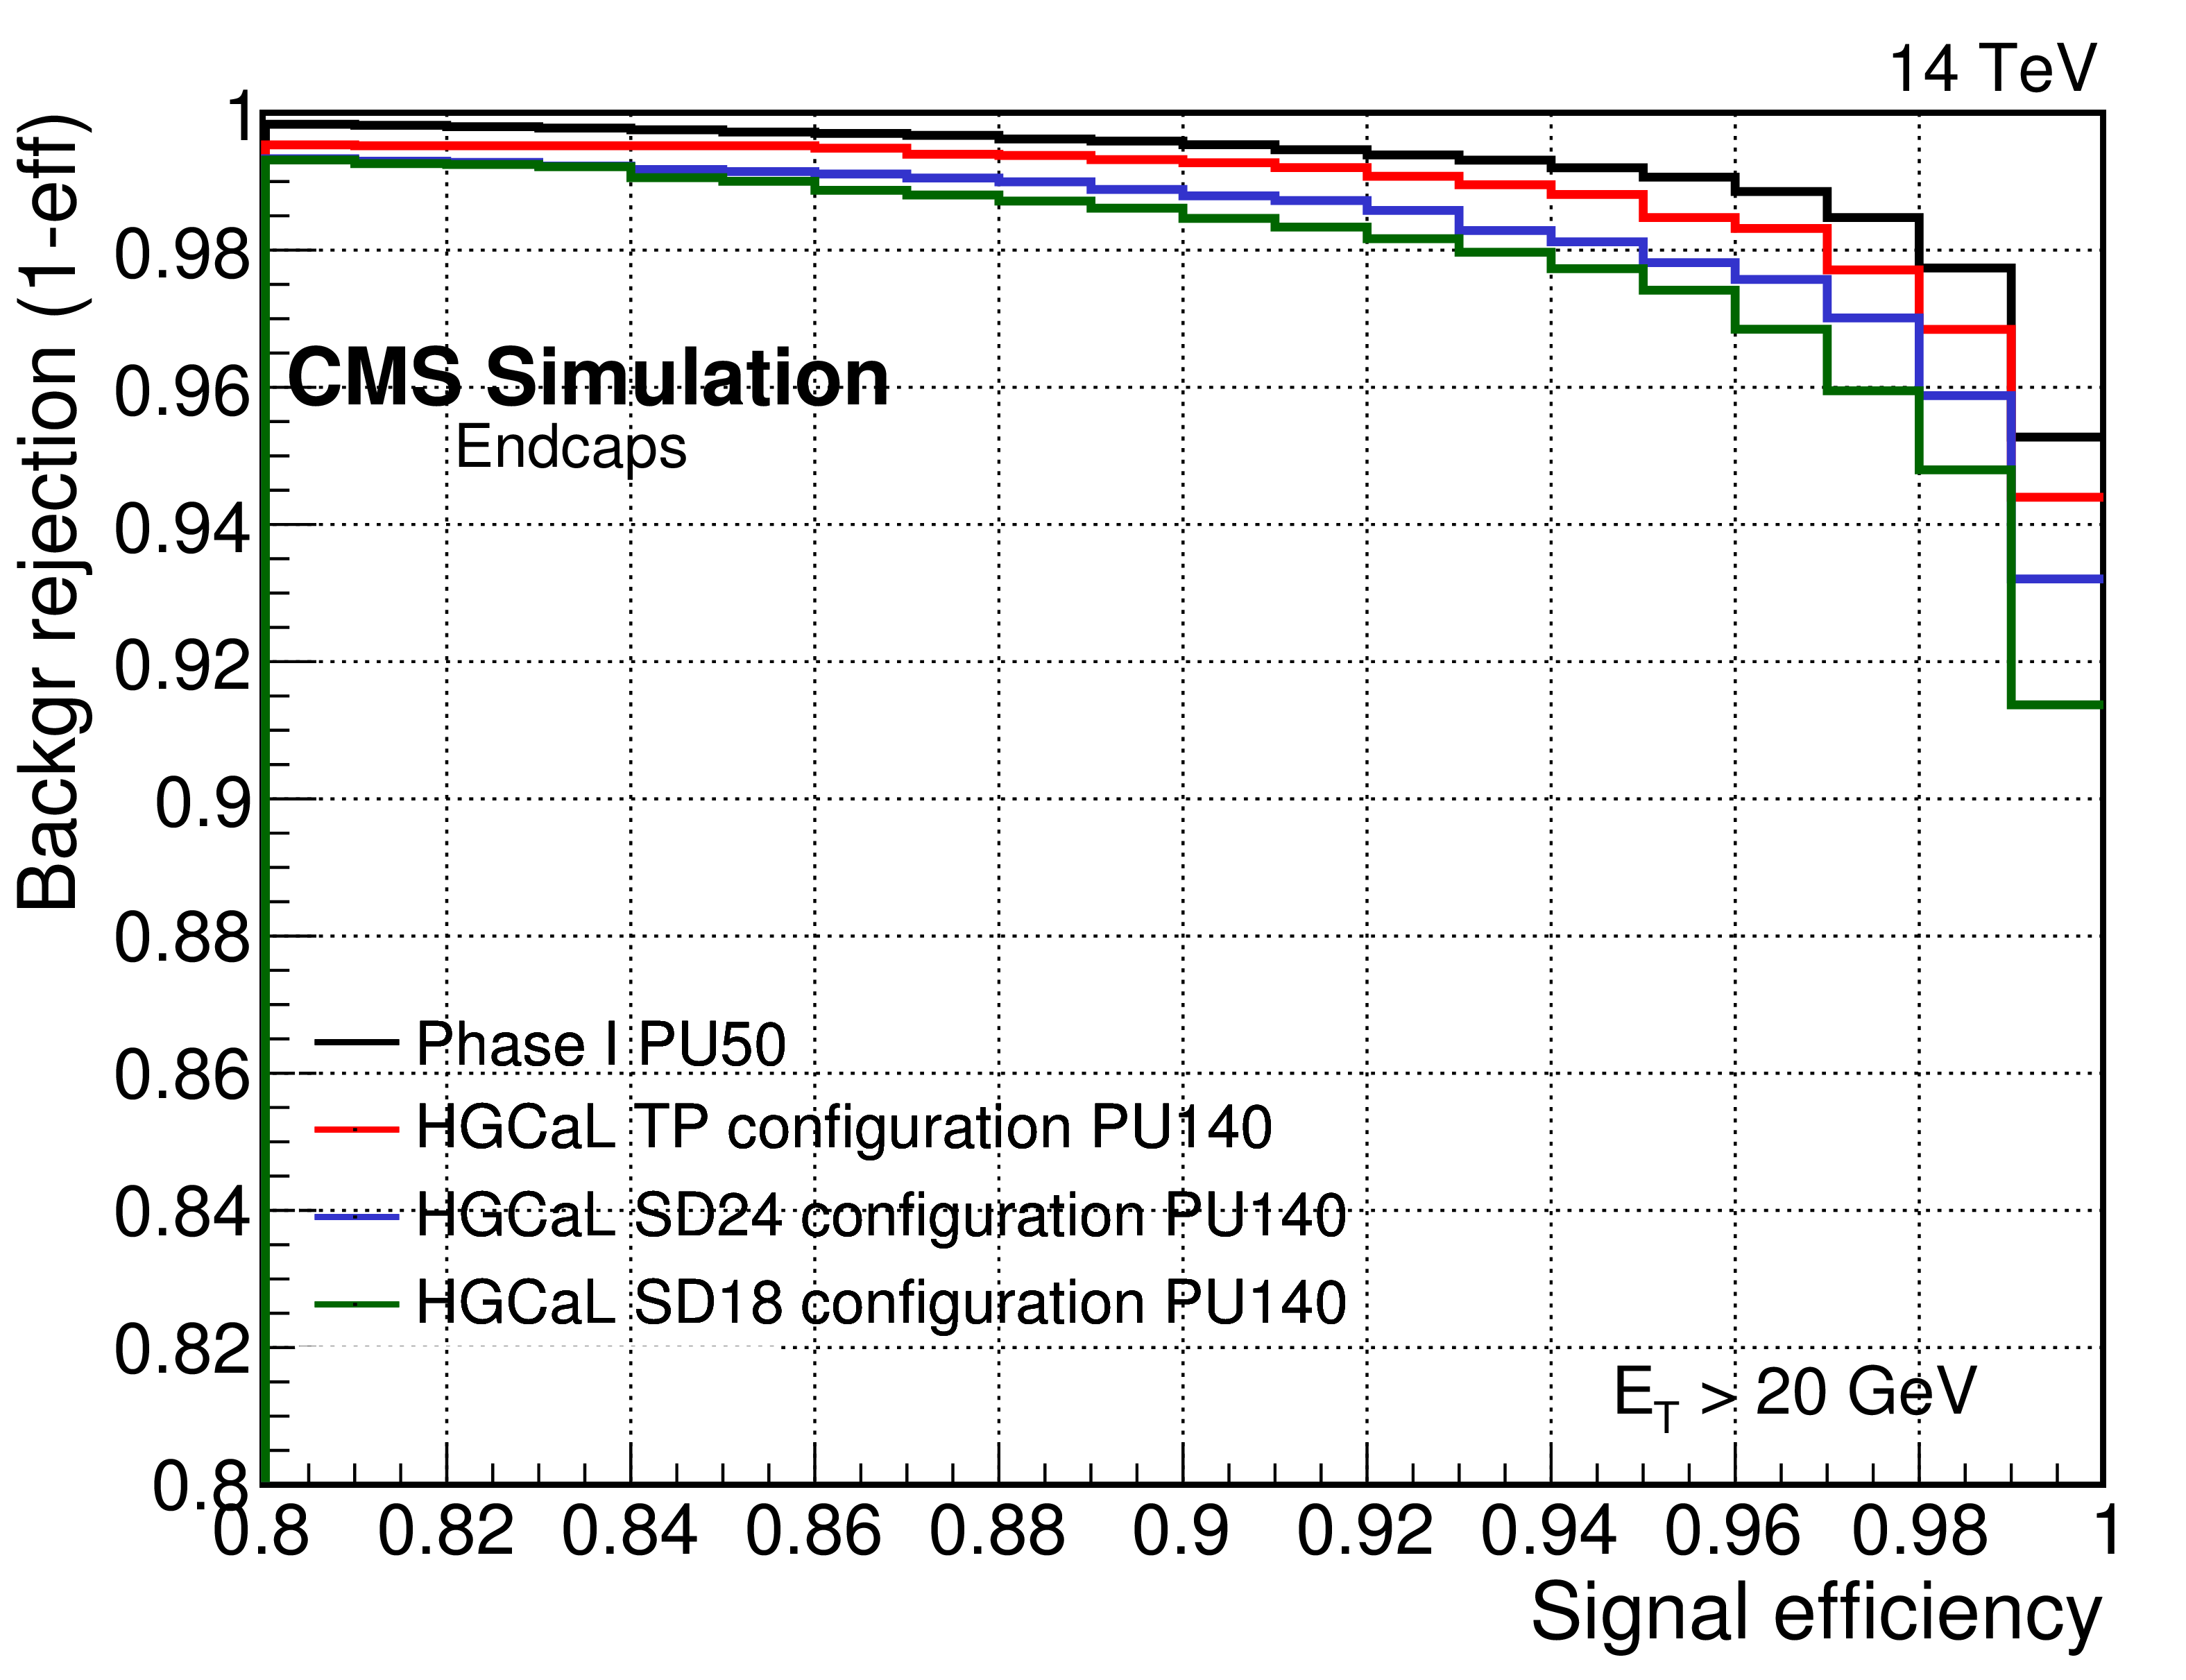
Figure 13-b:
Operating characteristic for electron identification in the endcap calorimeter, in Drell-Yan events, for $<$PU$>=140$ for electrons with transverse momentum between 10 and 20 GeV (left) and larger than 20 GeV (right). |
png ; pdf ; |
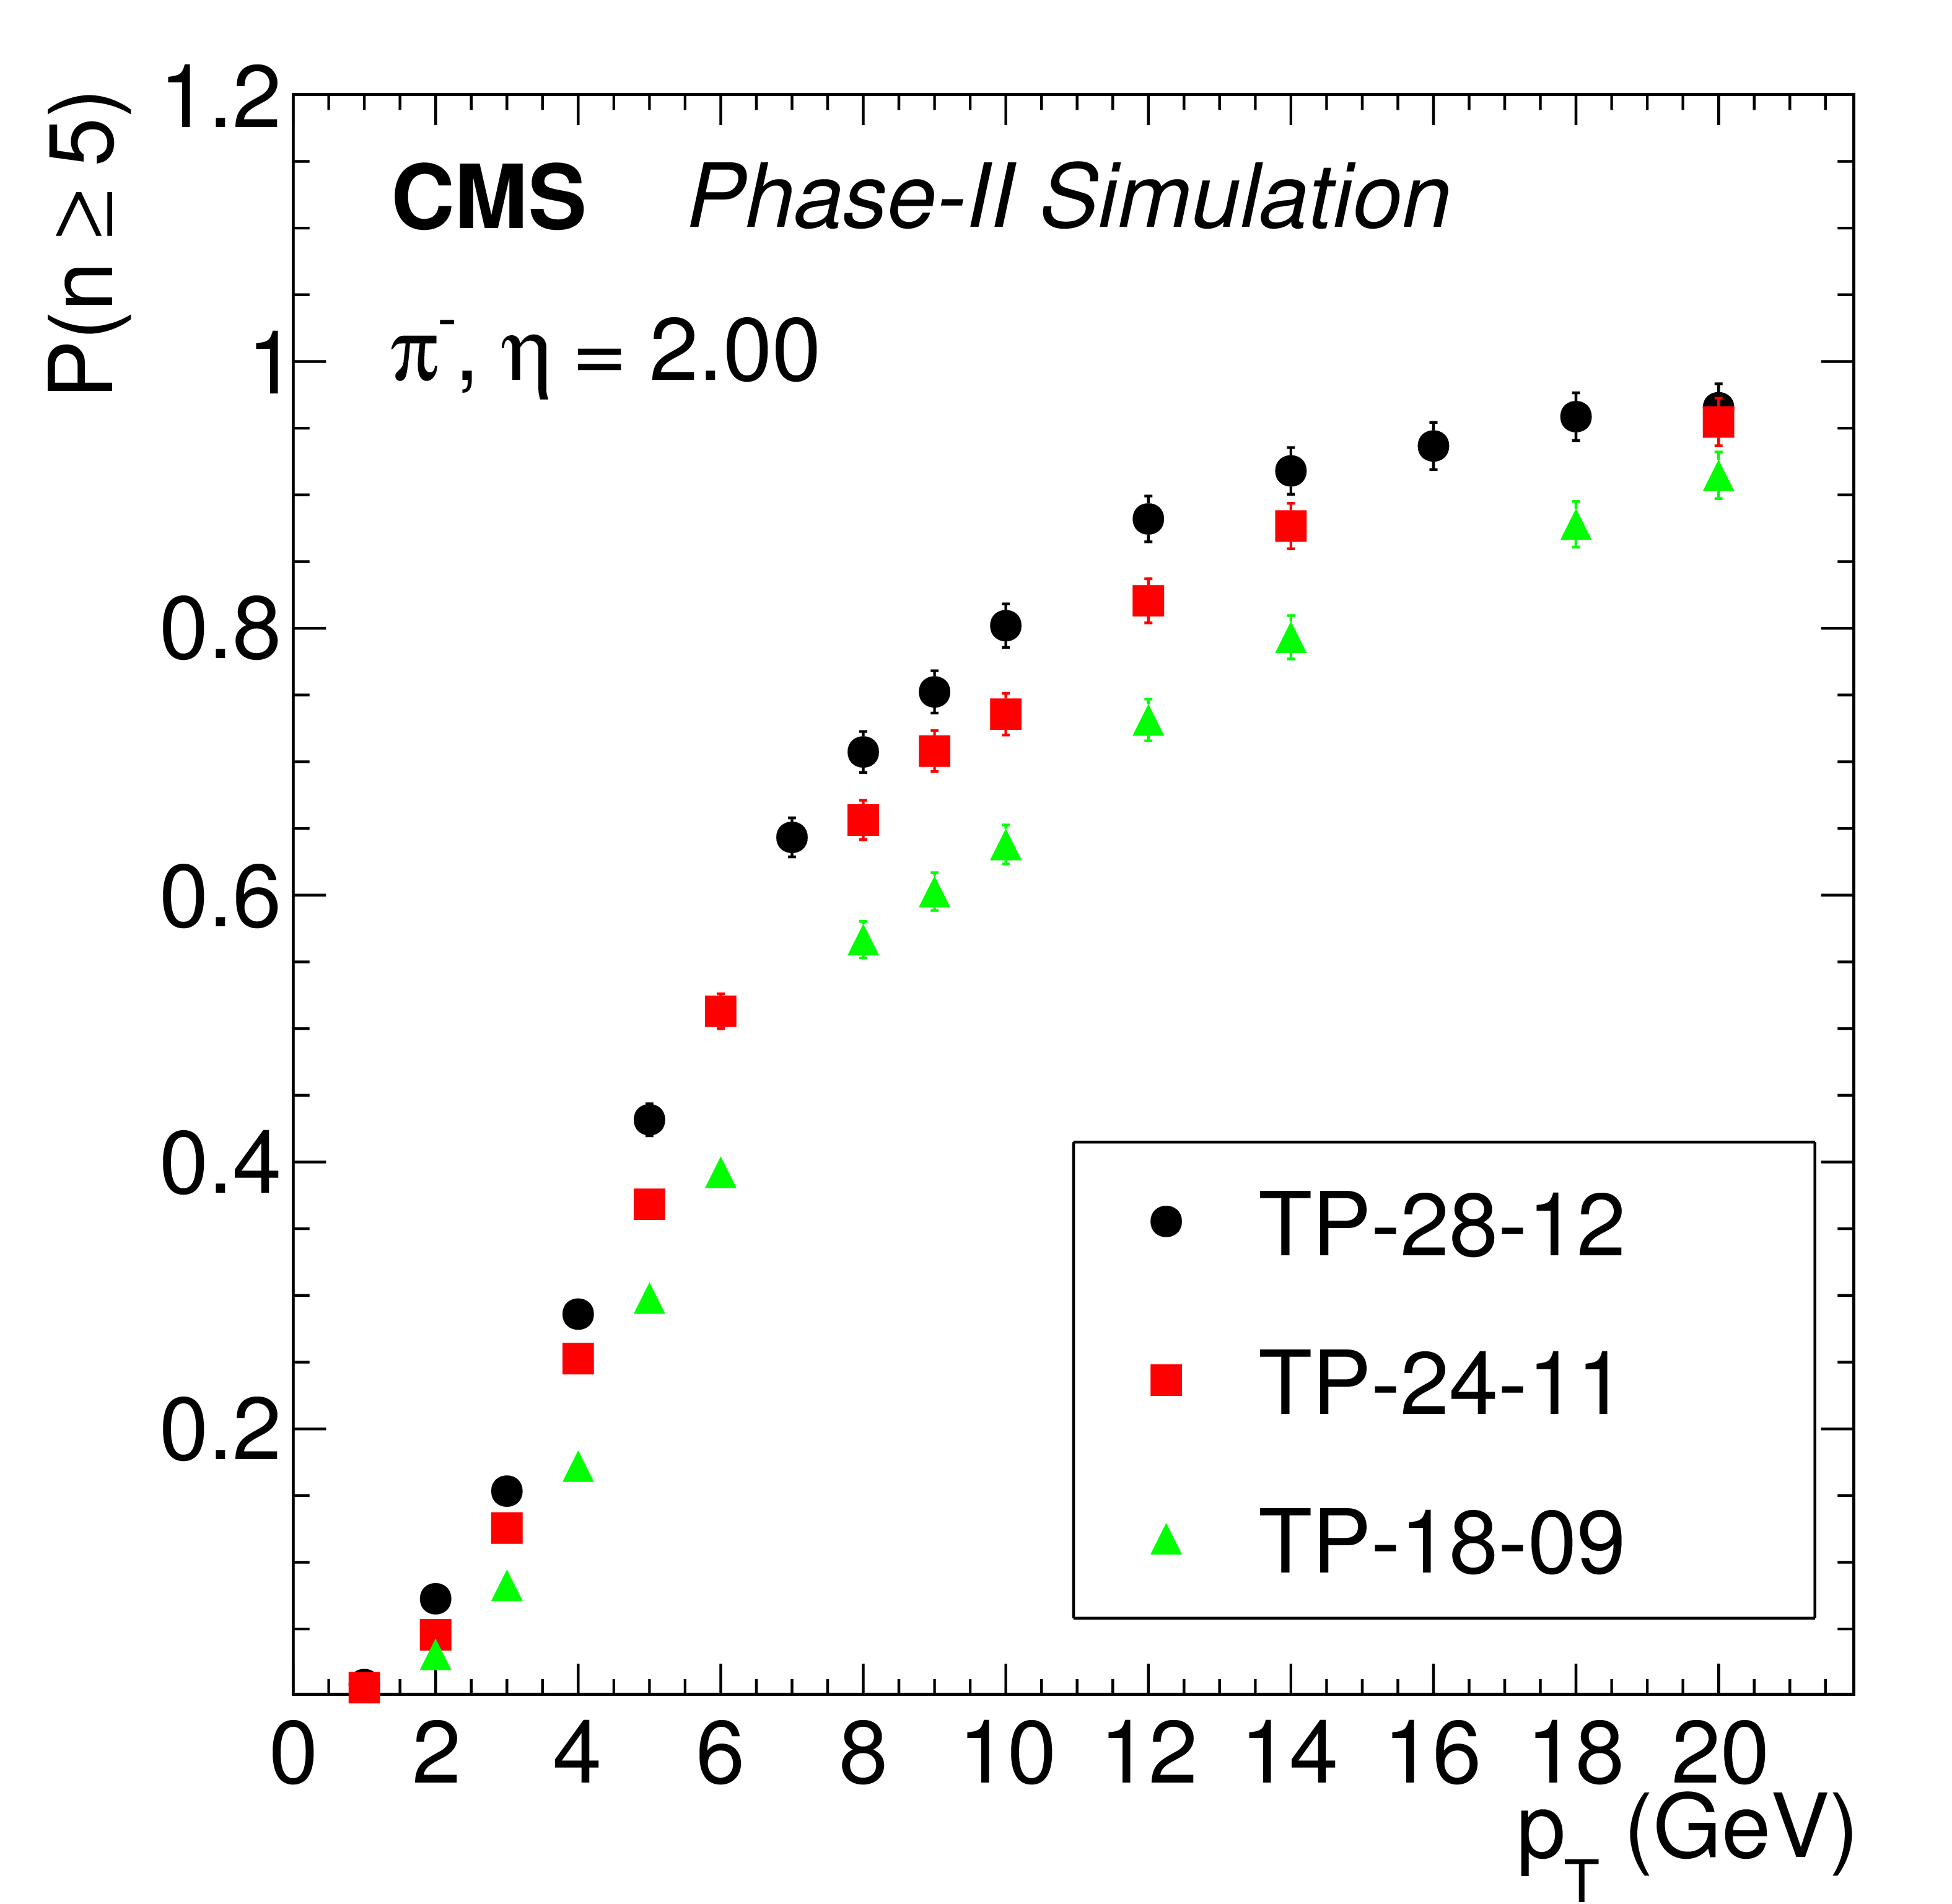
Figure 14:
Probability of the presence of five or more cells above the timing threshold (60 fC) in showers of charged pions, as a function of $ {p_{\mathrm {T}}} $. |
png ; pdf ; |
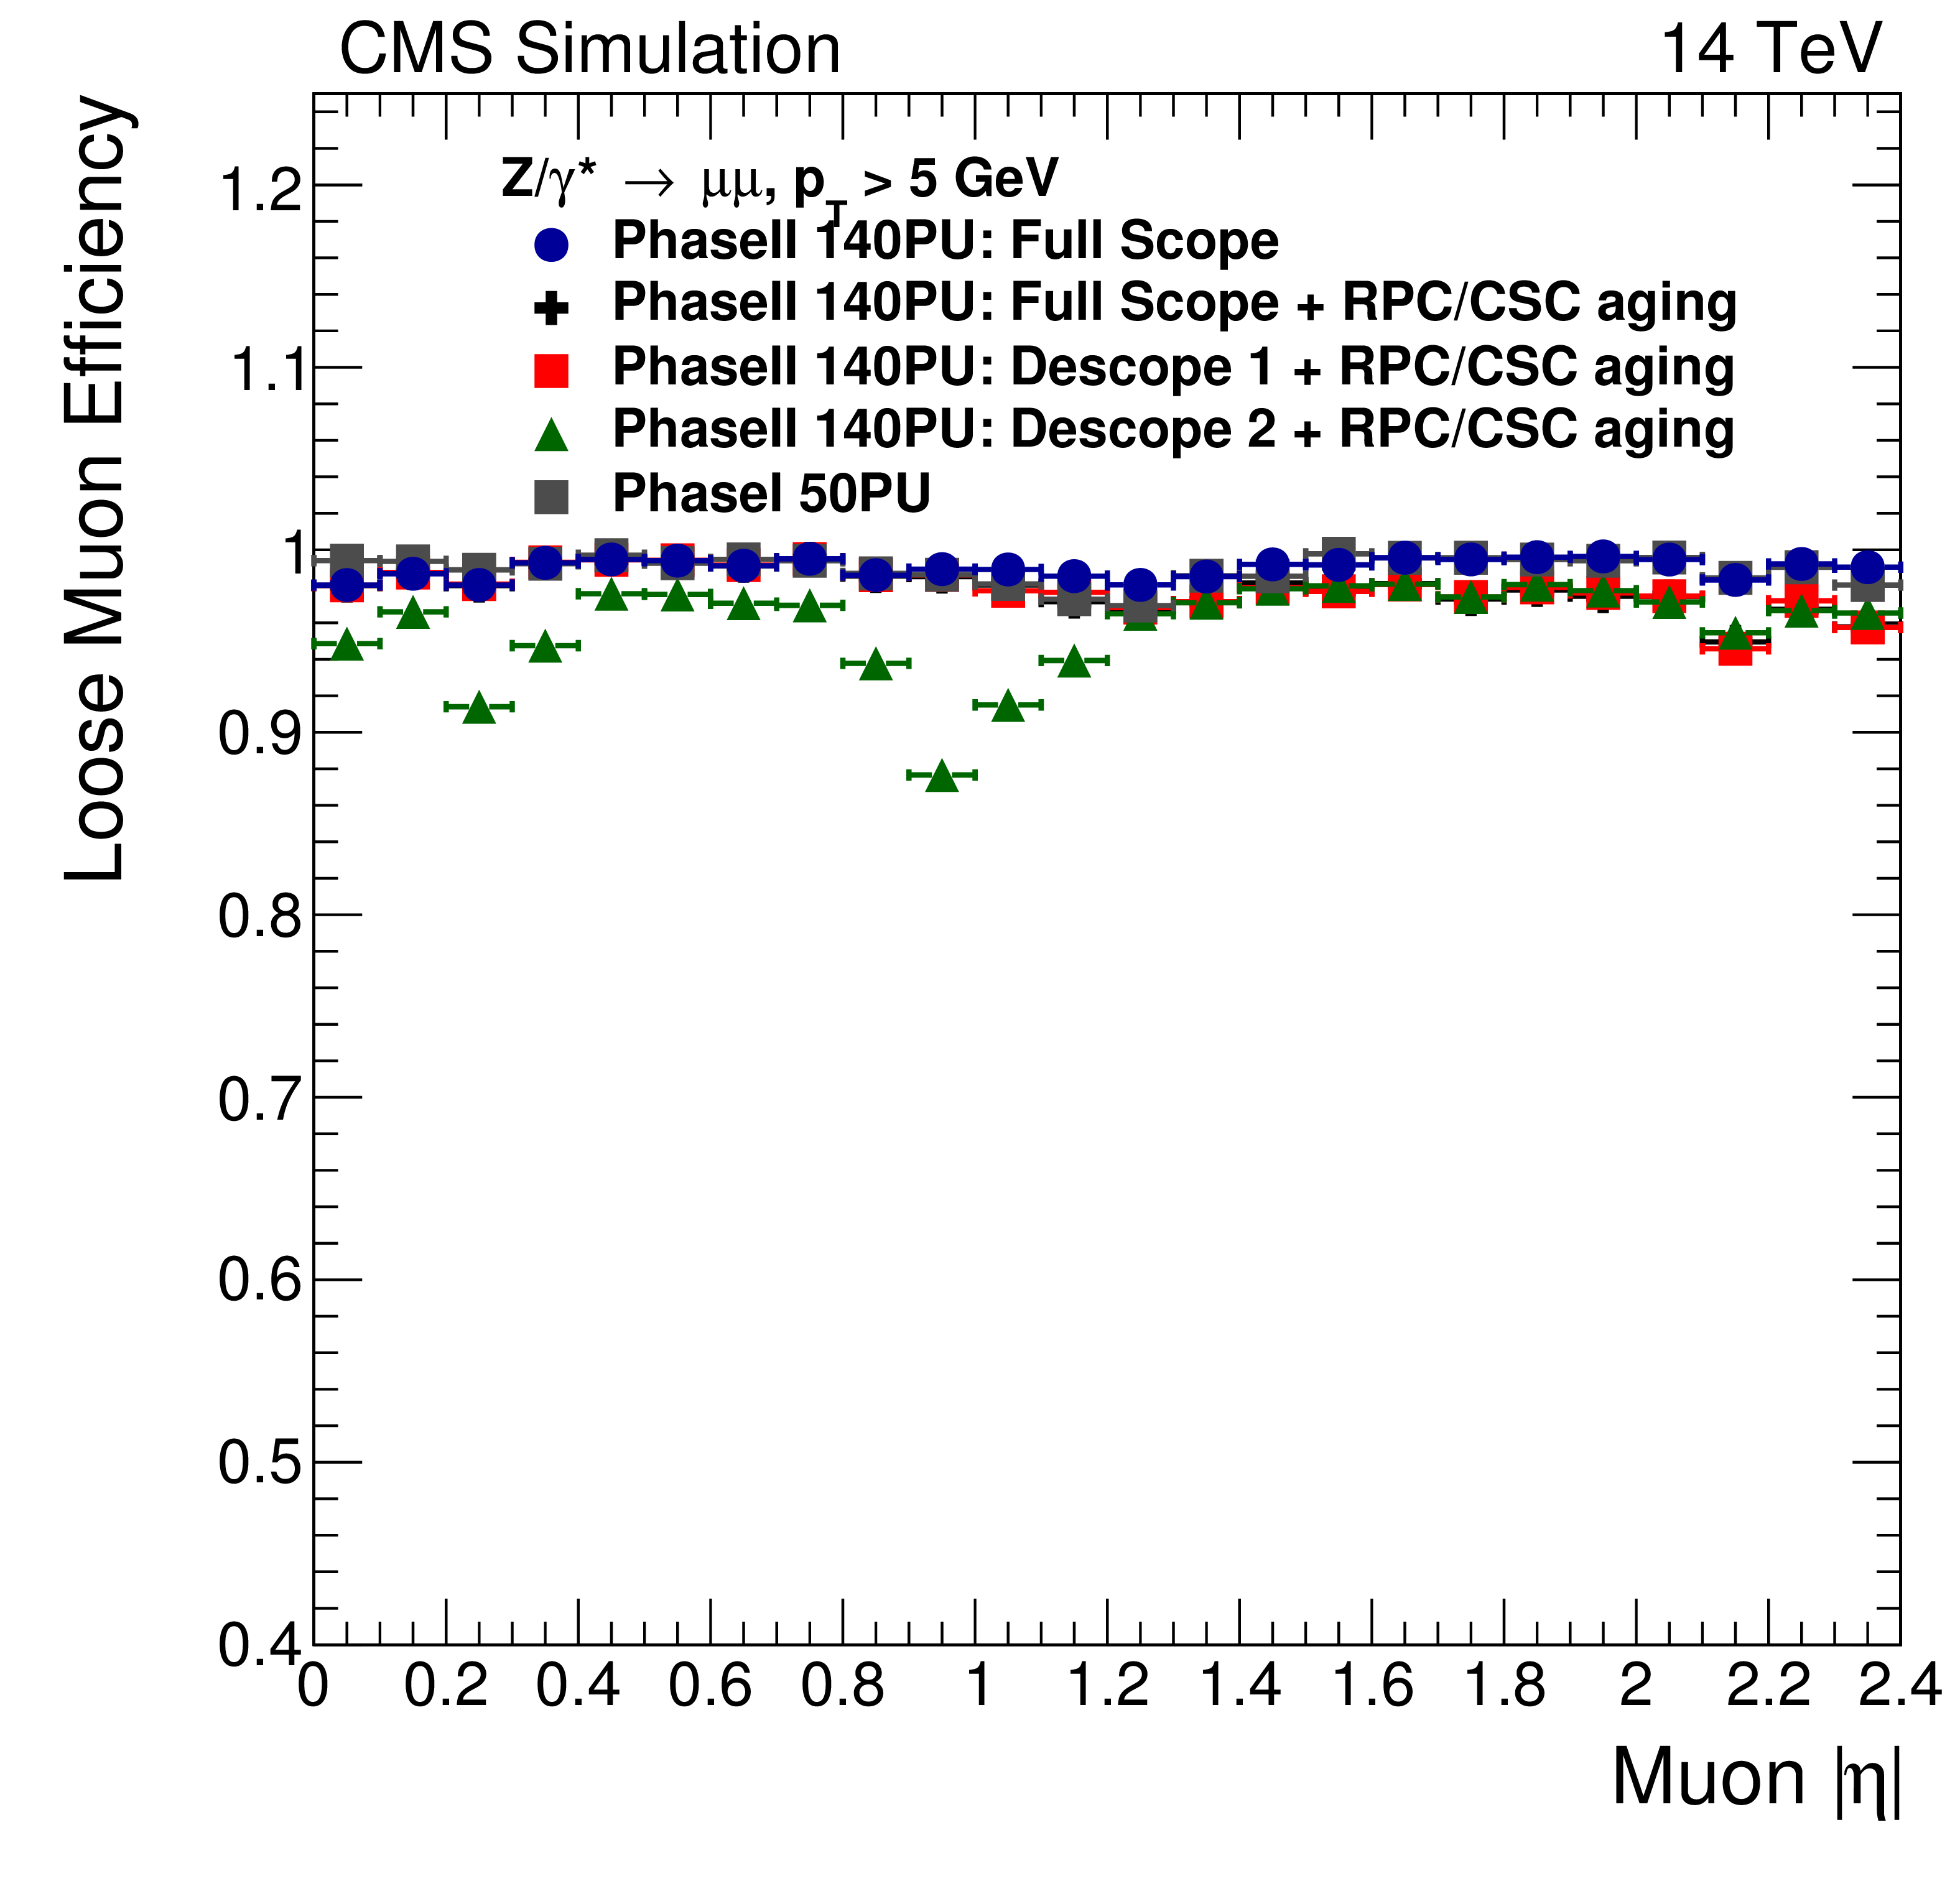
Figure 15-a:
Loose Muon identification efficiency (left) and Tight Muon Identification efficiency (right) in Drell-Yan events as a function of the $|\eta |$ of the simulated muon for different detector scenarios |

png ; pdf ; |
Figure 15-b:
Loose Muon identification efficiency (left) and Tight Muon Identification efficiency (right) in Drell-Yan events as a function of the $|\eta |$ of the simulated muon for different detector scenarios |
png ; pdf ; |
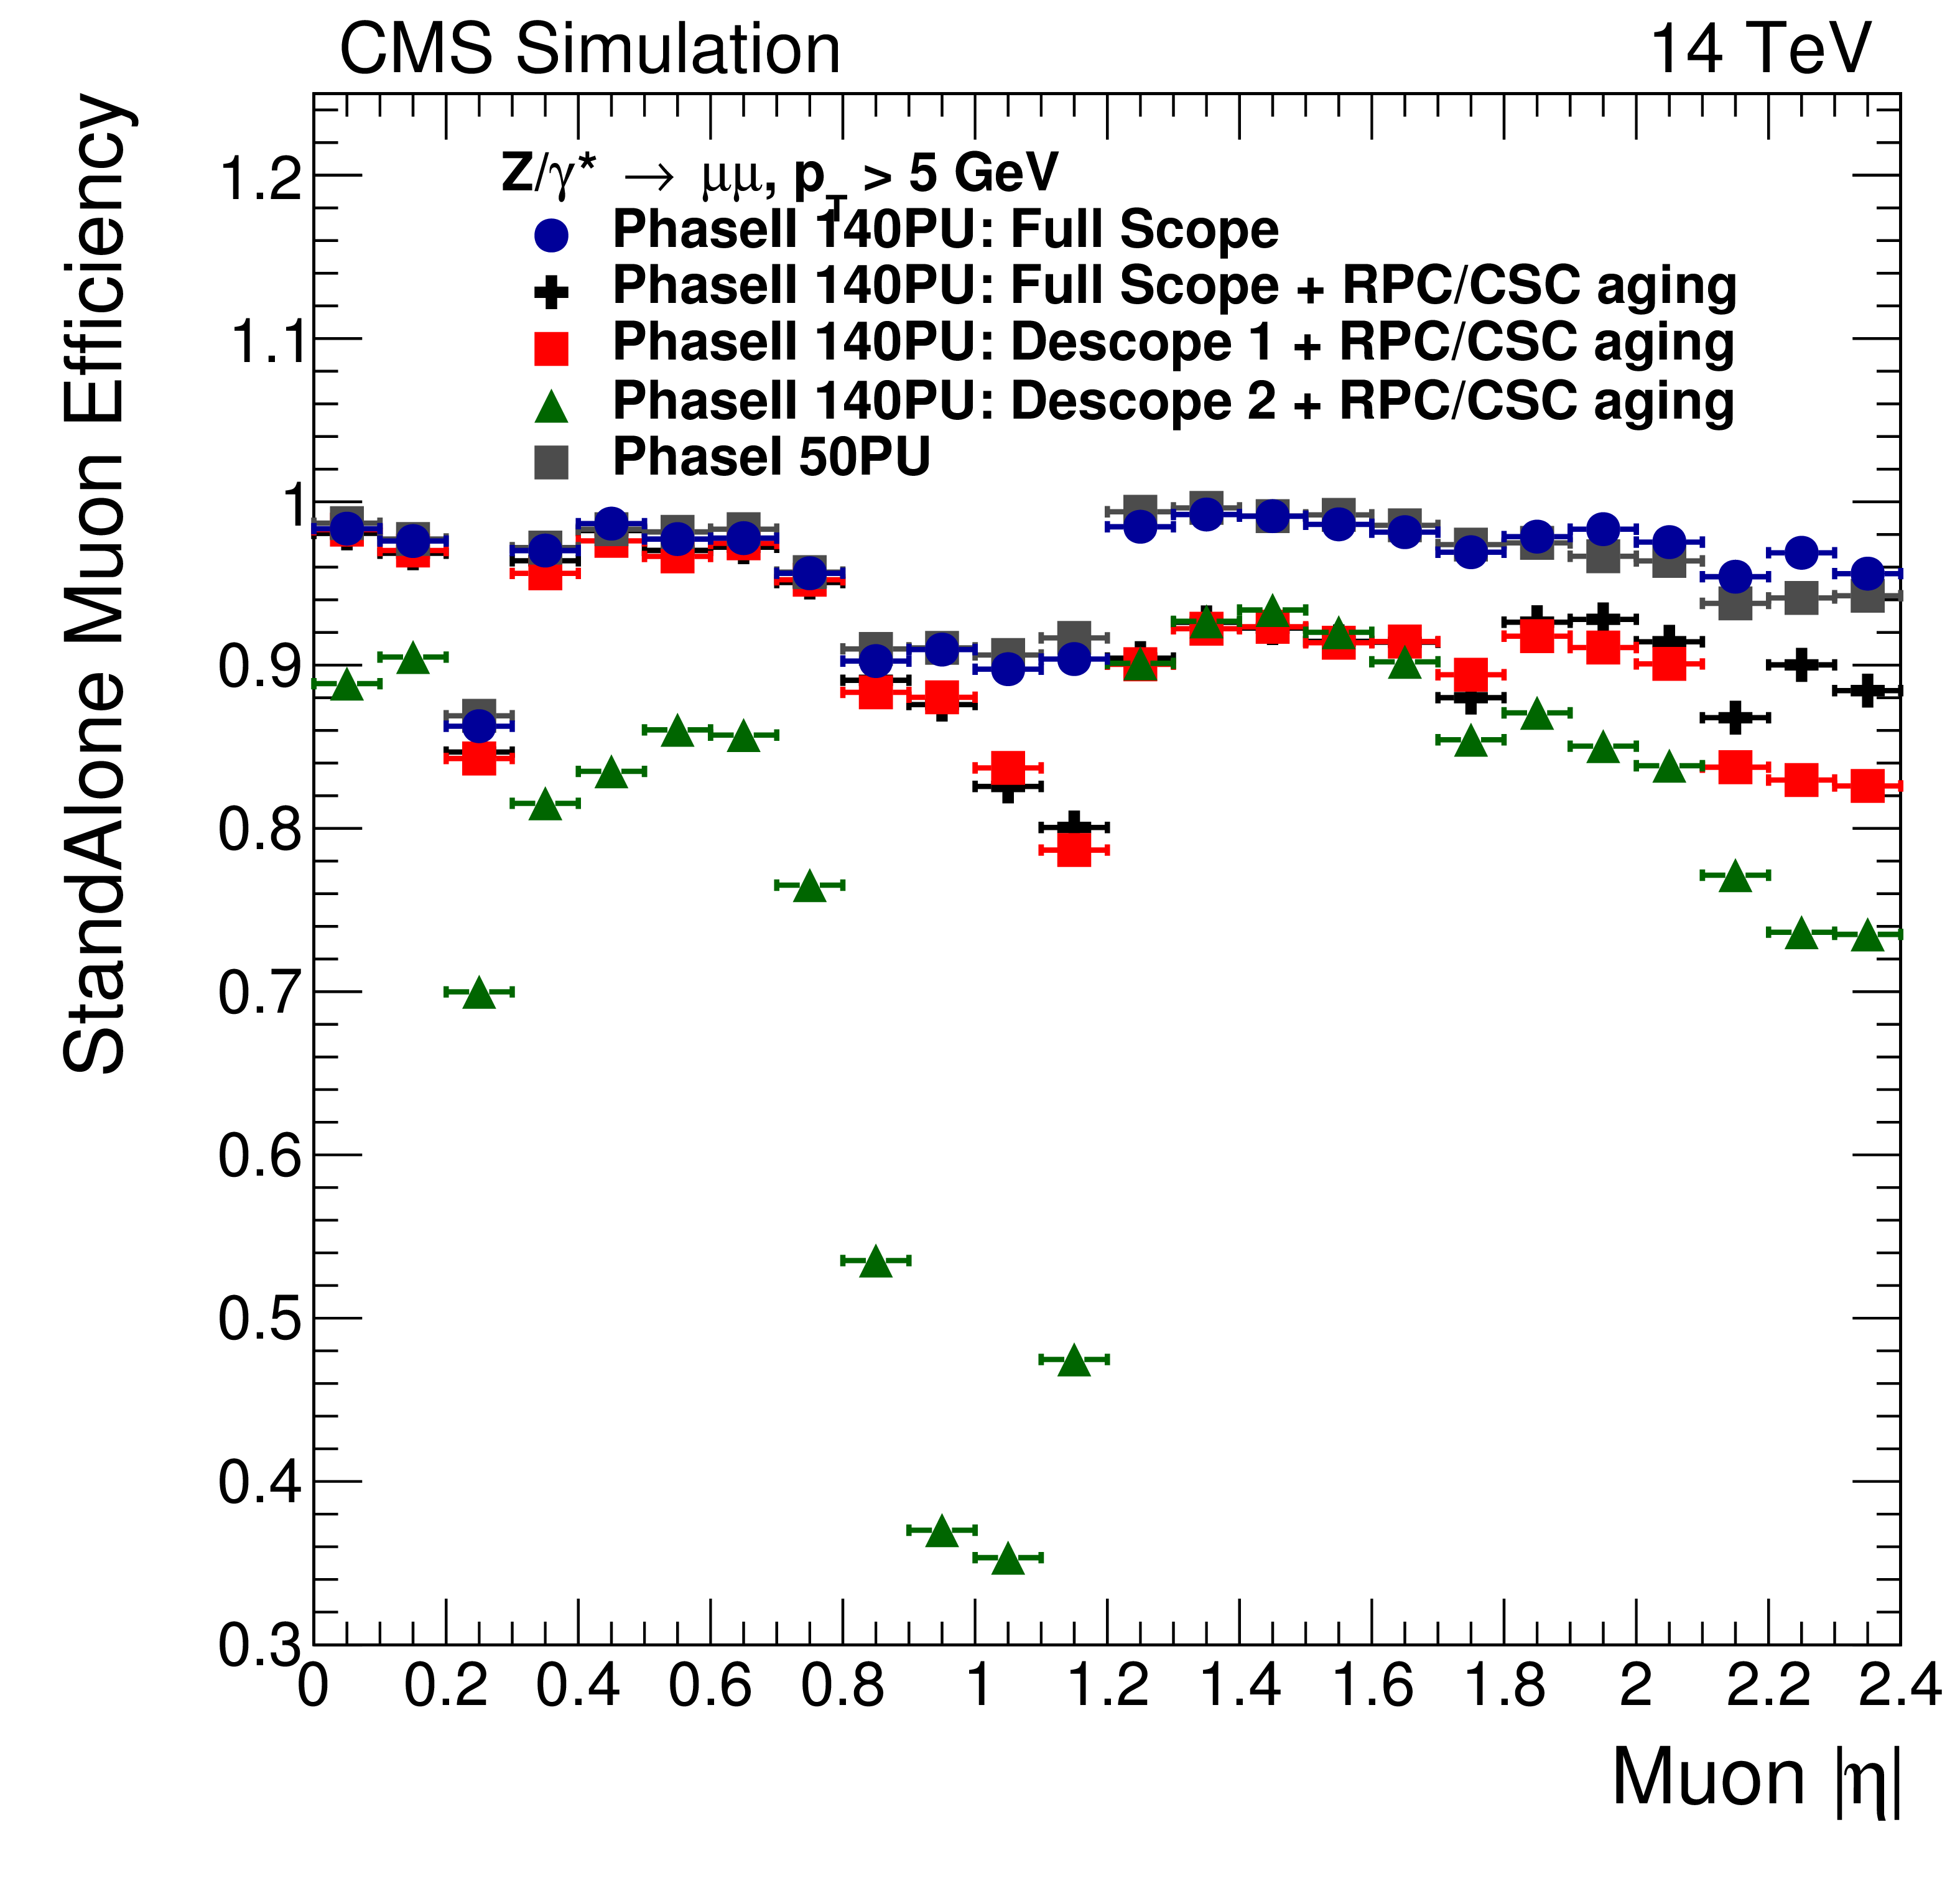
Figure 16:
Standalone muon reconstruction efficiency as function of pseudorapidity. Requirements on the number of hits used to reconstruct the muon track are applied to ensure a good measurement of the muon momentum. |
png ; pdf ; |
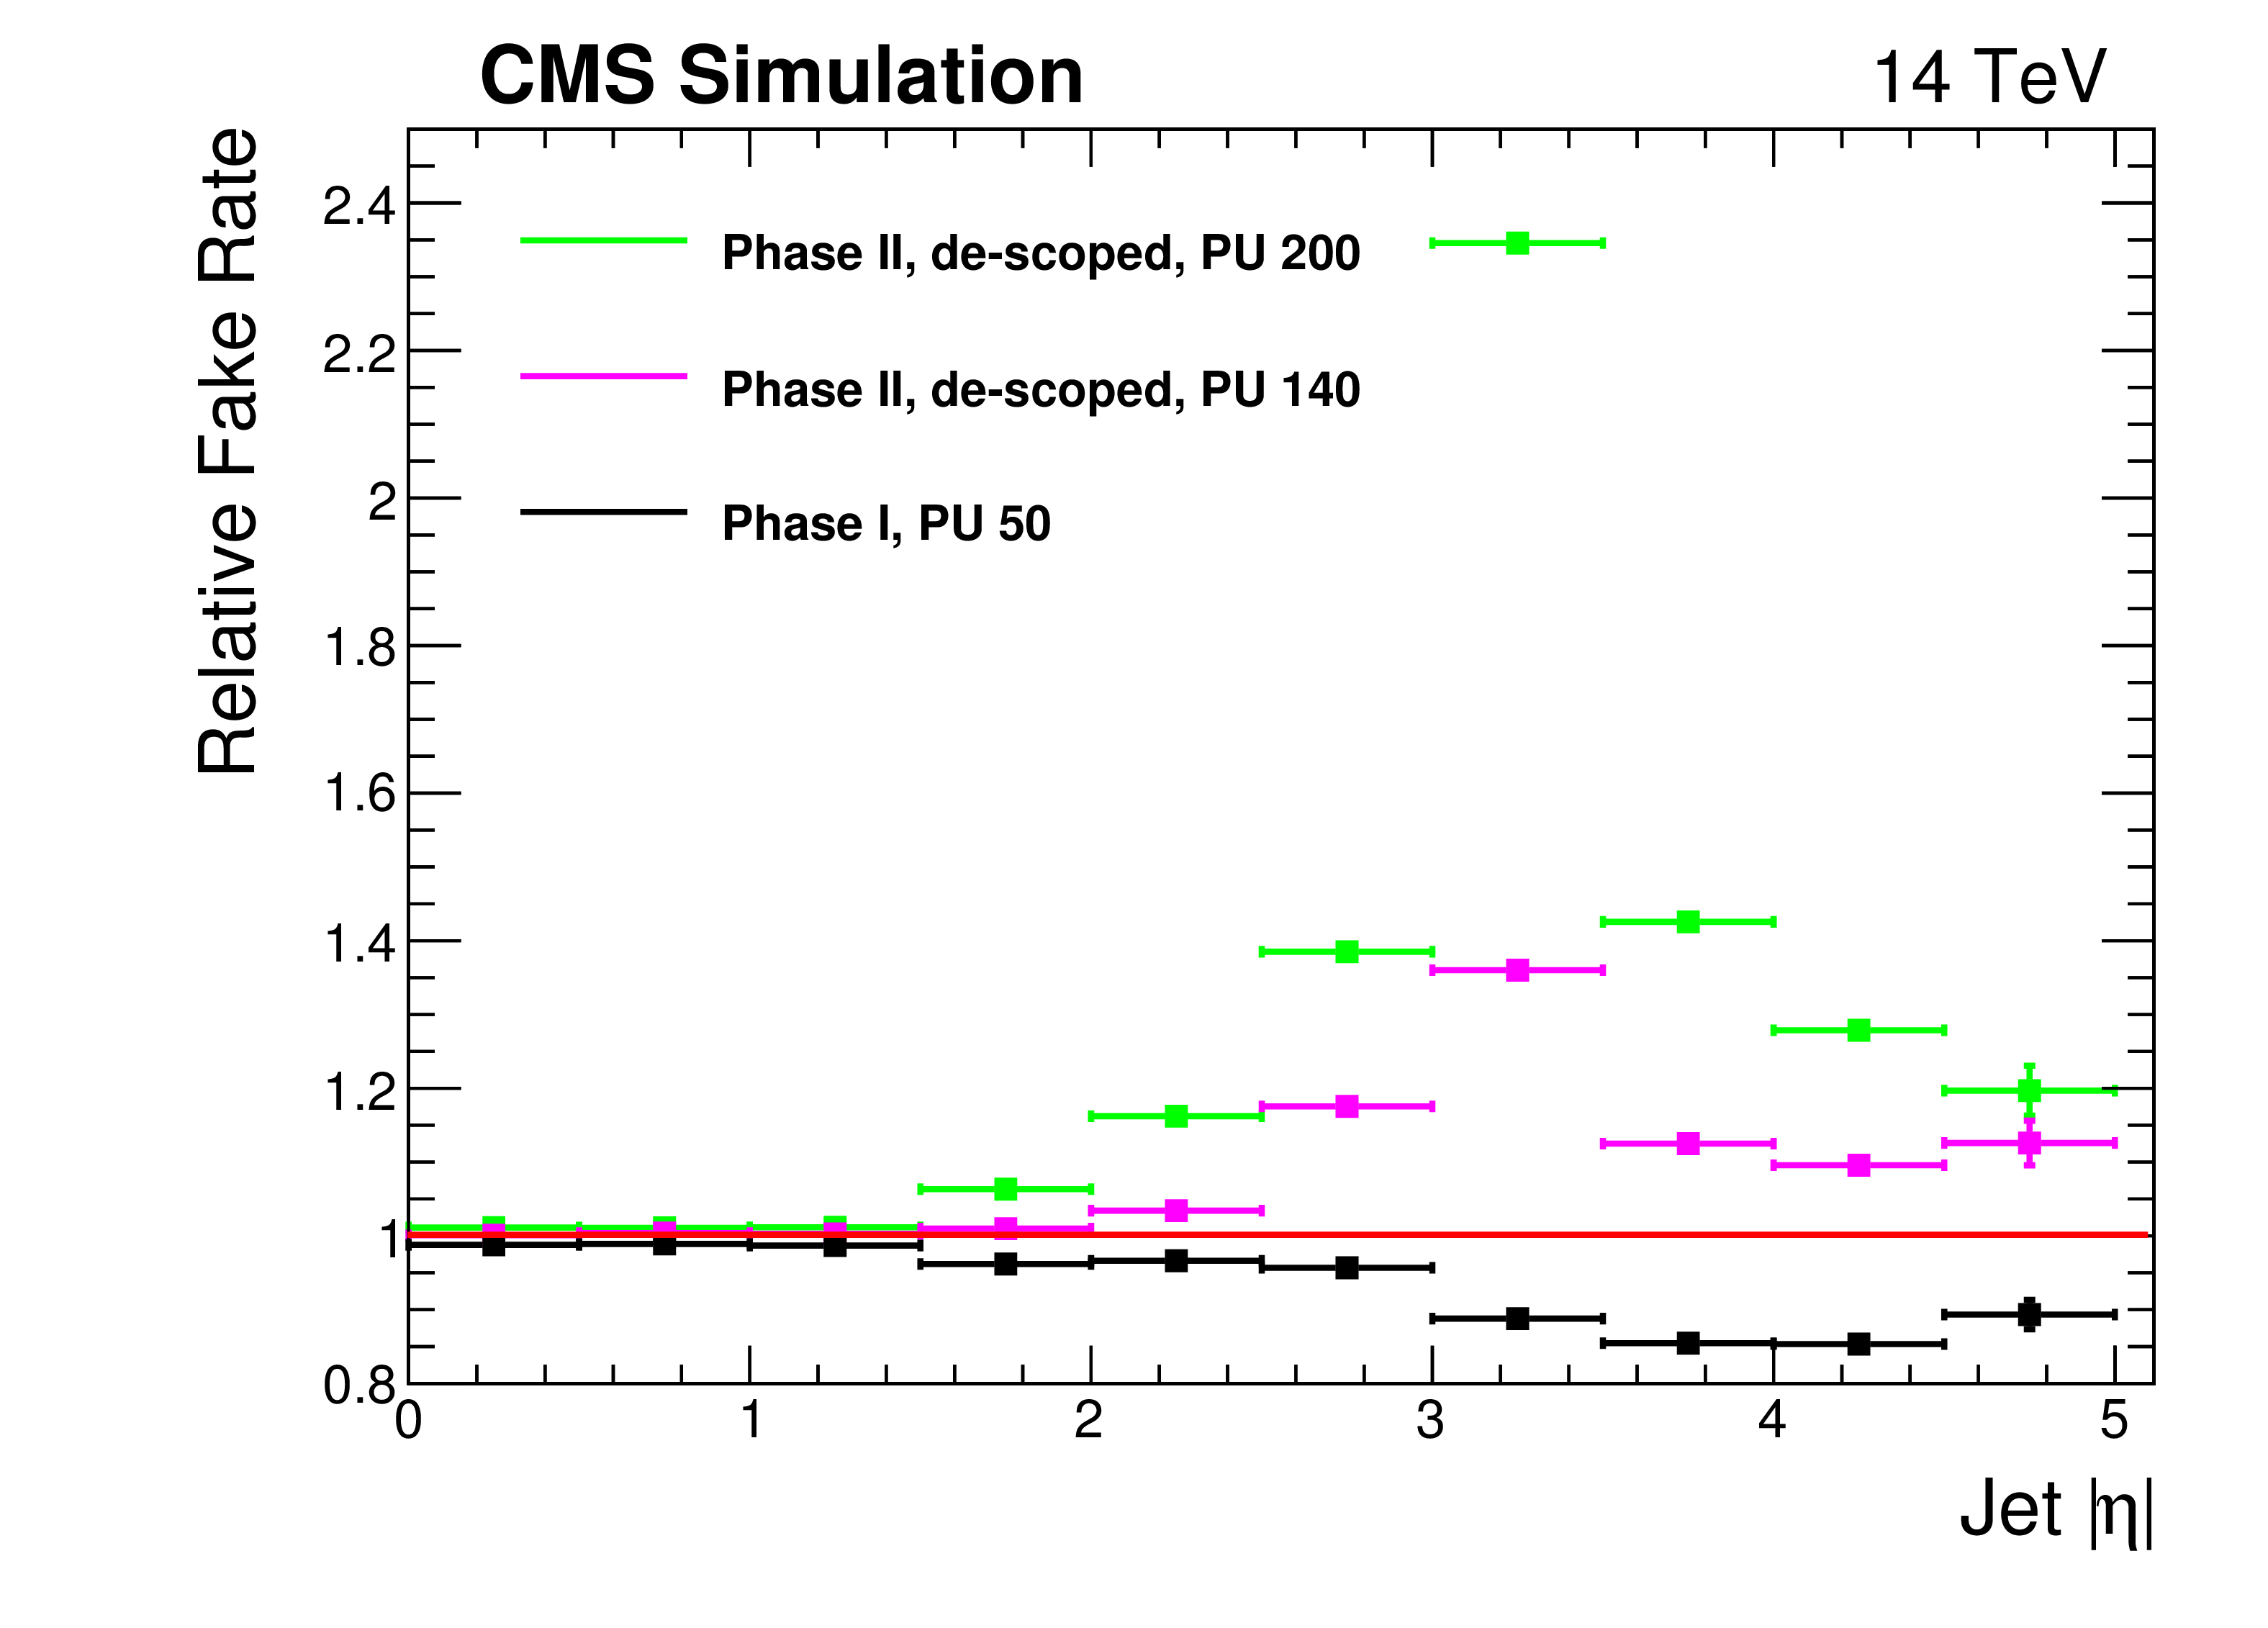
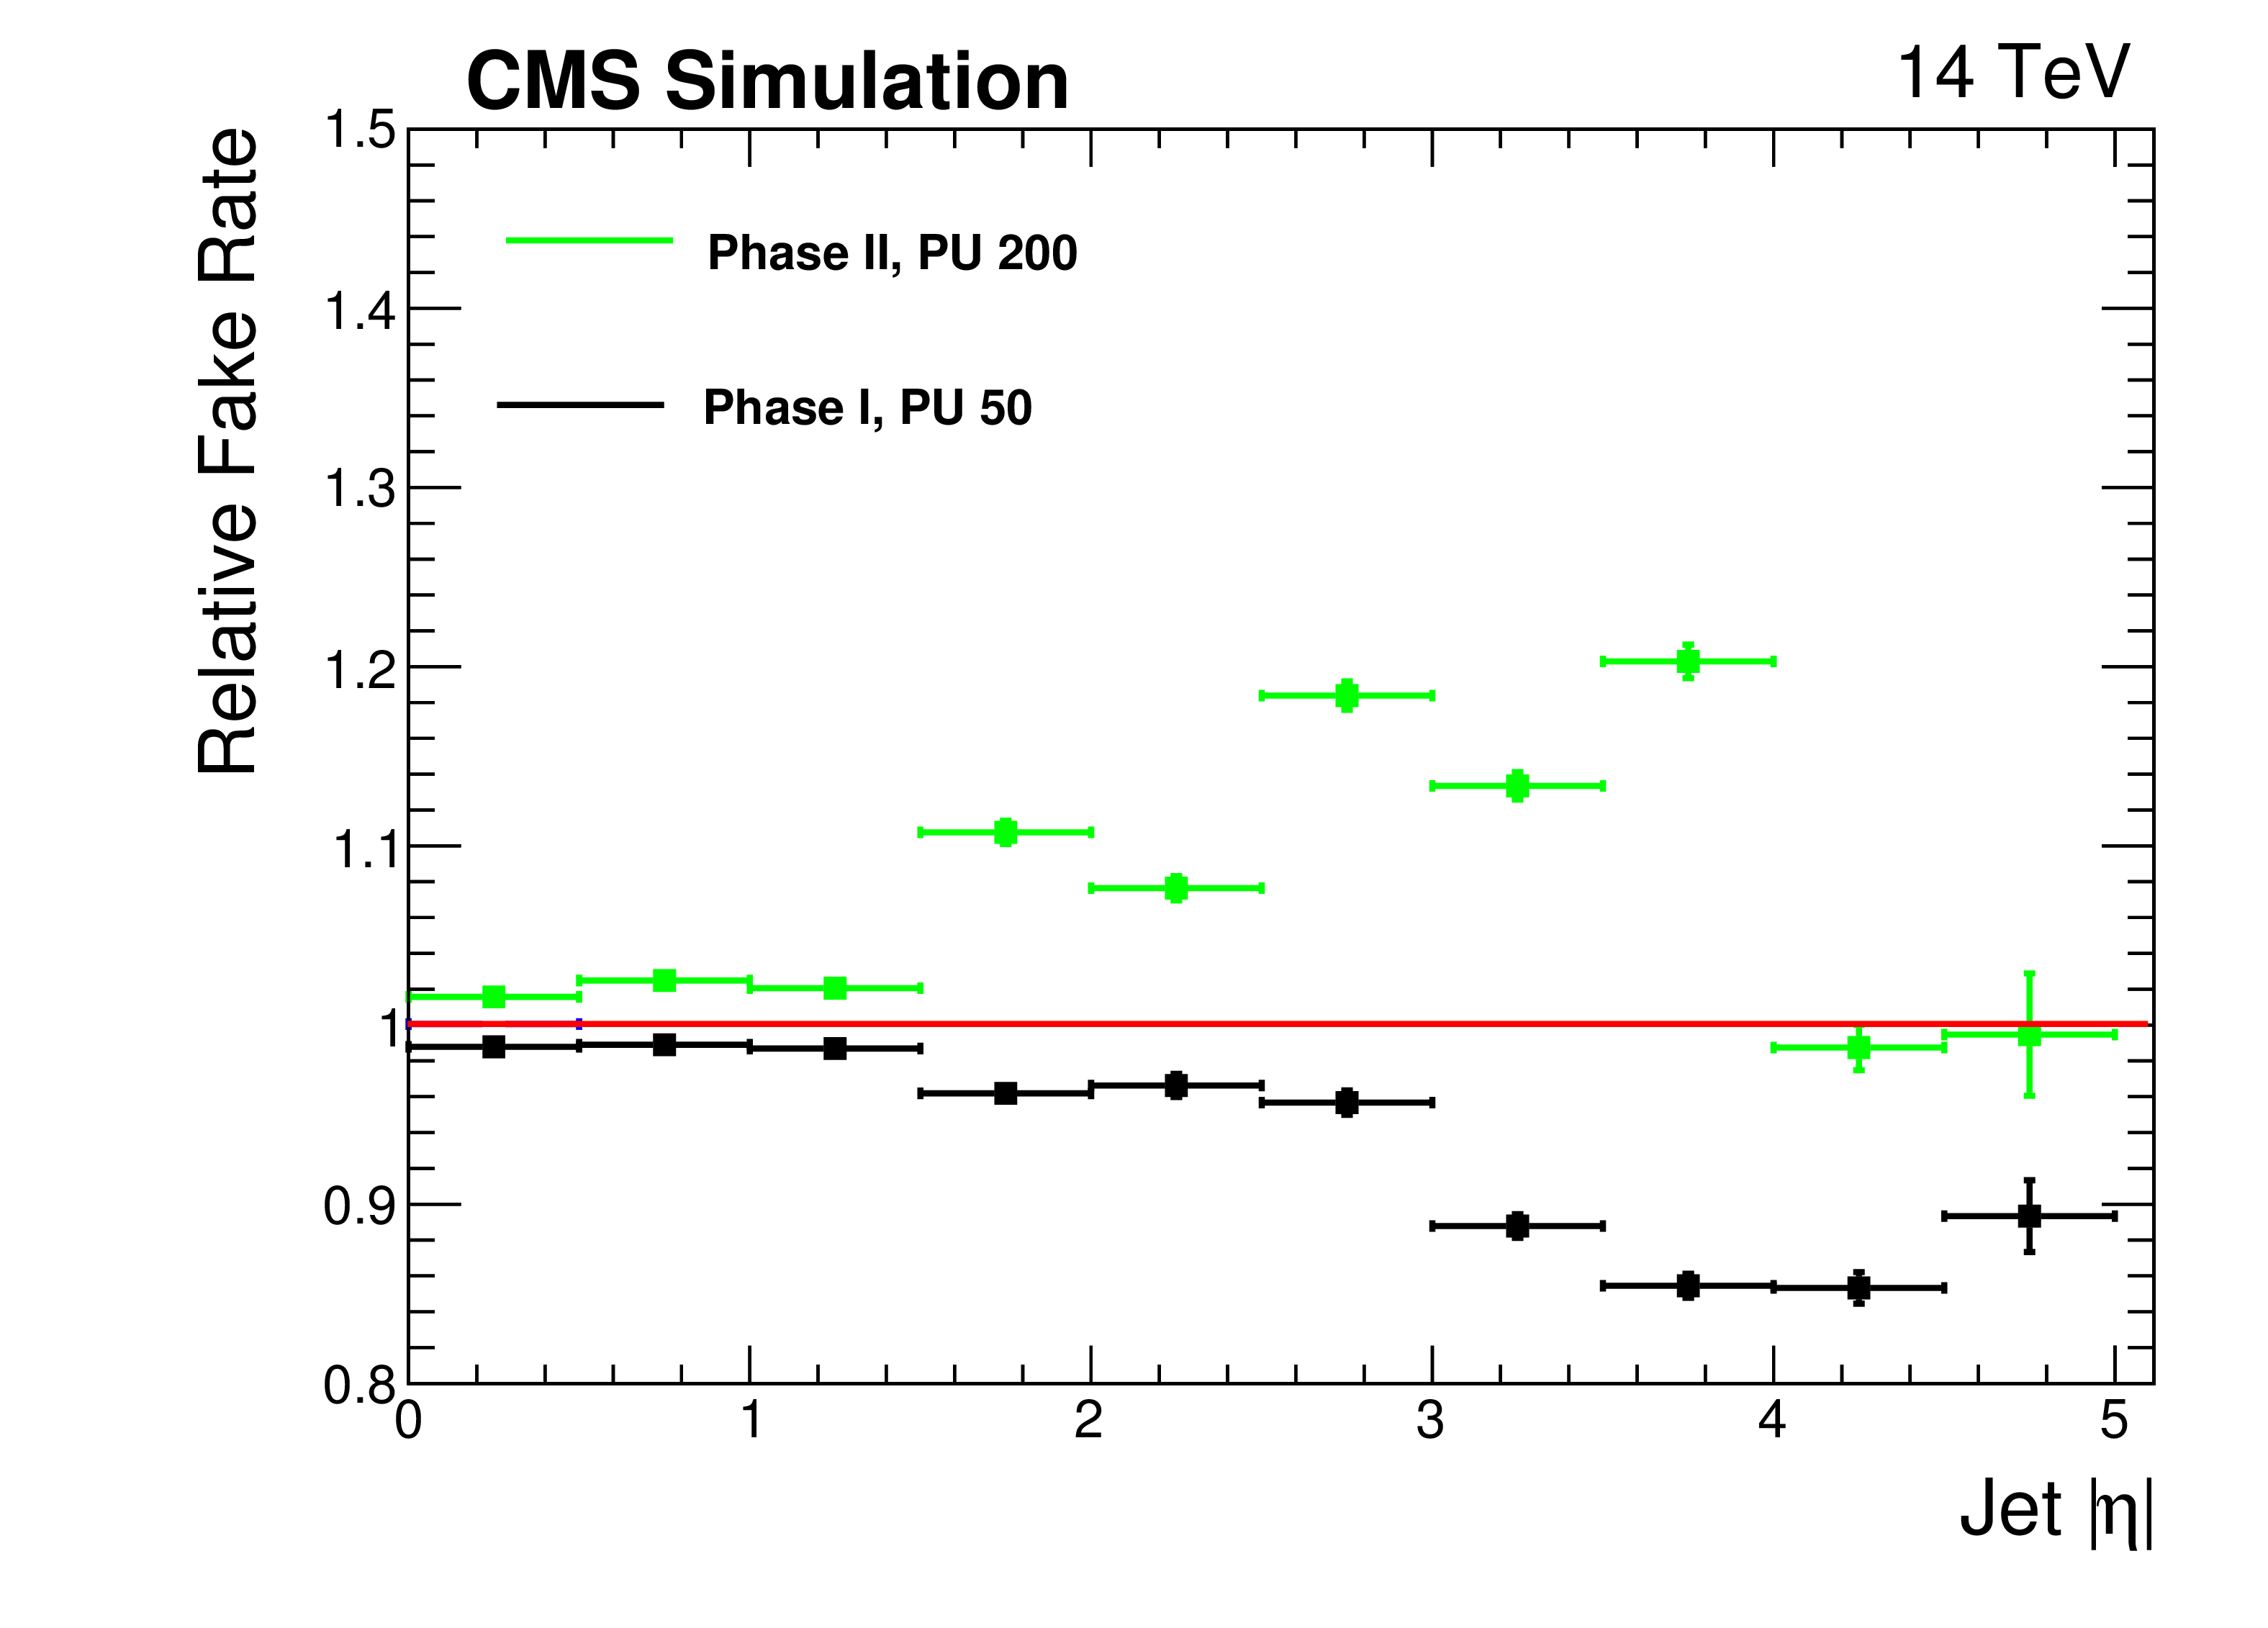
Figure 17:
Relative rate of additional misidentified jets as a function of pseudorapidity for different pileup configuration. Results are shown relative to the performance of the reference detector at $<$PU$>=140$ for the Scenario 2 configuration at $<$PU$>=200$ (green) and $<$PU$>=140$ (magenta) and for the Phase I detector at $<$PU$>=50$ (black). |
png ; pdf ; |
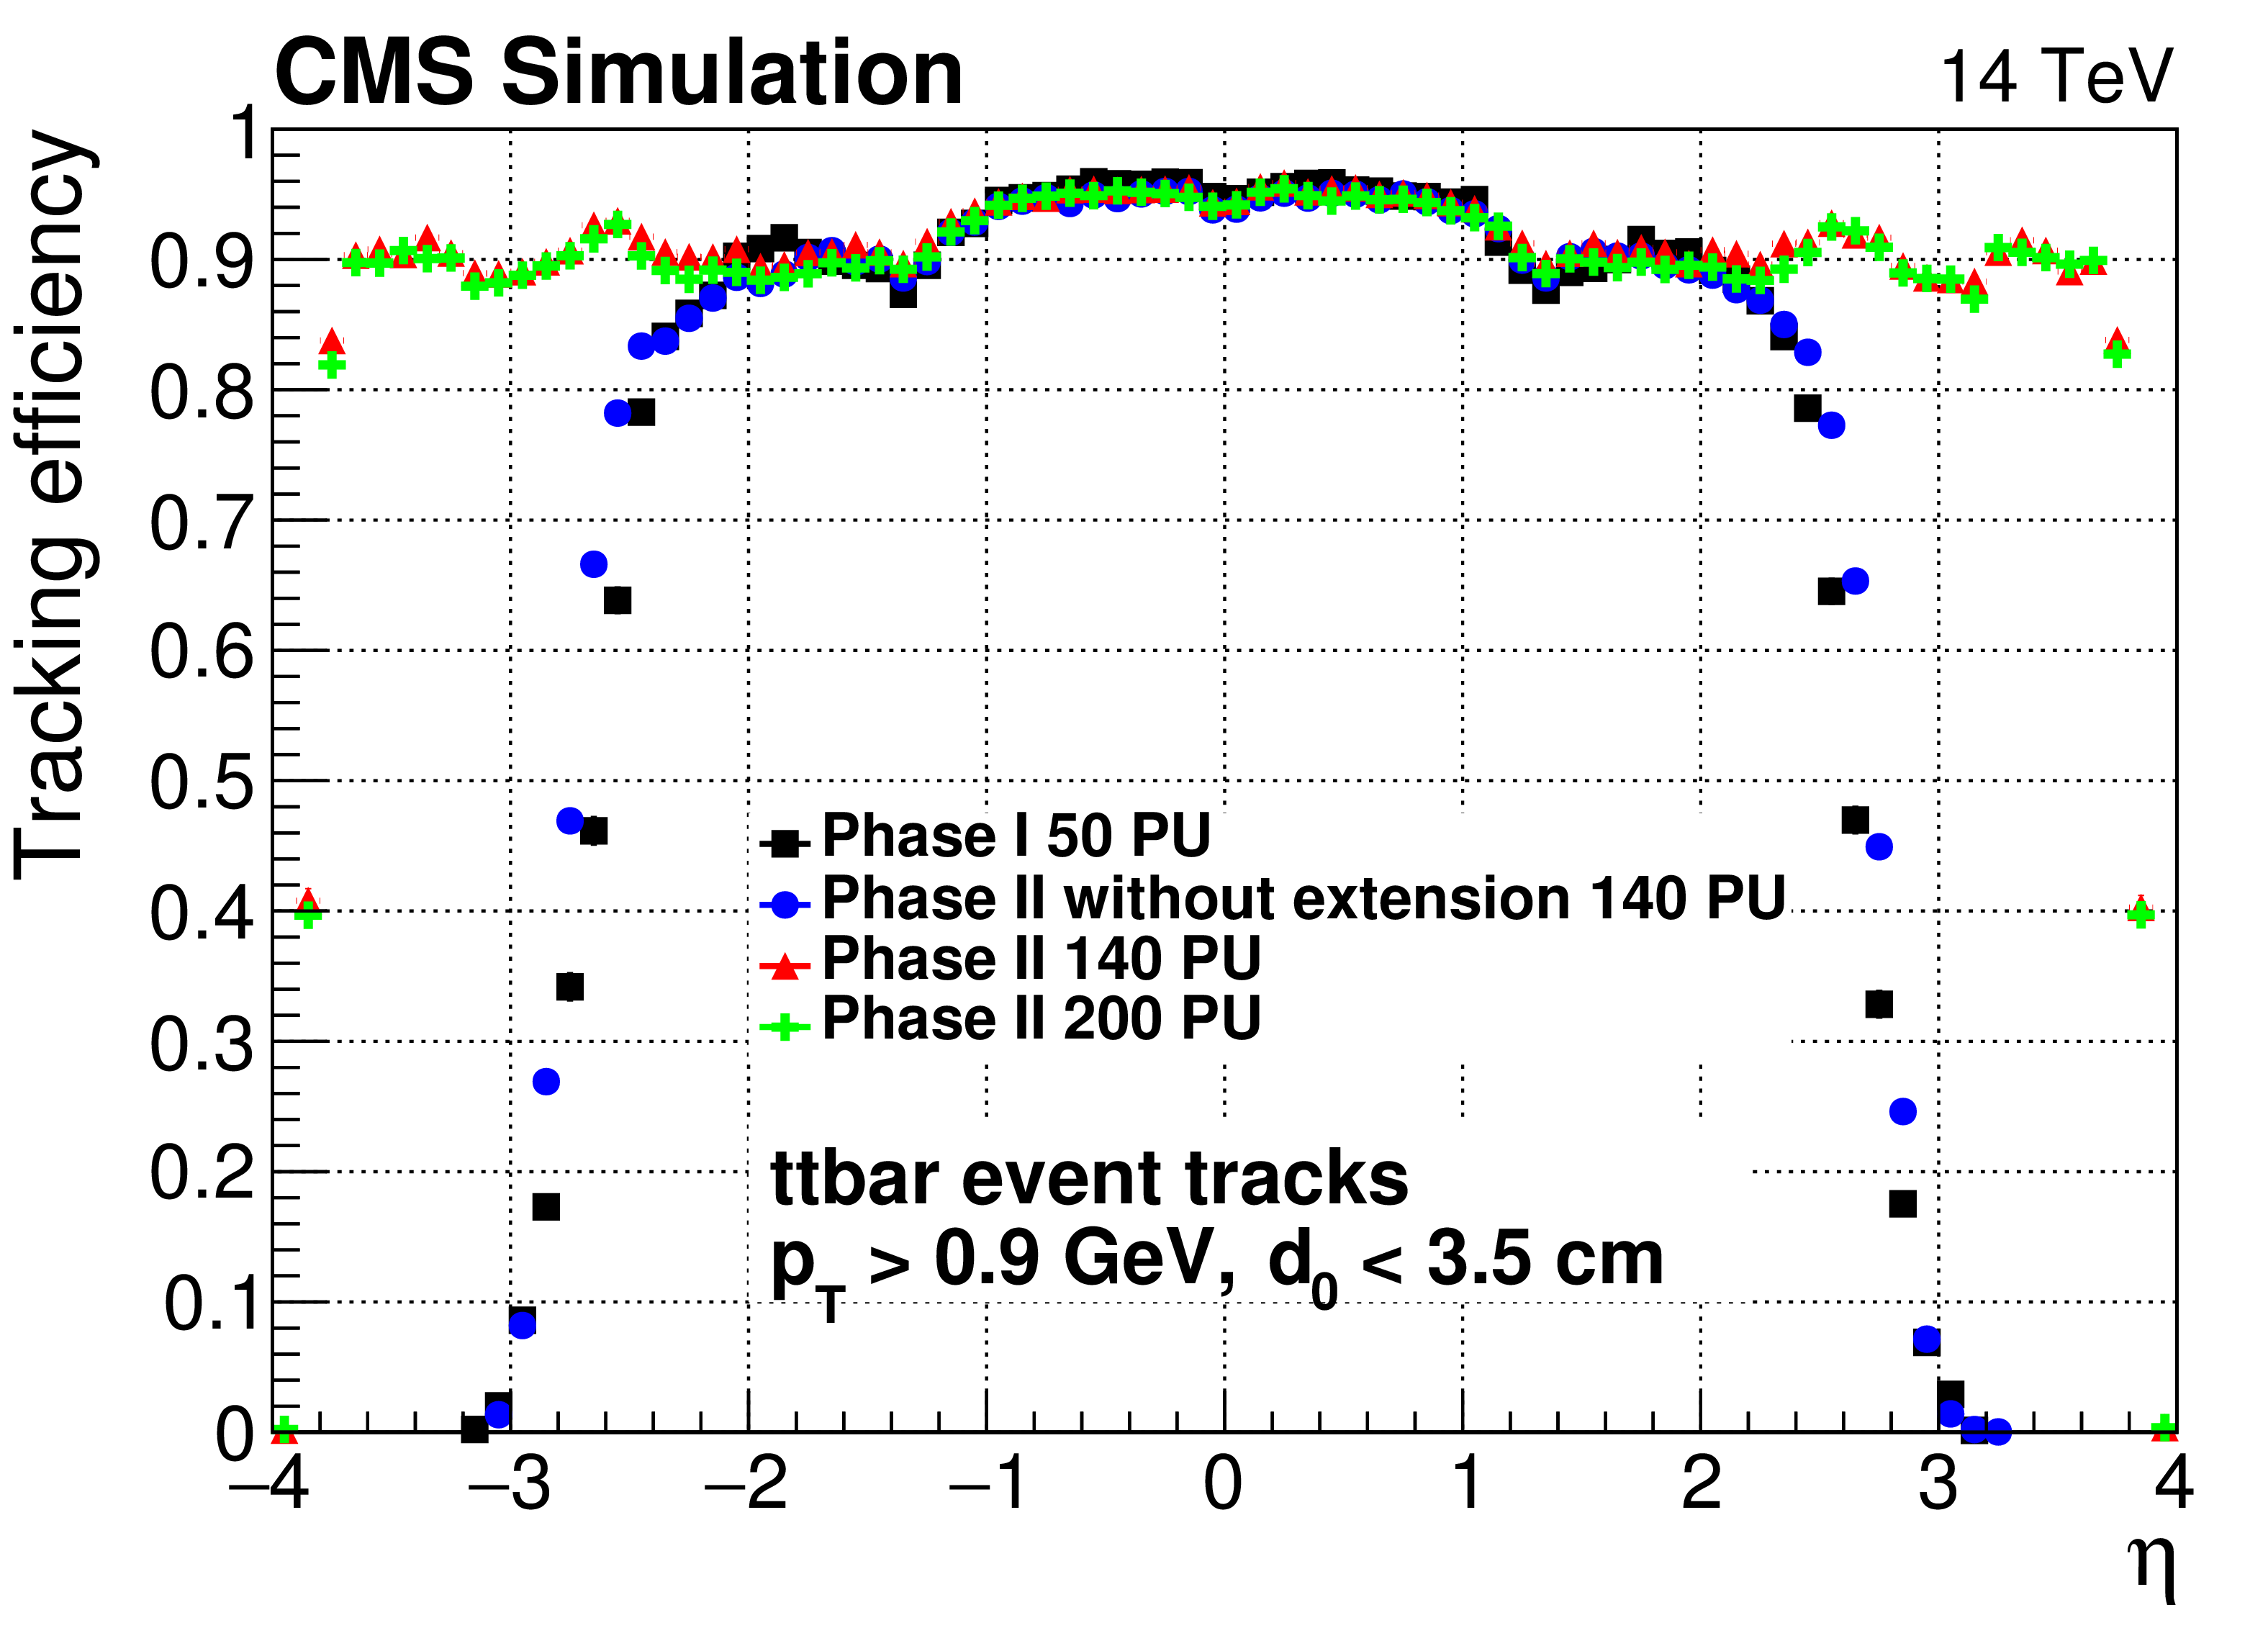
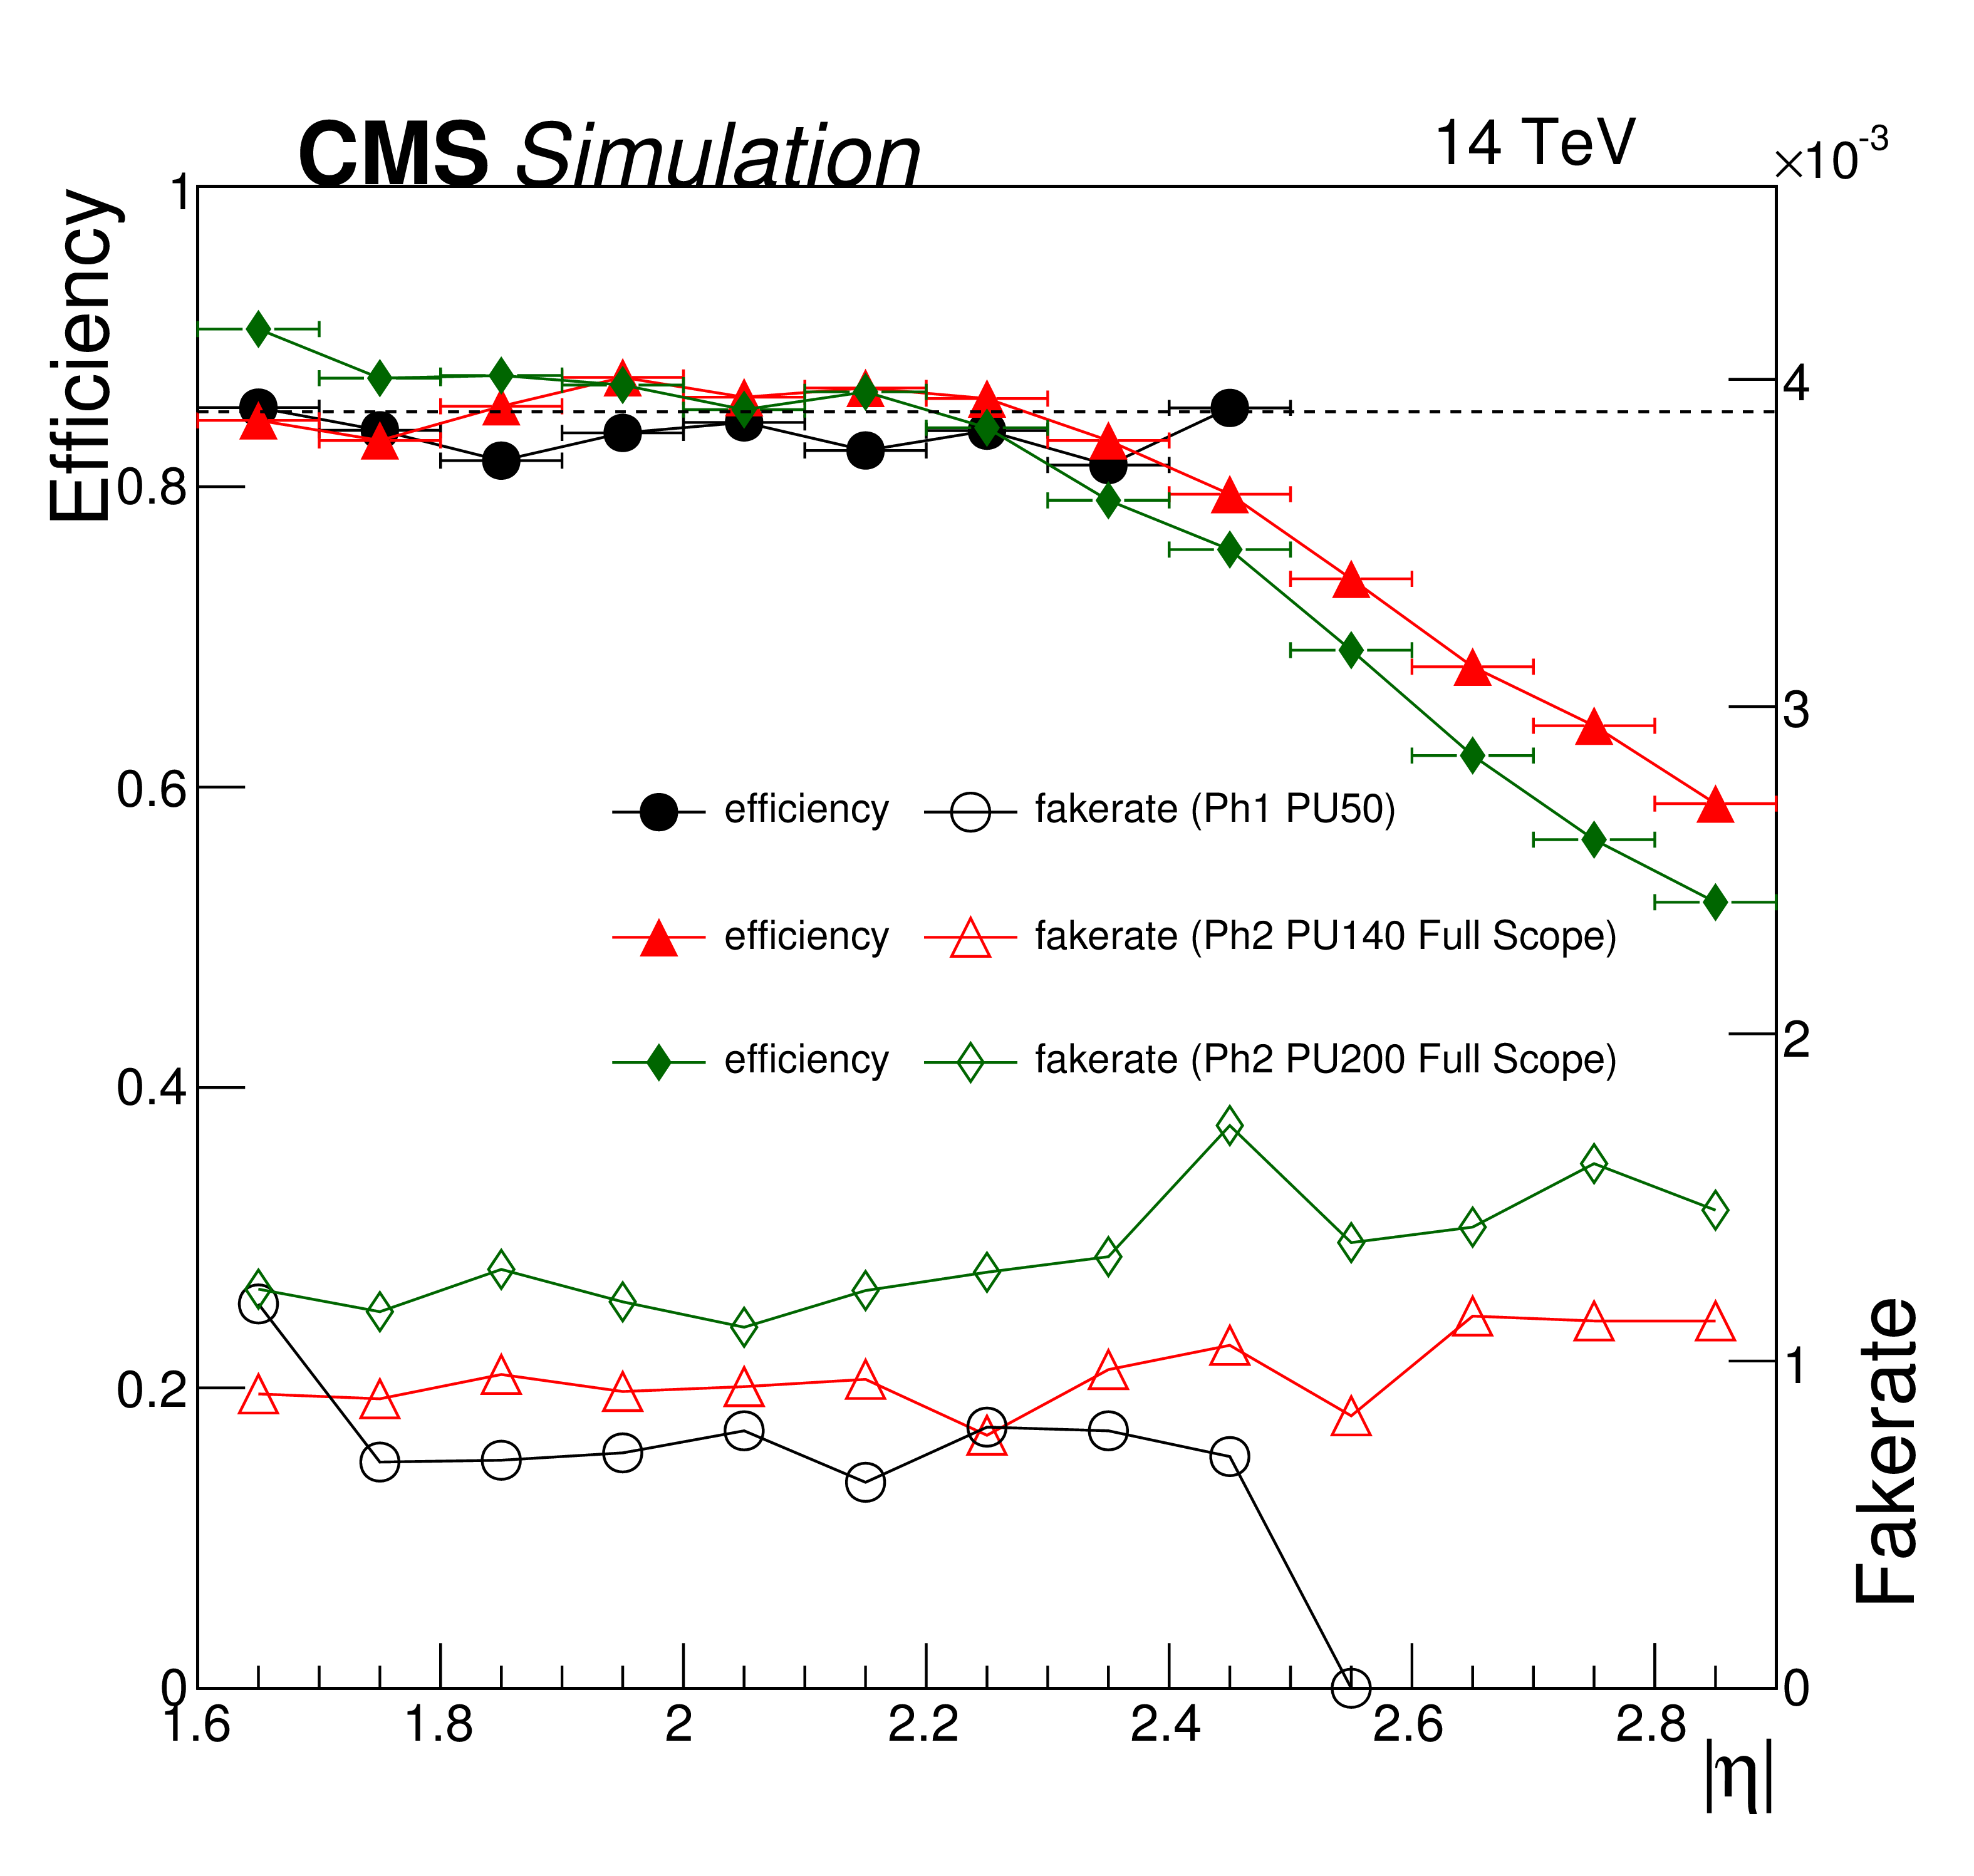
Figure 18-a:
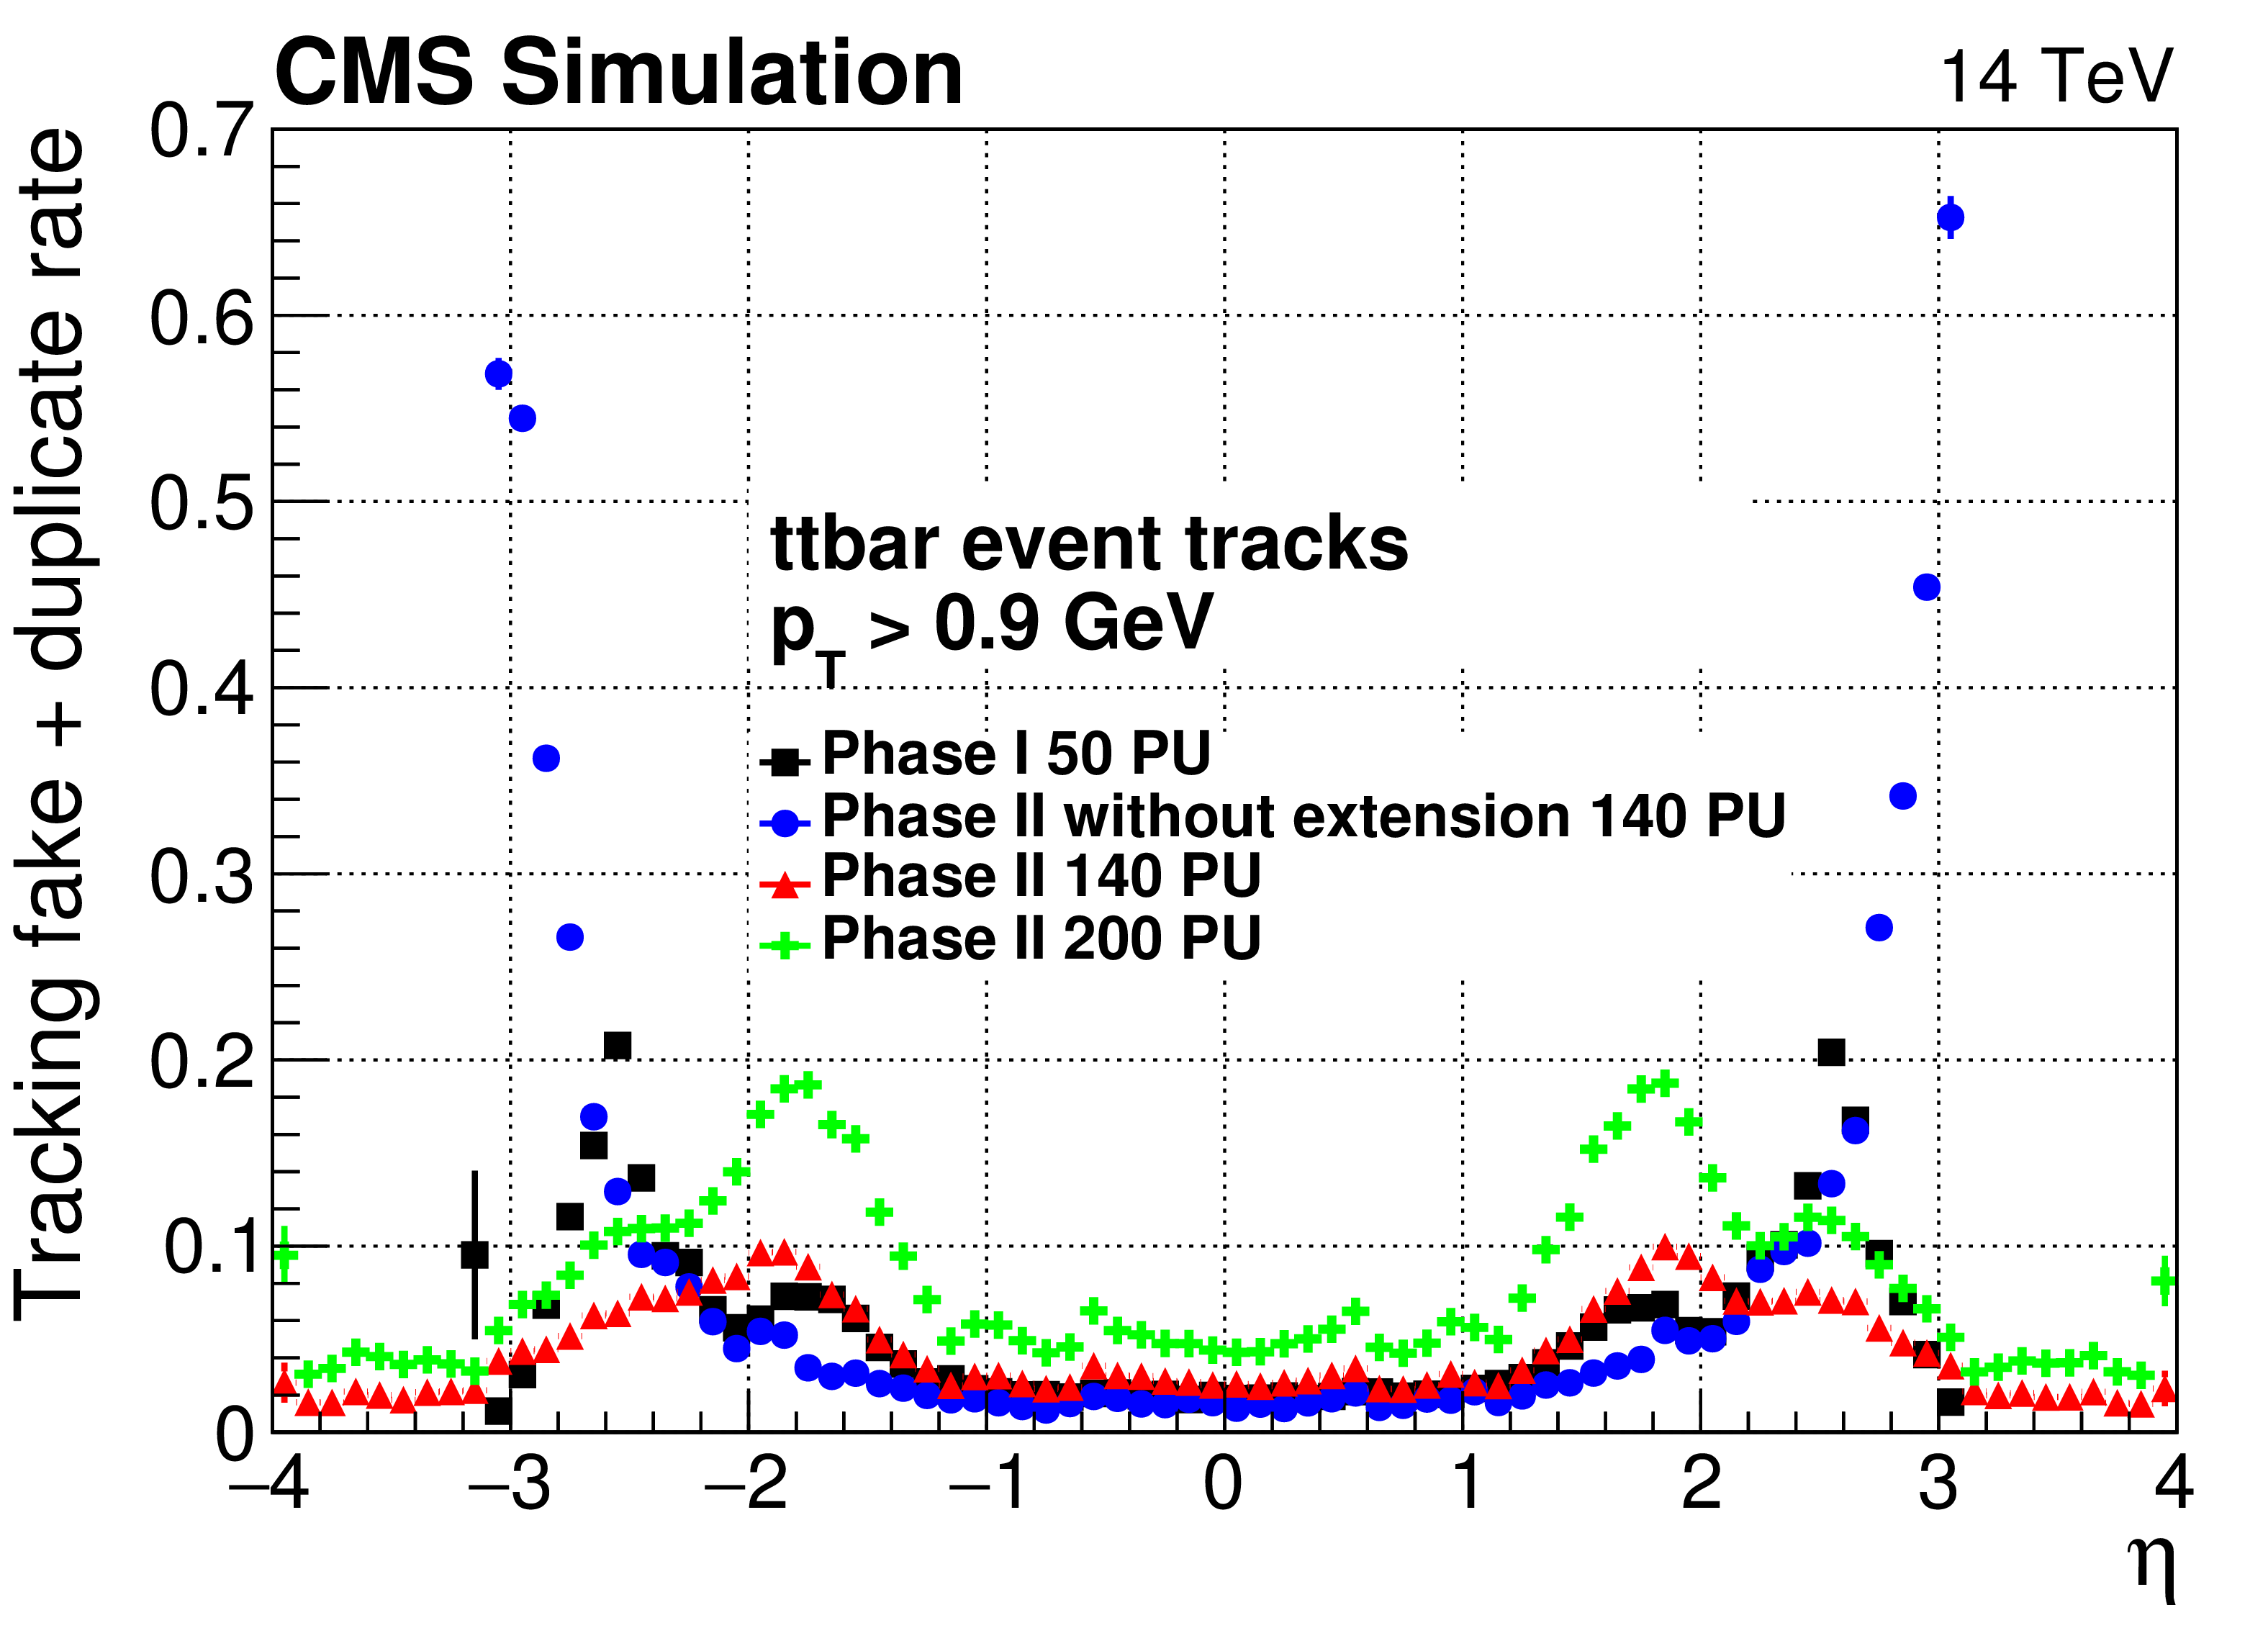
Track reconstruction efficiency (left) and track misreconstruction rate (right) for $ {p_{\mathrm {T}}} >$ 0.9 GeV as a function of $\eta $ for $\mathrm{ t \bar{t} }$ events. The results are shown for three configurations, the full scope detector with 140 (red) and 200 (green) pileup events and without the forward extension of the tracker (blue) with 140 pileup events. Results based on Phase I detector with 50 (black) pileup events are also included. |
png ; pdf ; |
Figure 18-b:
Track reconstruction efficiency (left) and track misreconstruction rate (right) for $ {p_{\mathrm {T}}} >$ 0.9 GeV as a function of $\eta $ for $\mathrm{ t \bar{t} }$ events. The results are shown for three configurations, the full scope detector with 140 (red) and 200 (green) pileup events and without the forward extension of the tracker (blue) with 140 pileup events. Results based on Phase I detector with 50 (black) pileup events are also included. |
png ; pdf ; |
Figure 19-a:
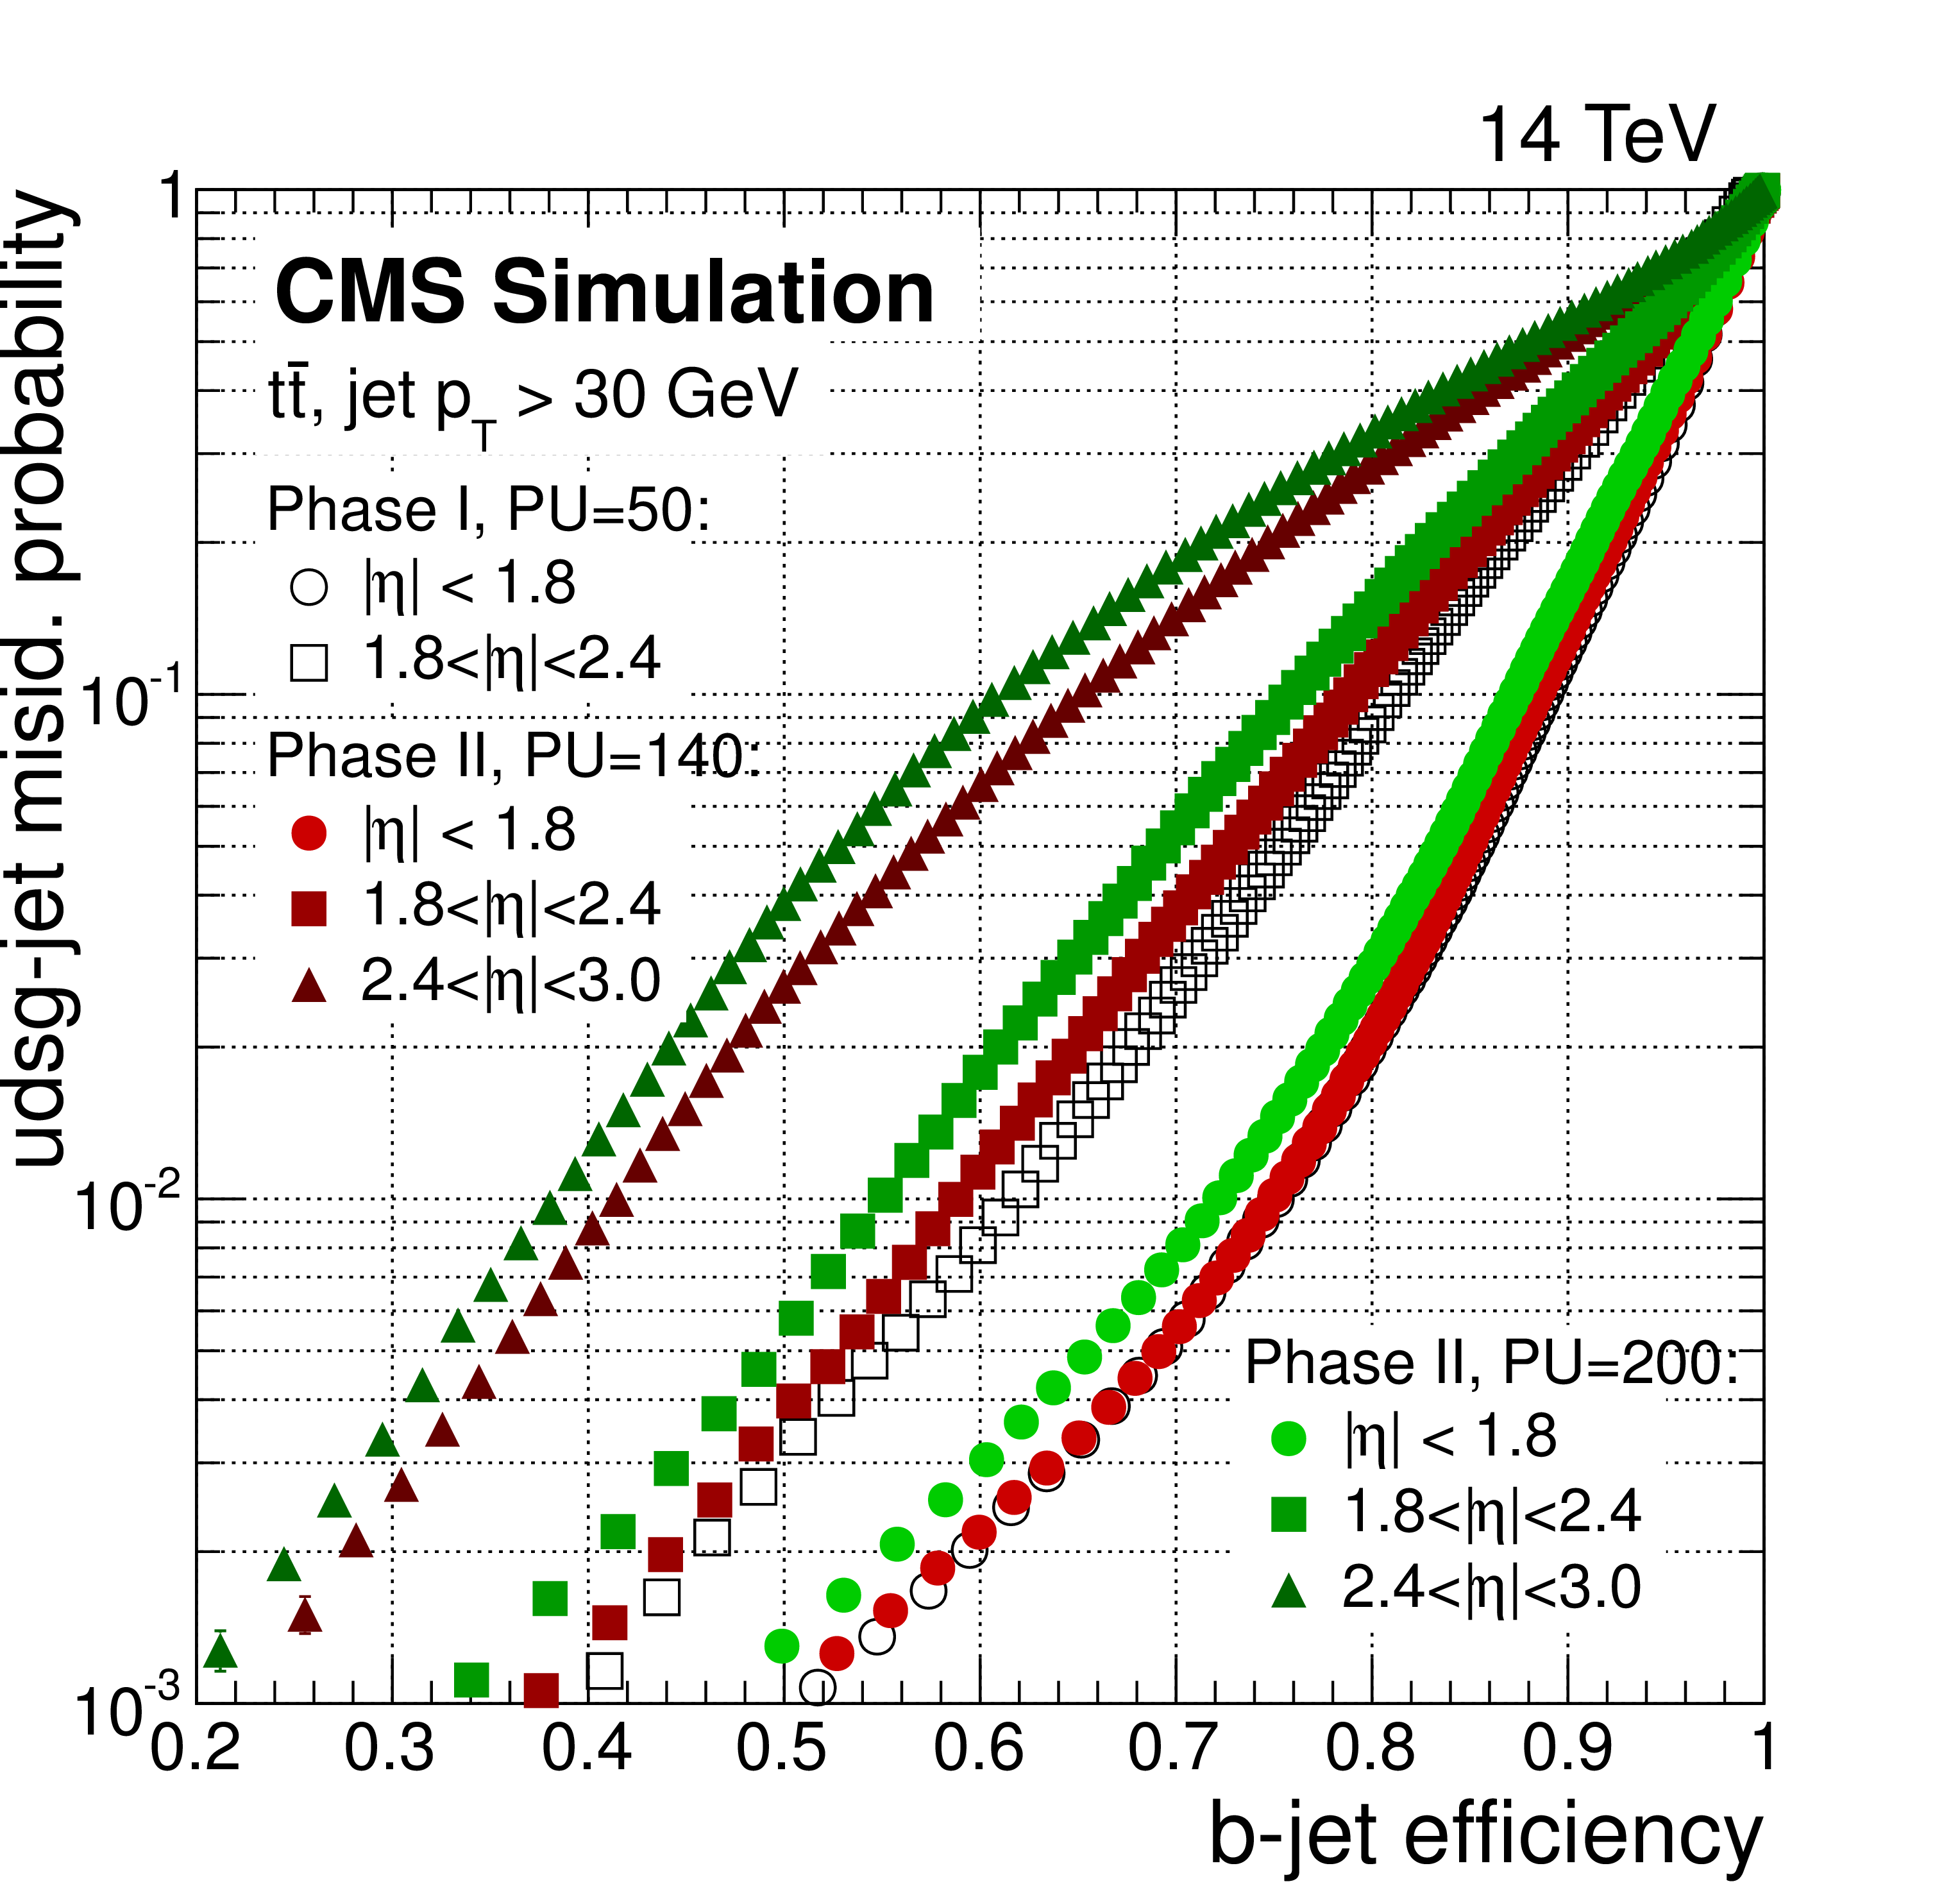
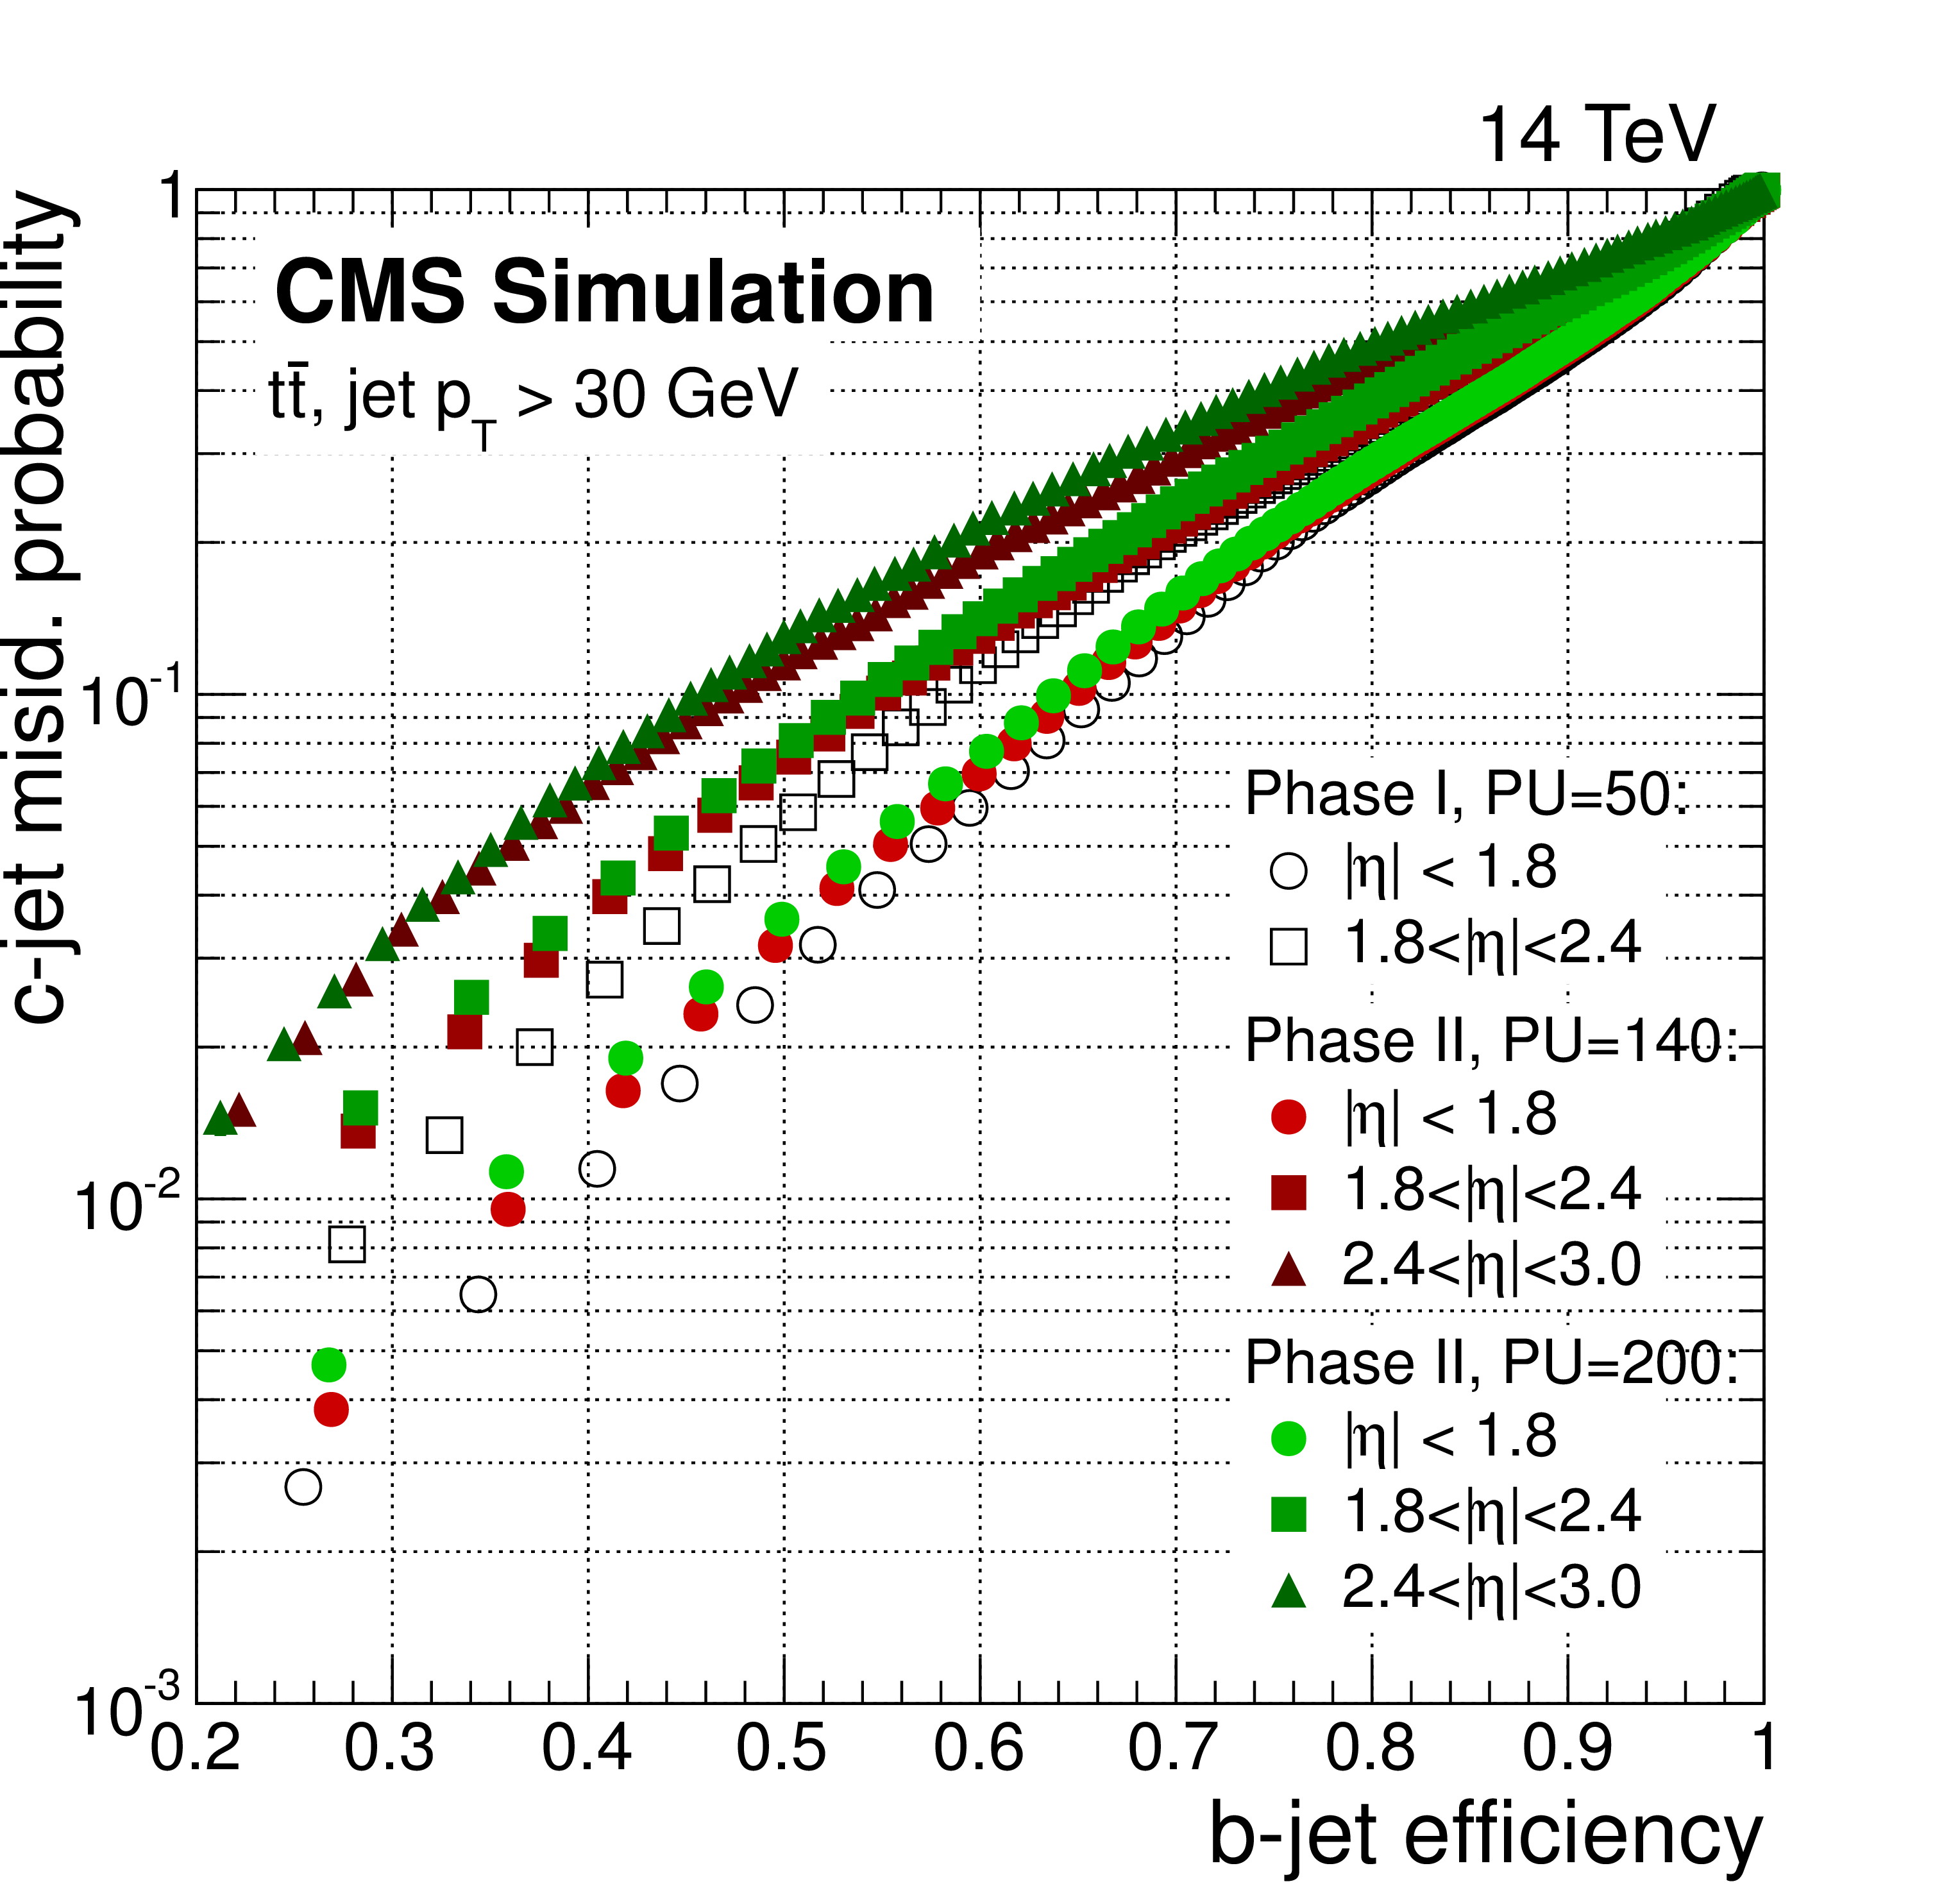
b-jet tagging performance studied with top-pair events at $<$PU$>=140$ (red) and $<$PU$>=200$ (green) for different pseudorapidity ranges. Results based on Phase I detector at $<$PU$>=50$ (open black) are also shown. Performance is expressed as misidentification probability for udsg-jets (left) and c-jets (right) as a function of b-jet tagging efficiency. Events are selected only if the correct primary interaction vertex is reconstructed. Good b-jet tagging capability extends to high pseudorapidity. |
png ; pdf ; |
Figure 19-b:
b-jet tagging performance studied with top-pair events at $<$PU$>=140$ (red) and $<$PU$>=200$ (green) for different pseudorapidity ranges. Results based on Phase I detector at $<$PU$>=50$ (open black) are also shown. Performance is expressed as misidentification probability for udsg-jets (left) and c-jets (right) as a function of b-jet tagging efficiency. Events are selected only if the correct primary interaction vertex is reconstructed. Good b-jet tagging capability extends to high pseudorapidity. |
png ; pdf ; |
Figure 20-a:
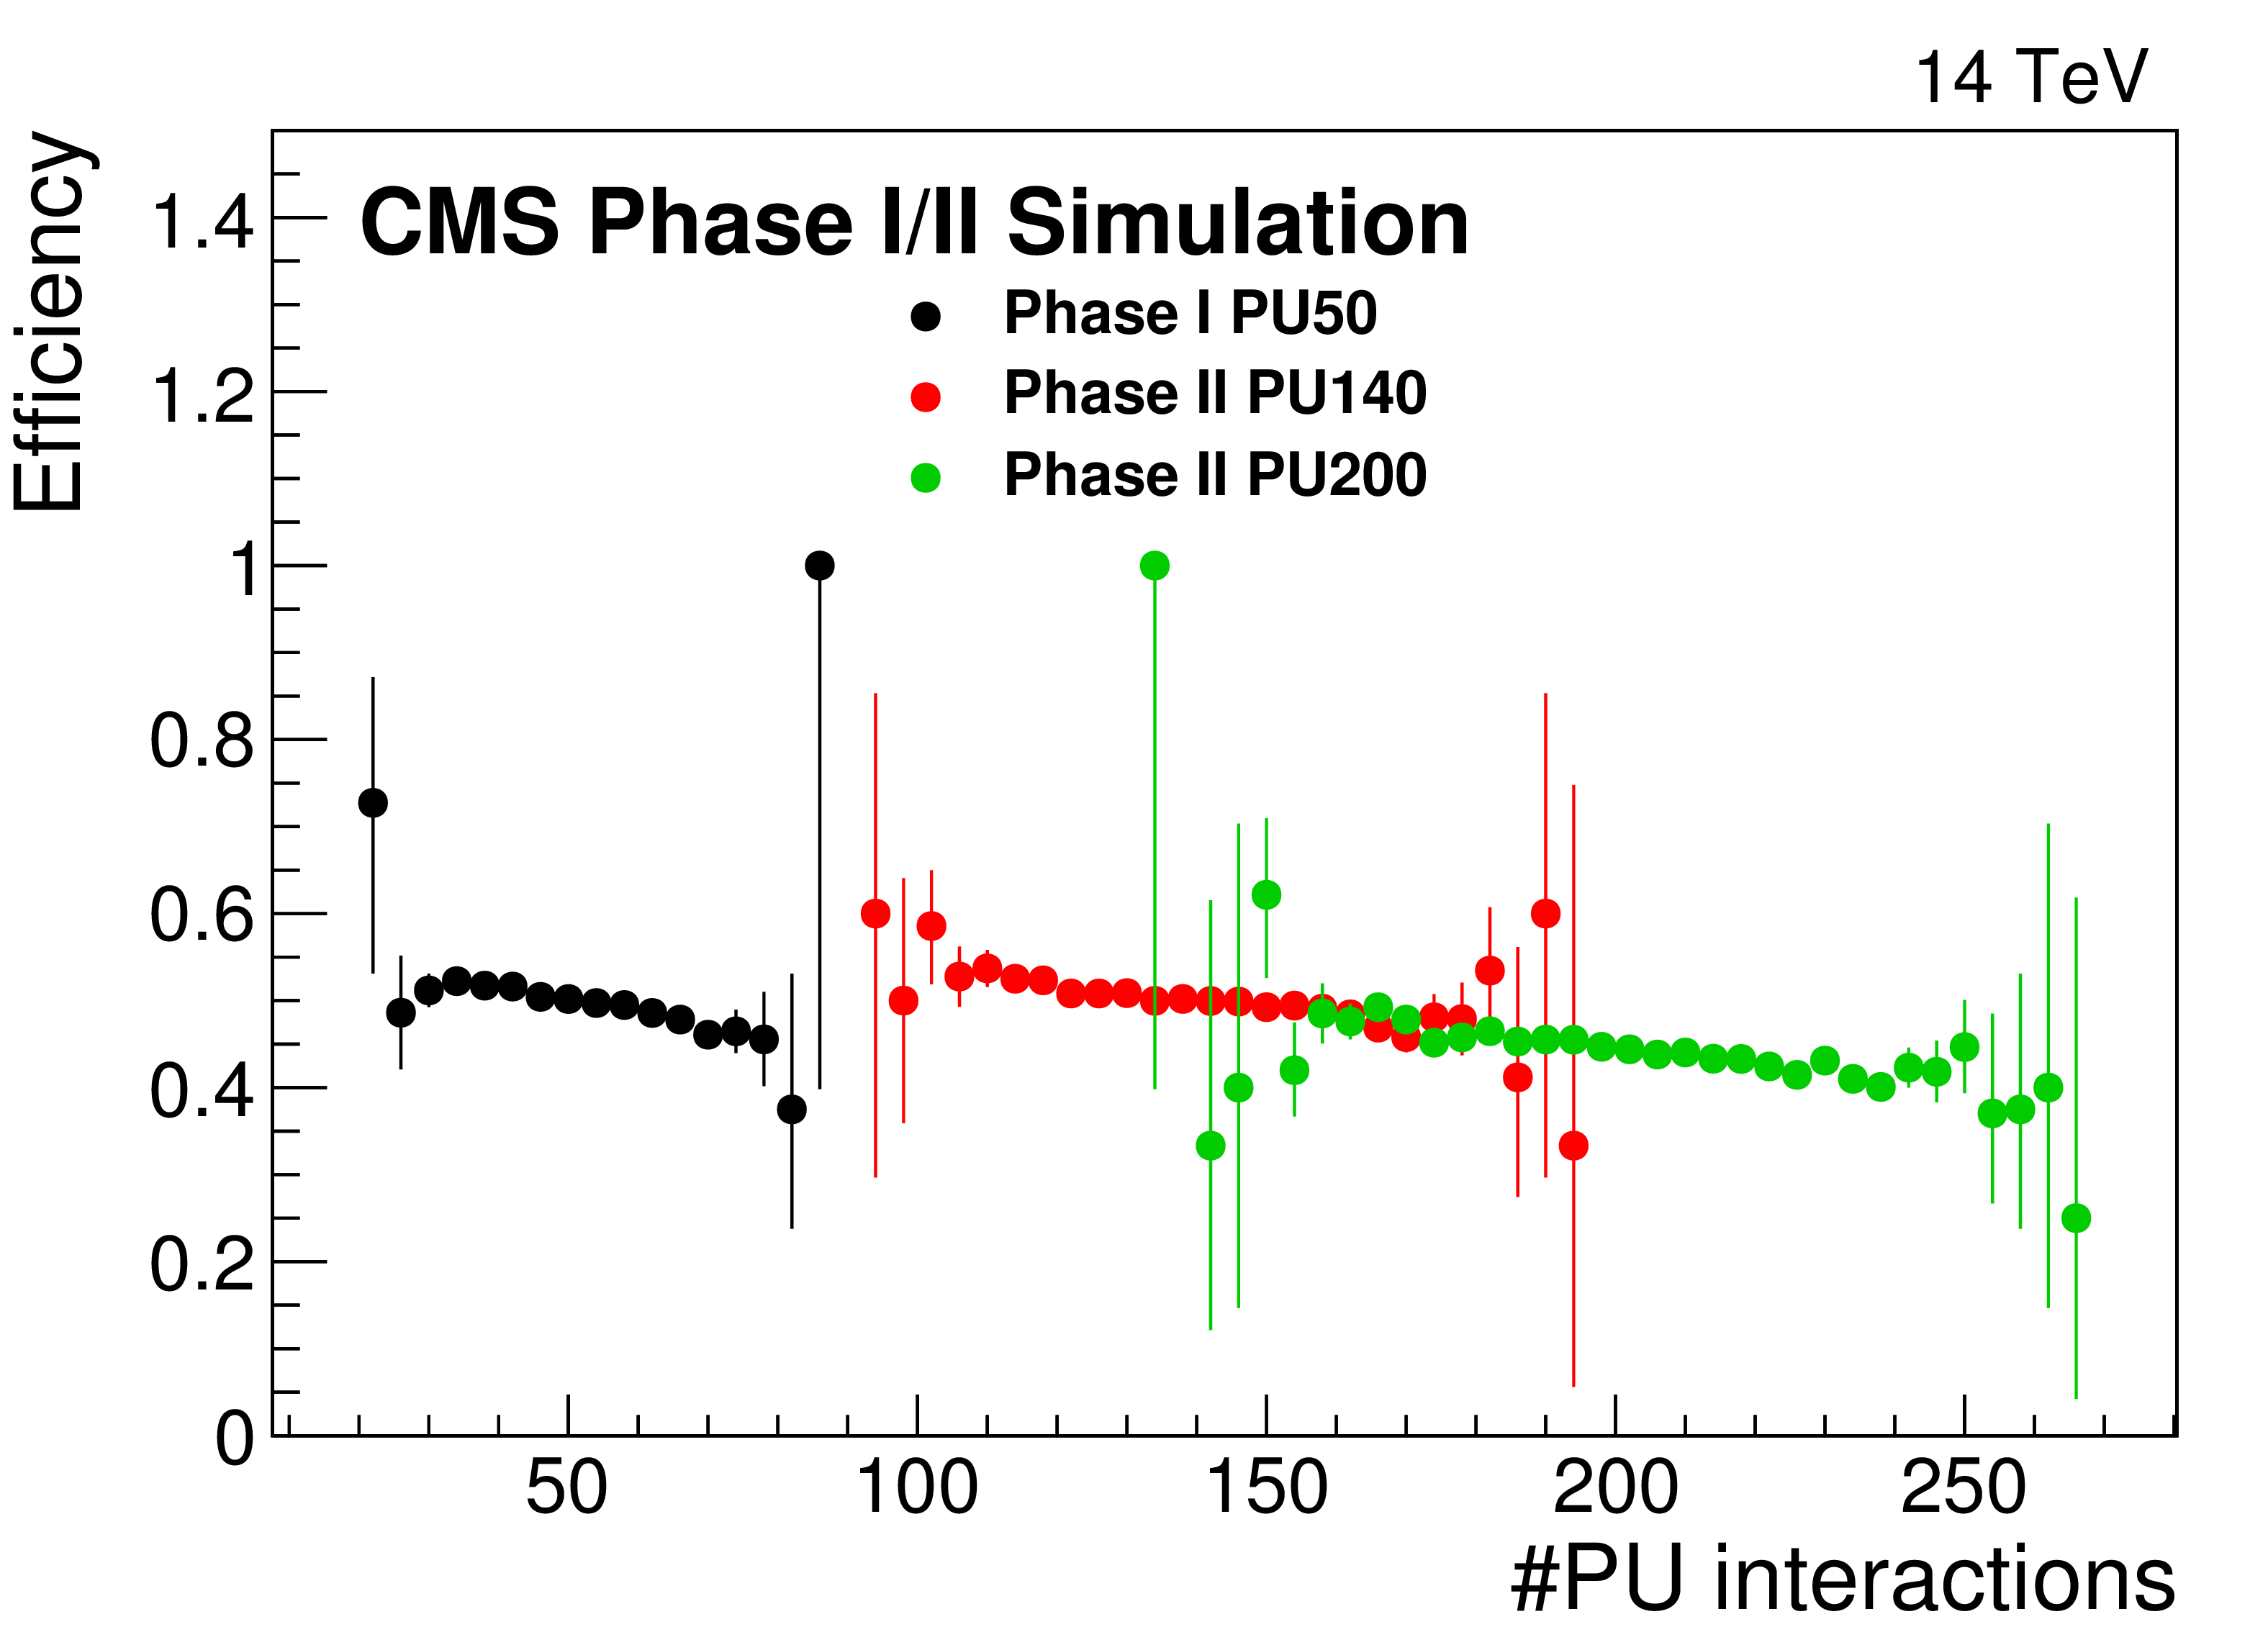
Tau reconstruction and isolation efficiency (left) and misidentification rate (right) as a function of the number of simultaneous interactions. Results using $Z \rightarrow \tau ^{+} \tau ^{-}$ events at $<$PU$>=140$ (red) and $<$PU$>=200$ (green) have been used. The Phase I detector performance at $<$PU$>=50$ (black) is also shown. |
png ; pdf ; |
Figure 20-b:
Tau reconstruction and isolation efficiency (left) and misidentification rate (right) as a function of the number of simultaneous interactions. Results using $Z \rightarrow \tau ^{+} \tau ^{-}$ events at $<$PU$>=140$ (red) and $<$PU$>=200$ (green) have been used. The Phase I detector performance at $<$PU$>=50$ (black) is also shown. |
png ; pdf ; |
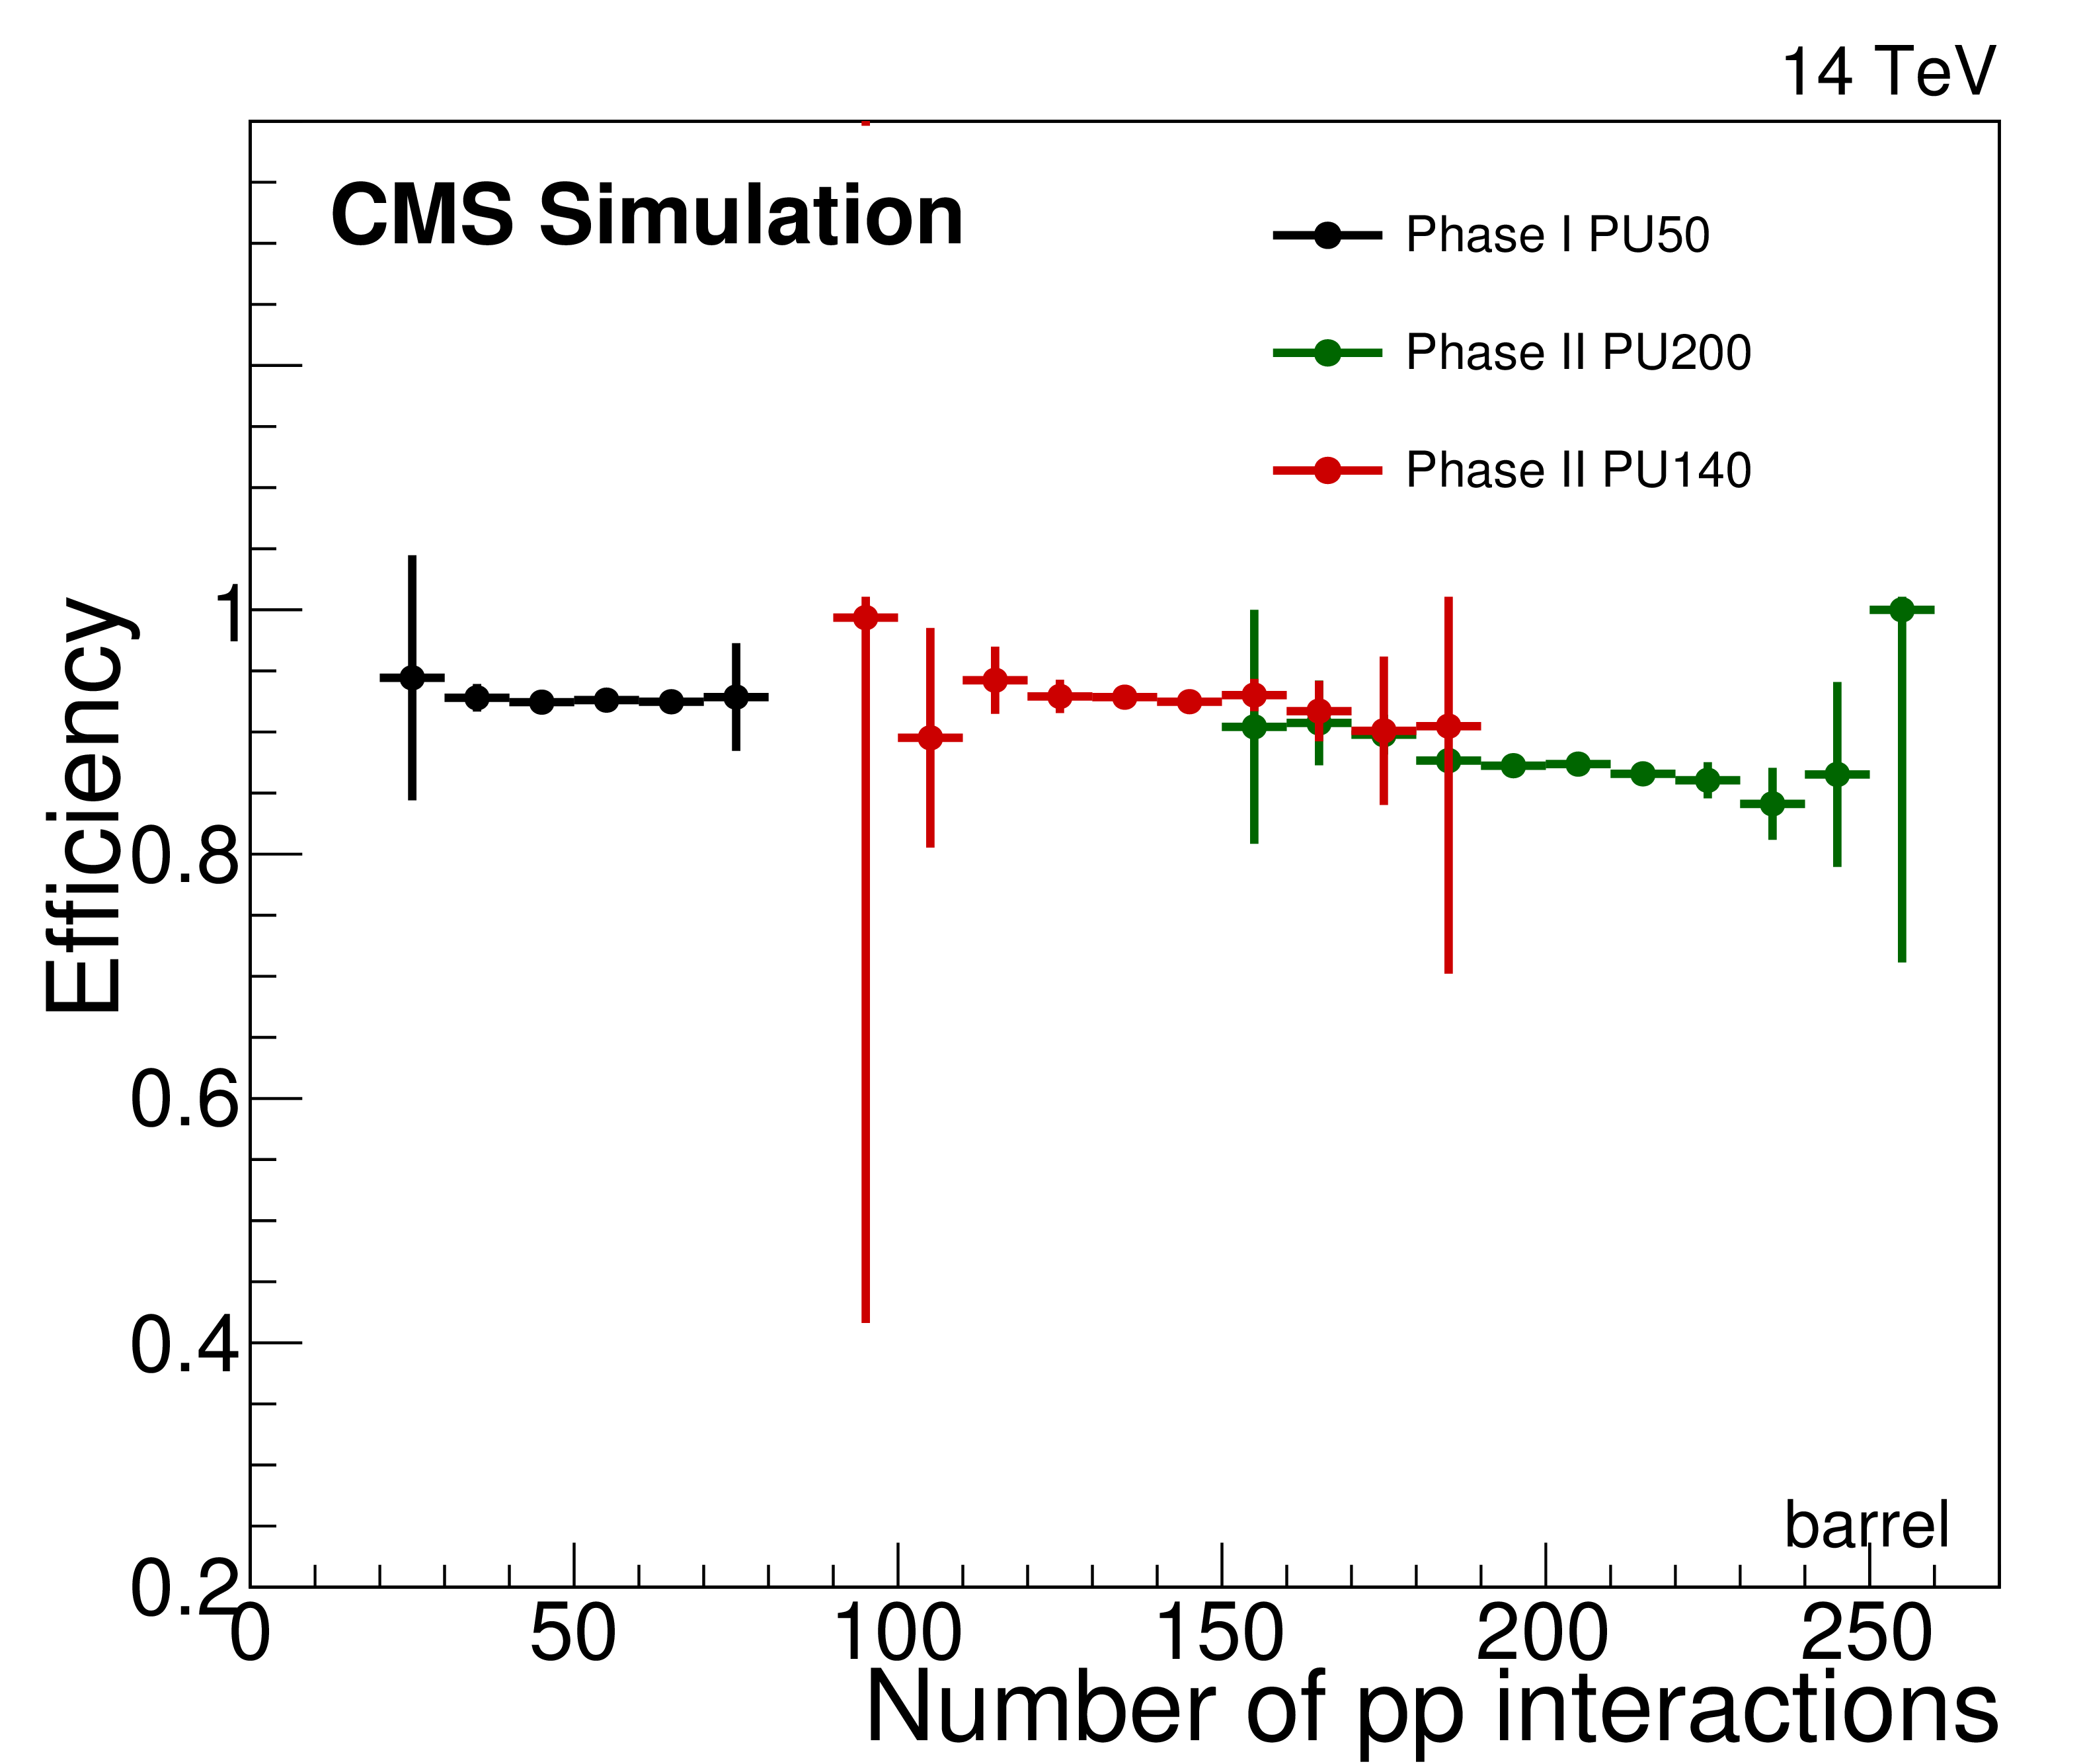
Figure 21-a:
Electron reconstruction efficiency in the barrel (left) and endcap (right) calorimeter as function of the number of pileup $<$PU$>=140$ (red) and $<$PU$>=200$ (green). Results based for the Phase I detector at $<$PU$>=50$ (black) are also shown. The efficiency is derived from simulated Drell-Yan events. |
png ; pdf ; |
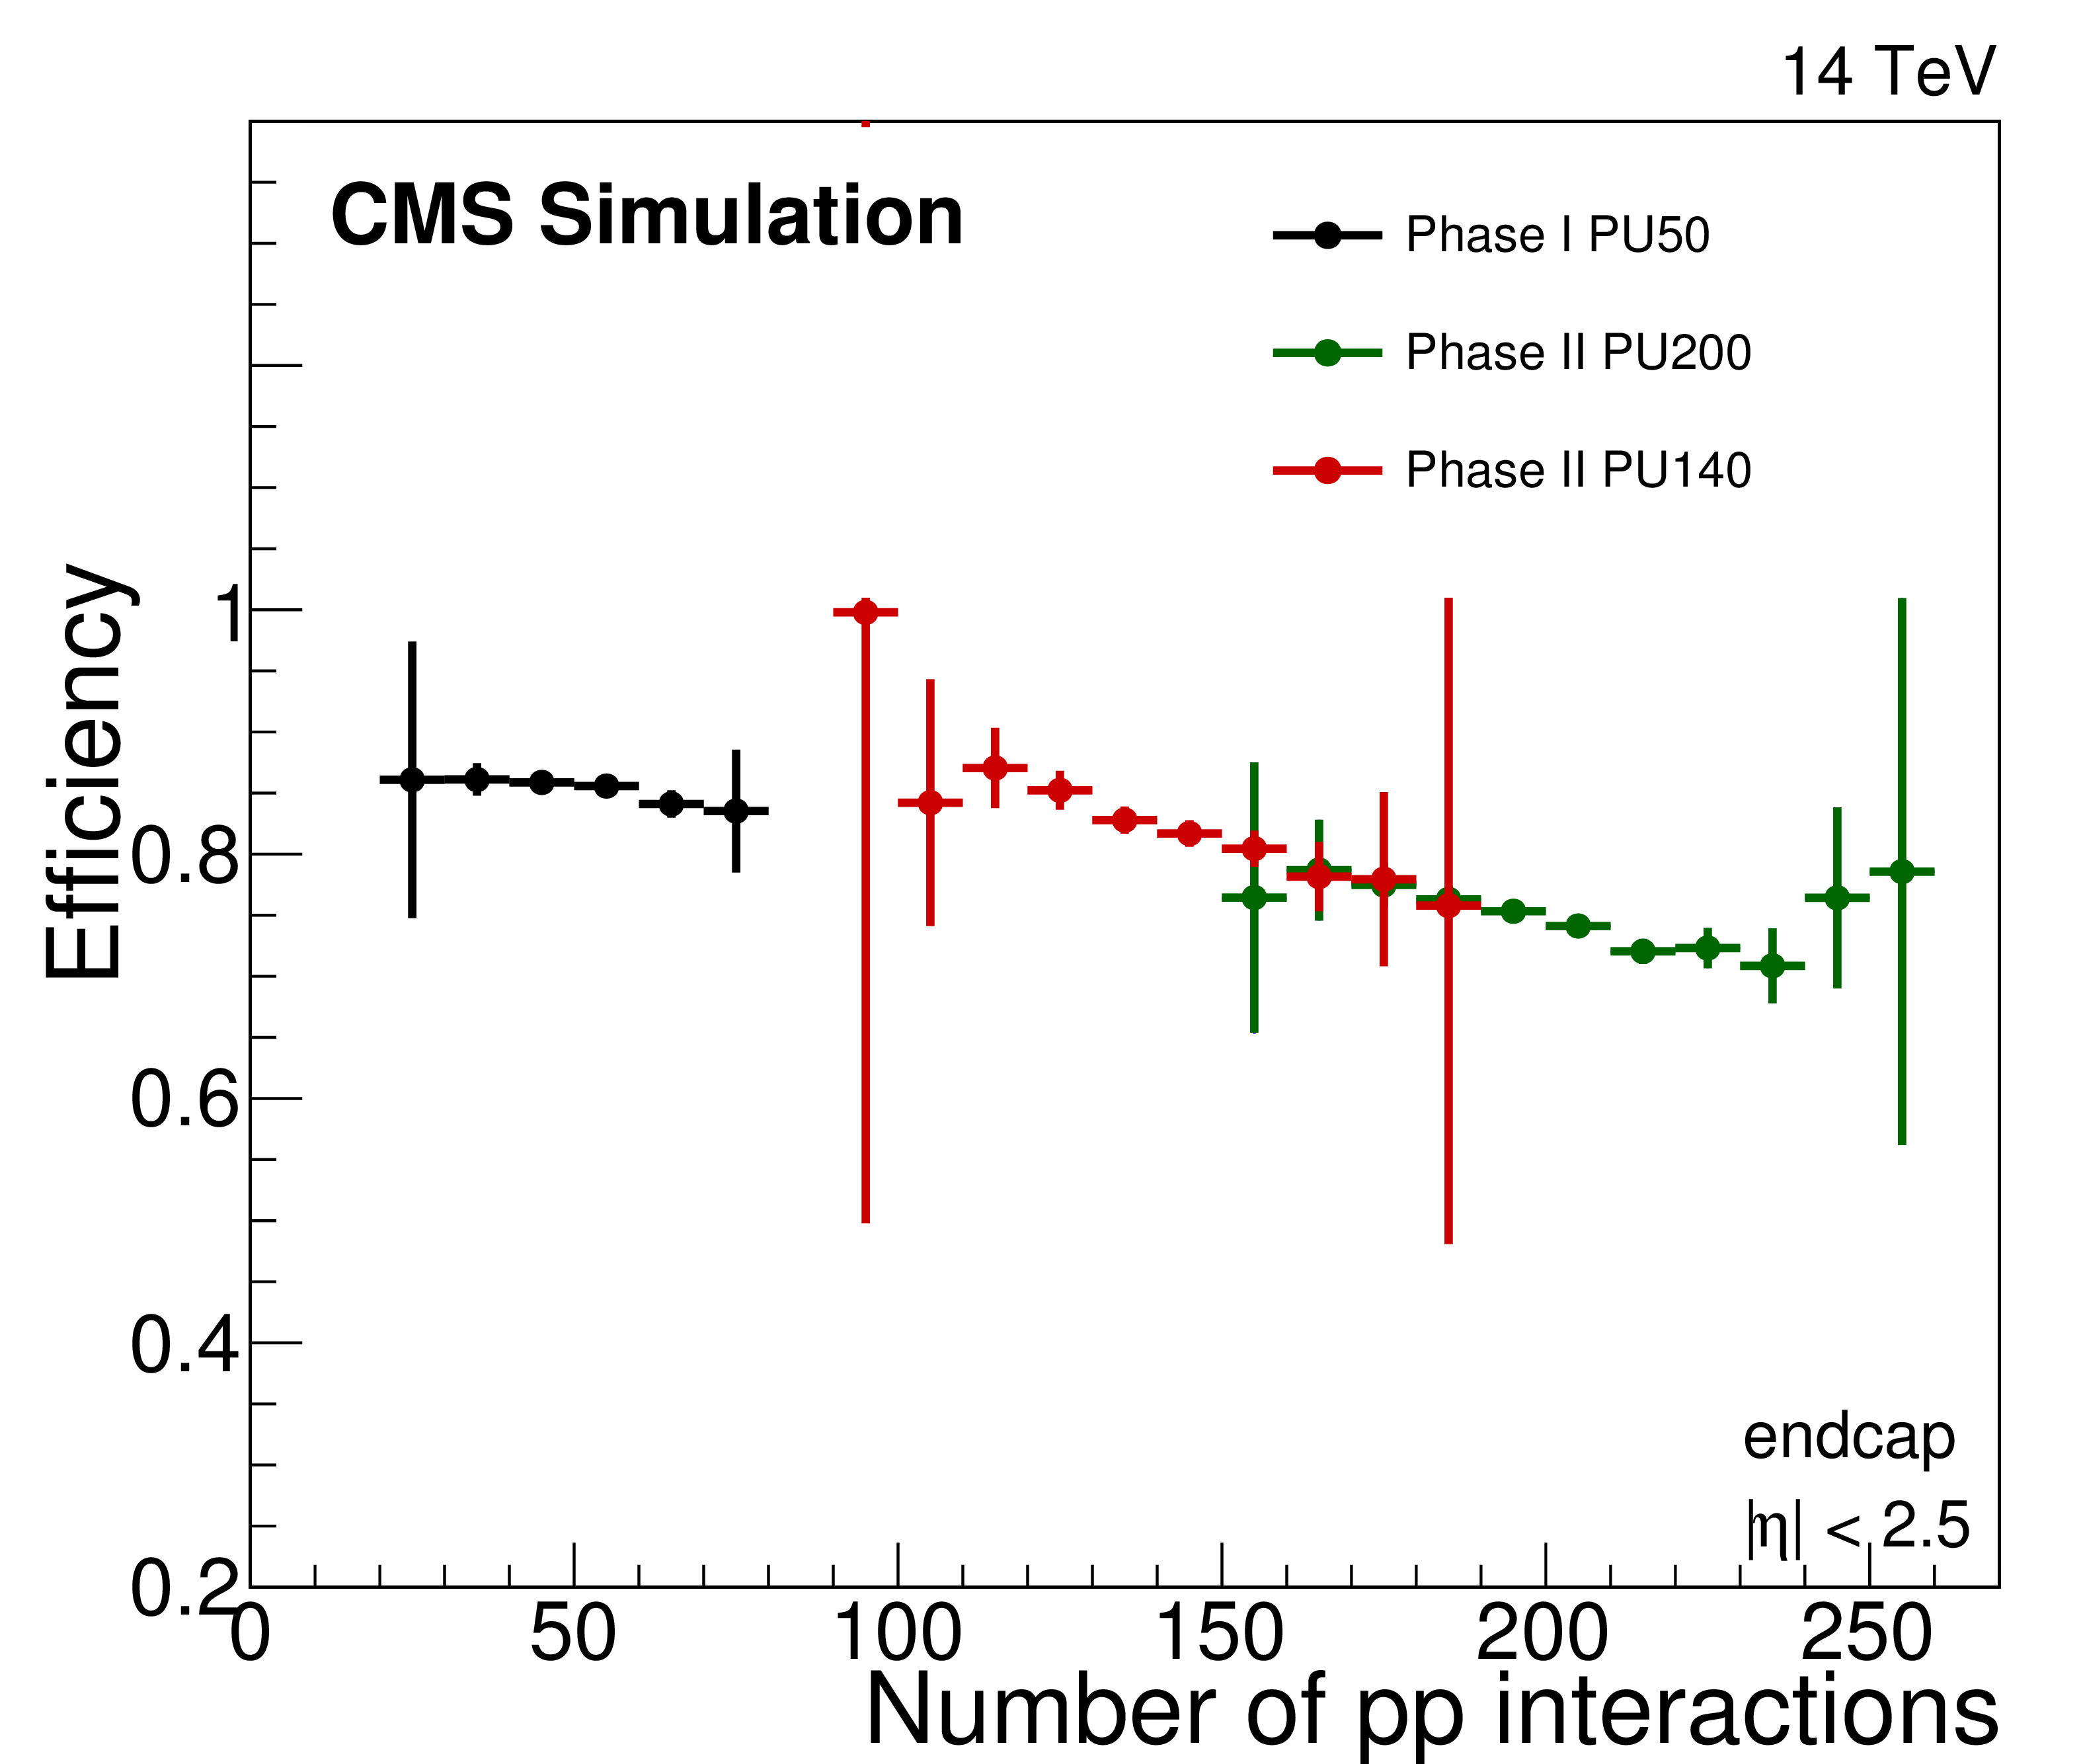
Figure 21-b:
Electron reconstruction efficiency in the barrel (left) and endcap (right) calorimeter as function of the number of pileup $<$PU$>=140$ (red) and $<$PU$>=200$ (green). Results based for the Phase I detector at $<$PU$>=50$ (black) are also shown. The efficiency is derived from simulated Drell-Yan events. |
png ; pdf ; |
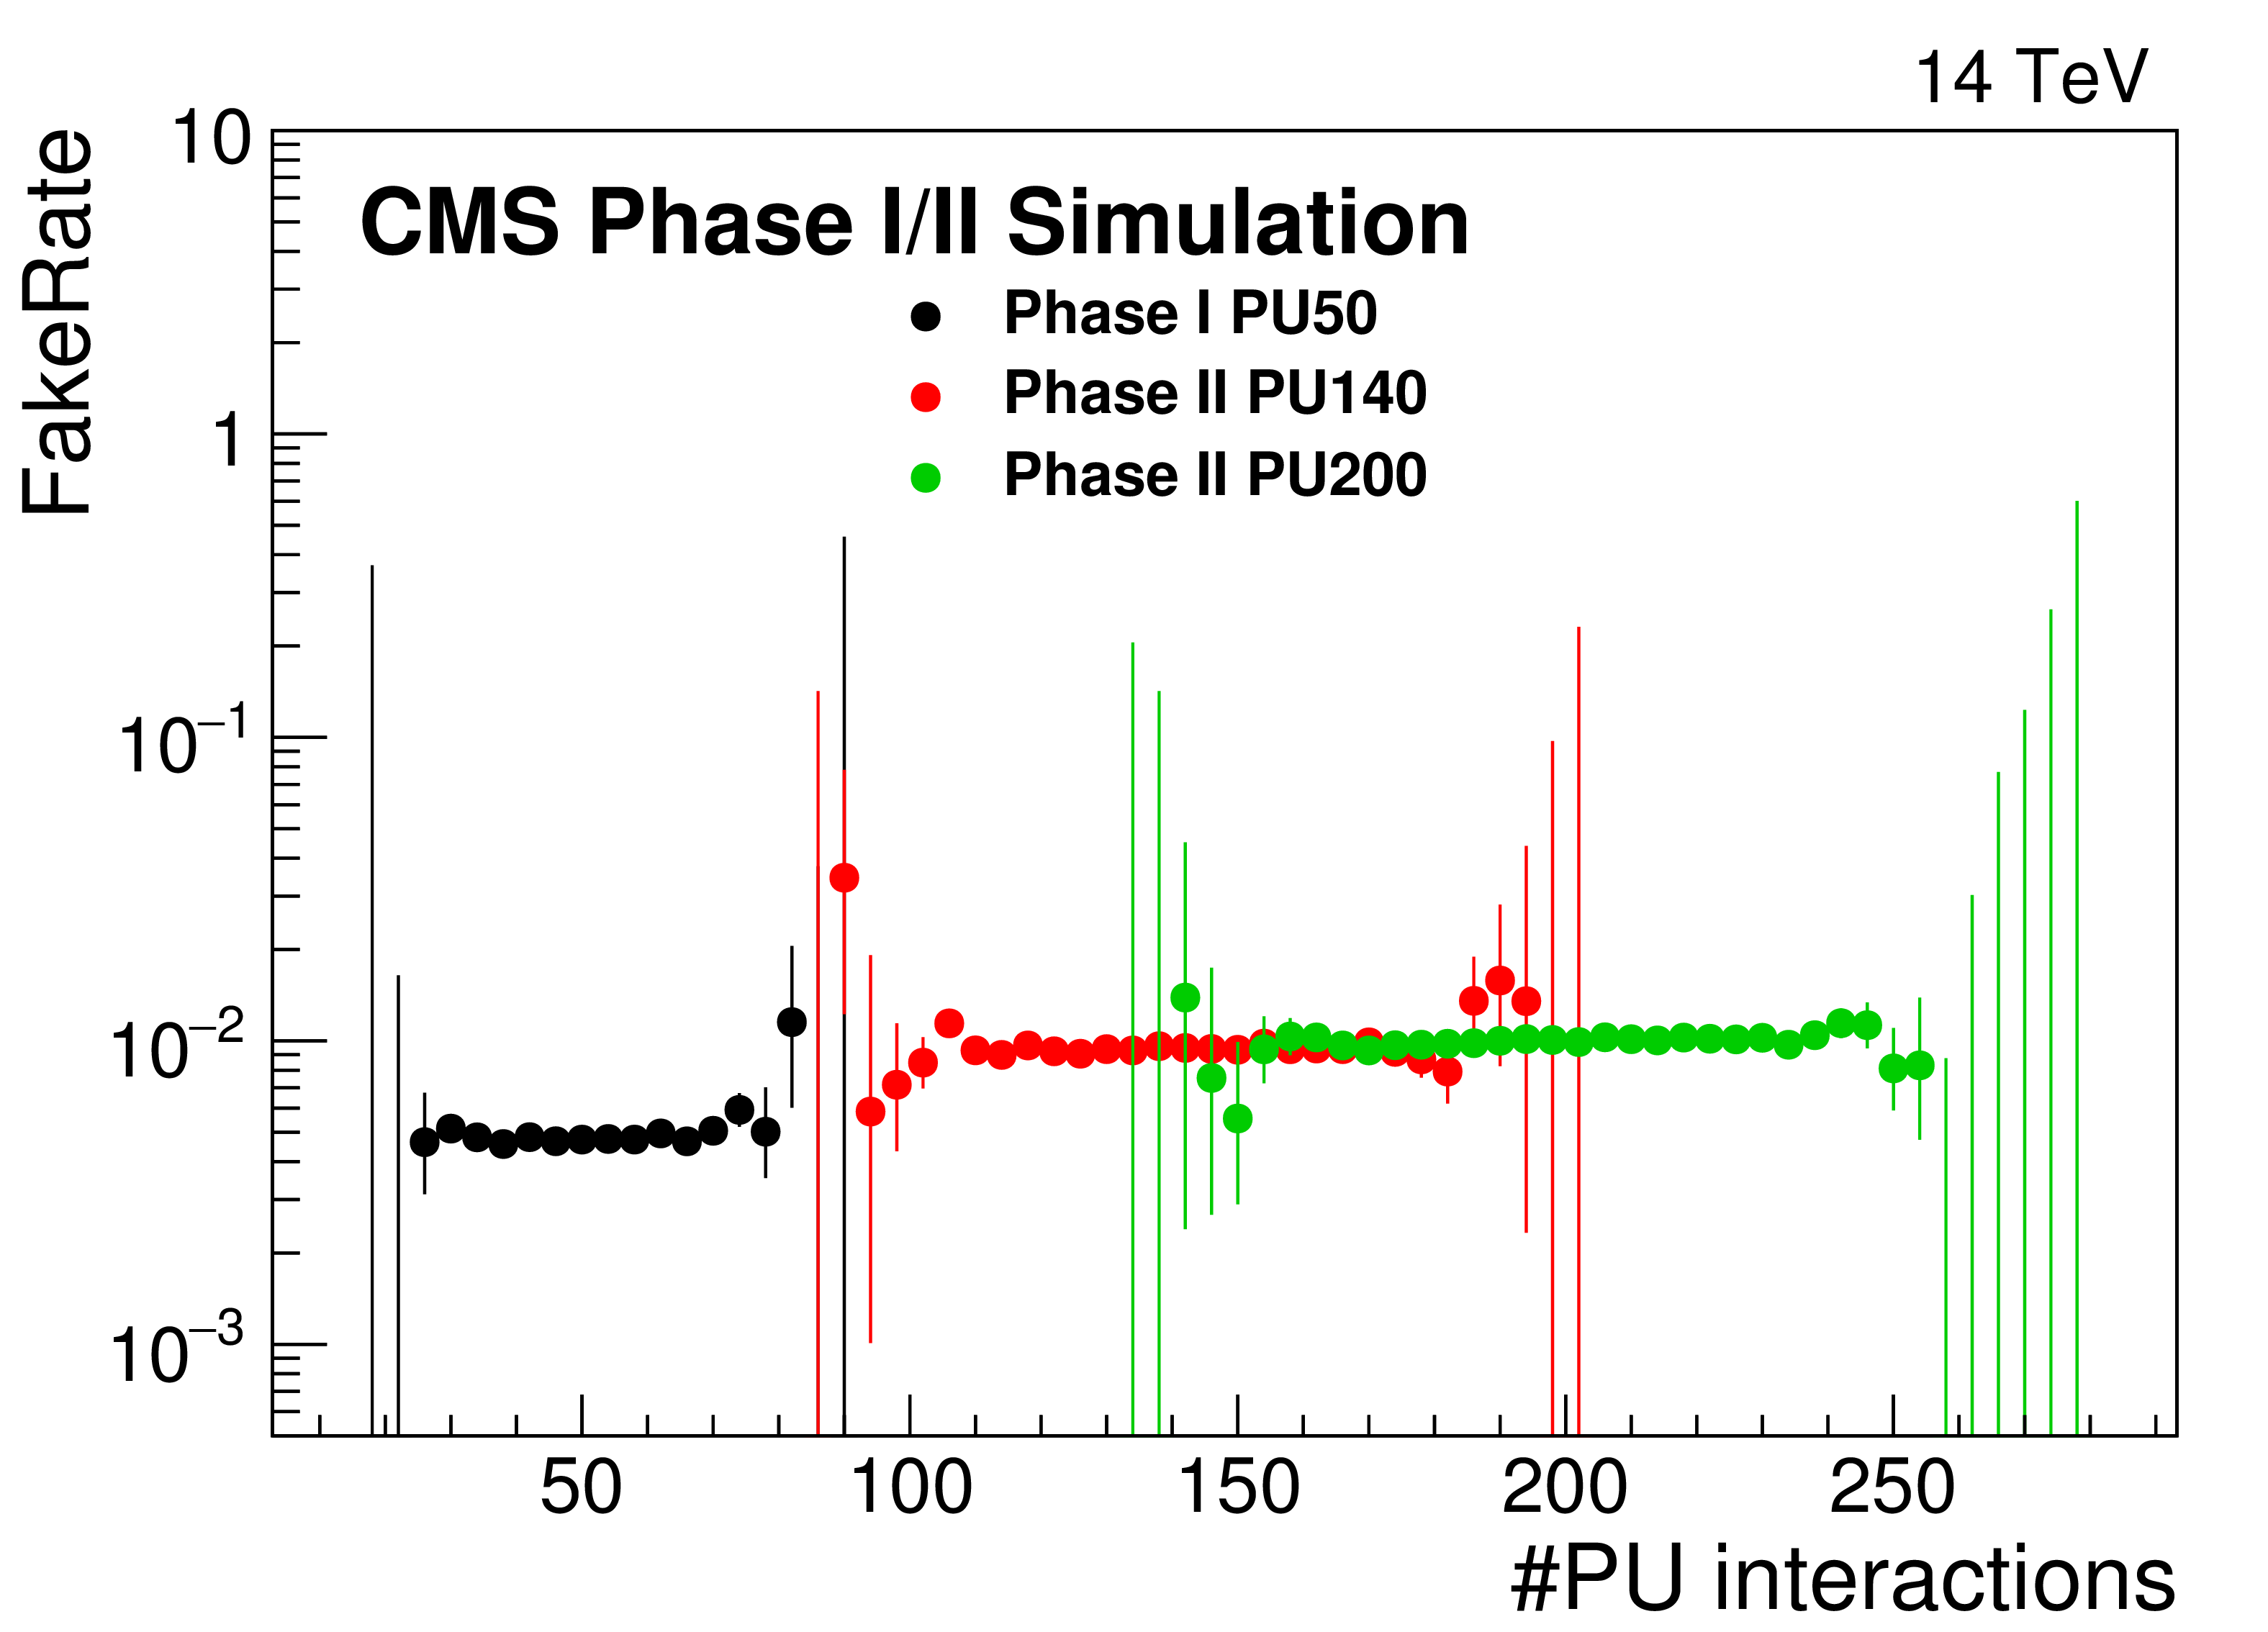
Figure 22-a:
Electron identification in the endcap calorimeter for Drell-Yan events (left) and photon selection efficiency and fake rate in bins of $|\eta |$ for samples of simulated events with a photon and a jet (right). Results are shown for reference configuration at $<$PU$>=140$ (red) and $<$PU$>=200$ (green) and Phase I configuration at $<$PU$>=50$ (black). |
png ; pdf ; |
Figure 22-b:
Electron identification in the endcap calorimeter for Drell-Yan events (left) and photon selection efficiency and fake rate in bins of $|\eta |$ for samples of simulated events with a photon and a jet (right). Results are shown for reference configuration at $<$PU$>=140$ (red) and $<$PU$>=200$ (green) and Phase I configuration at $<$PU$>=50$ (black). |
png ; pdf ; |
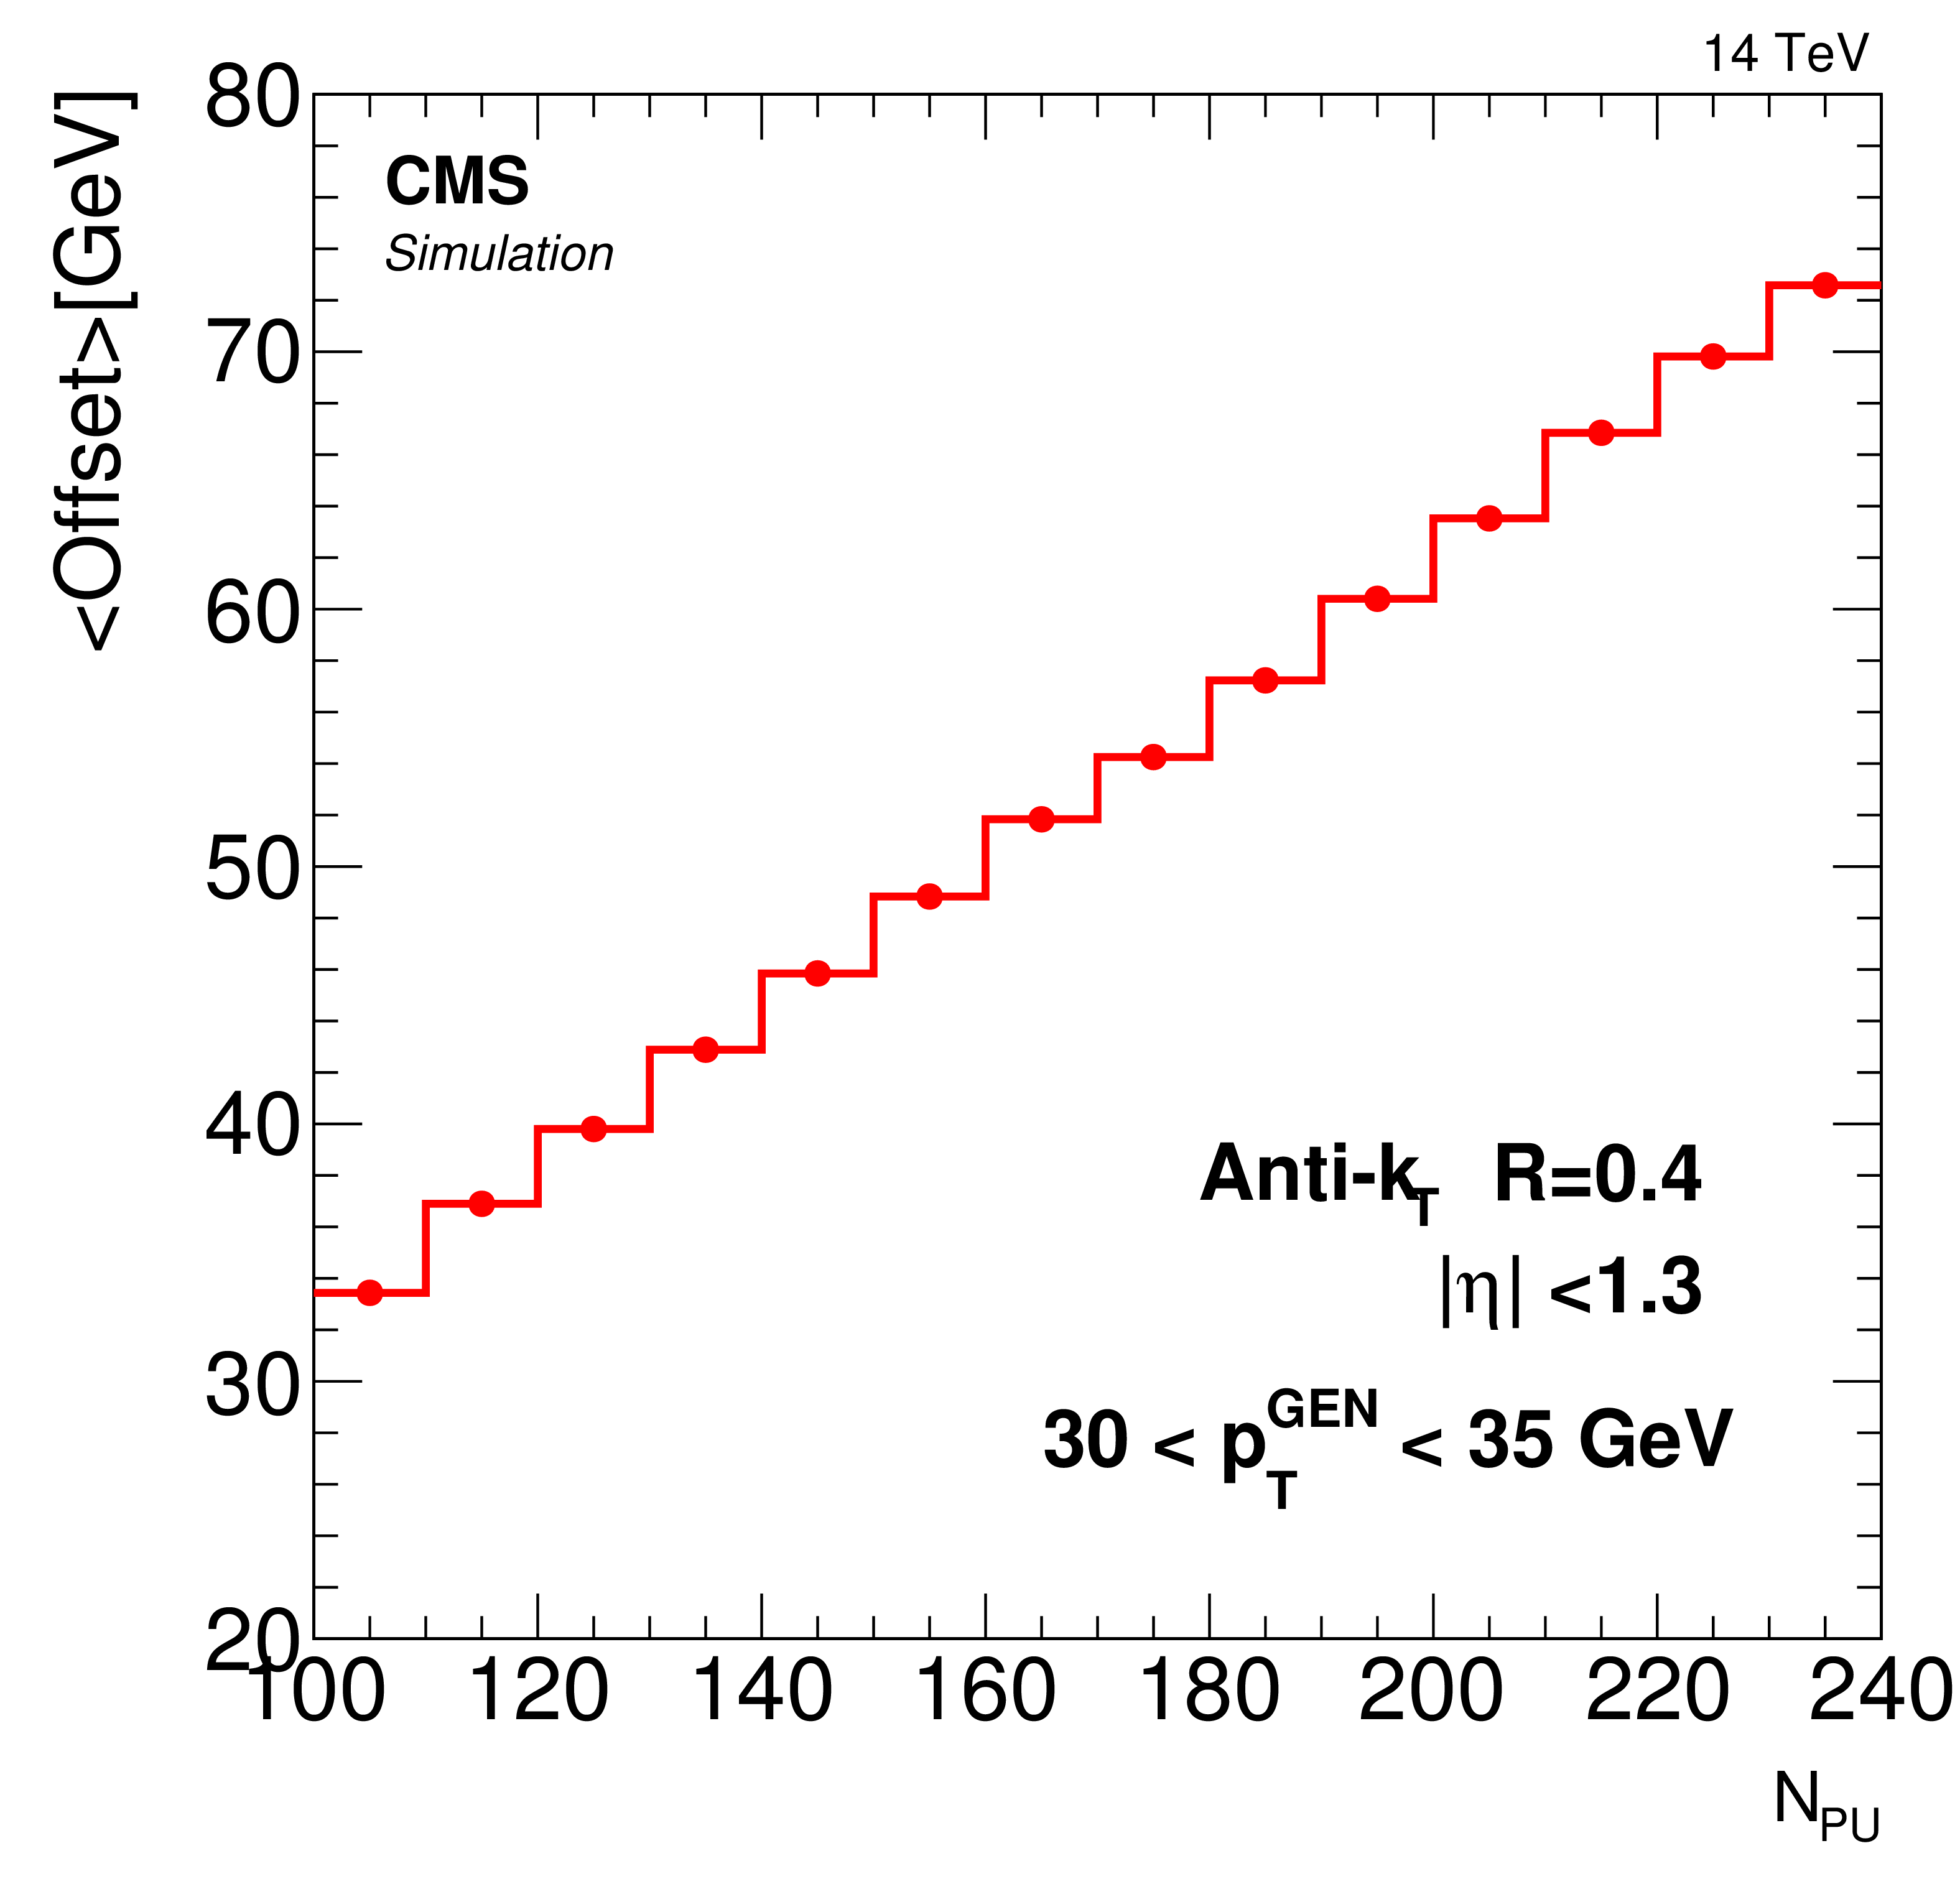
Figure 23-a:
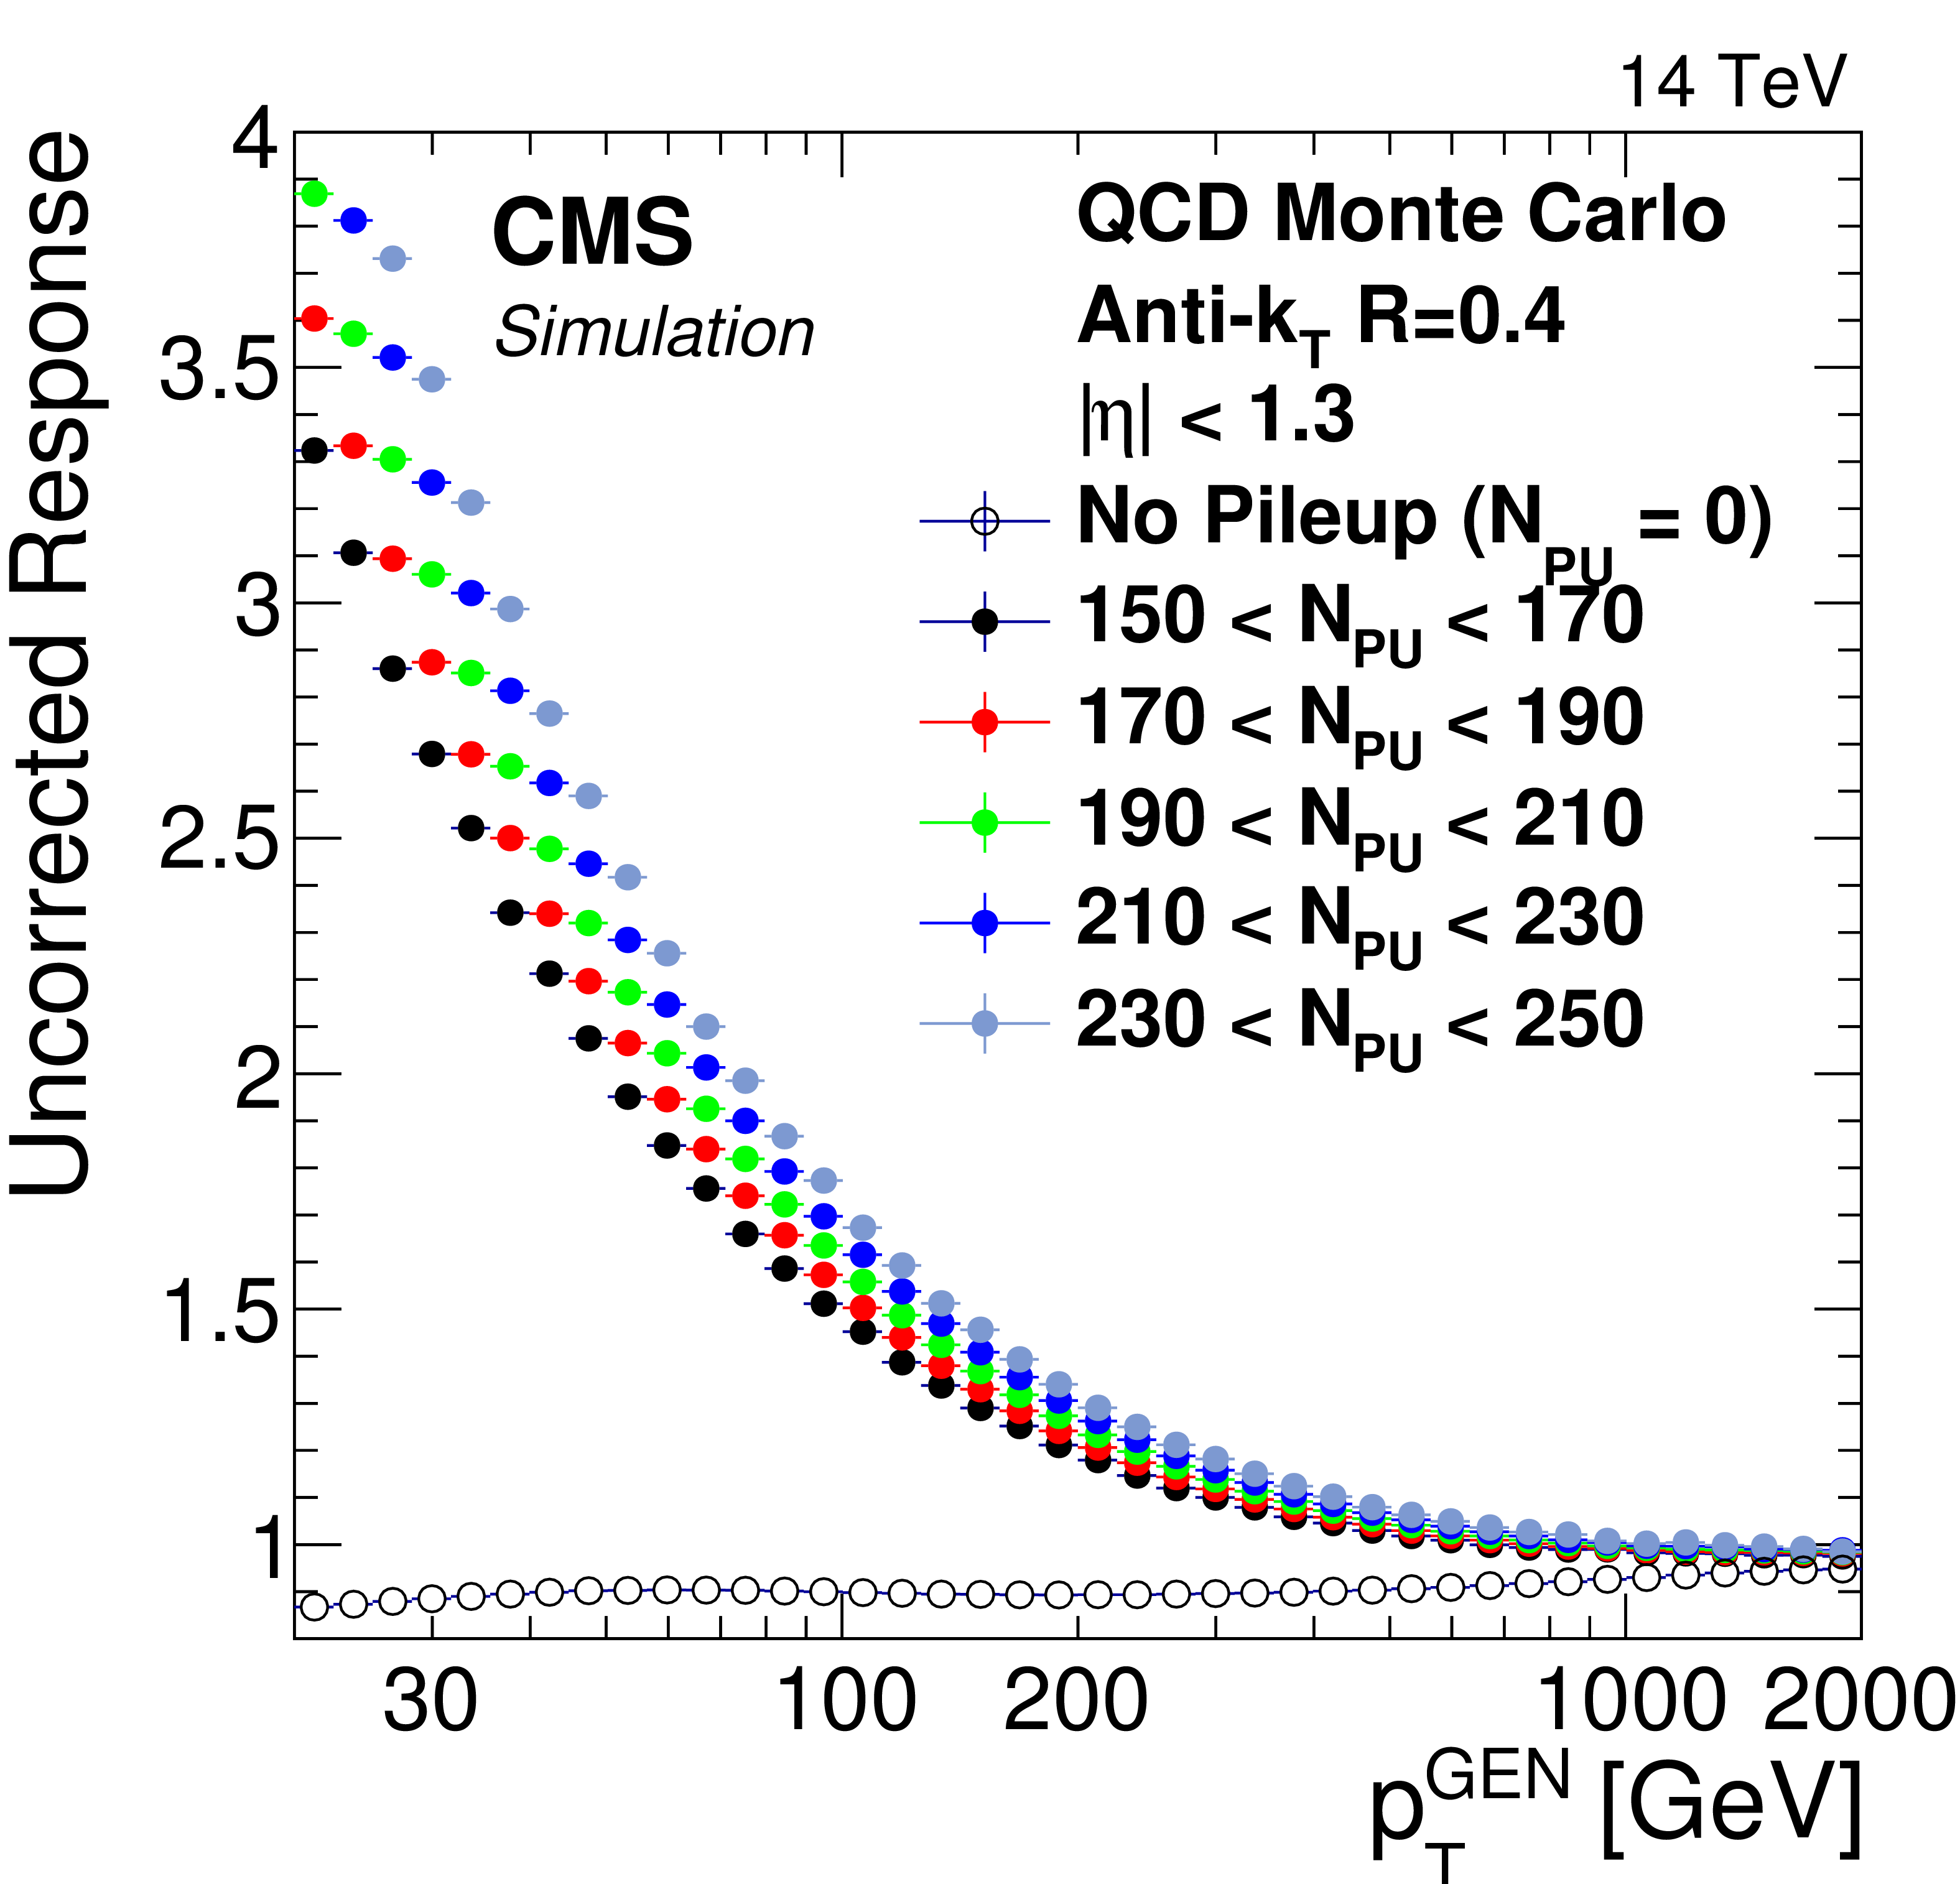
Average transverse energy added to a jet as a function of the number of pileup vertices for 30$< {p_{\mathrm {T}}} <$35 GeV (left). Response of uncorrected jets as a function of transverse momentum in the reference sample (right). |
png ; pdf ; |
Figure 23-b:
Average transverse energy added to a jet as a function of the number of pileup vertices for 30$< {p_{\mathrm {T}}} <$35 GeV (left). Response of uncorrected jets as a function of transverse momentum in the reference sample (right). |

png ; pdf ; |
Figure 24-a:
$ {E_{\mathrm {T}}^{\text {miss}}} $ distribution for the perpendicular component of hadronic recoil to Z boson, measured in $Z \rightarrow \mu \mu $, at $<$PU$>=140$ with the high-$\eta $ tracking extension (red) and $<$PU$>=200$ (green). Results for Phase I at $<$PU$>=50$ (black) are also included (left). Relative rate of additional misidentified jets as a function of pseudorapidity for different pileup configuration. Results are shown relative to the performance of the reference detector at $<$PU$>=140$ for $<$PU$>=200$ (green), and Phase I at $<$PU$>=50$ (black) (right). |
png ; pdf ; |
Figure 24-b:
$ {E_{\mathrm {T}}^{\text {miss}}} $ distribution for the perpendicular component of hadronic recoil to Z boson, measured in $Z \rightarrow \mu \mu $, at $<$PU$>=140$ with the high-$\eta $ tracking extension (red) and $<$PU$>=200$ (green). Results for Phase I at $<$PU$>=50$ (black) are also included (left). Relative rate of additional misidentified jets as a function of pseudorapidity for different pileup configuration. Results are shown relative to the performance of the reference detector at $<$PU$>=140$ for $<$PU$>=200$ (green), and Phase I at $<$PU$>=50$ (black) (right). |
png ; pdf ; |
Figure 25:
Effect of detector pileup on the sensitivity for the SUSY search for the $W^{\pm }$H$+ {E_{\mathrm {T}}^{\text {miss}}} $ final states. The estimated effect of the degradation of $ {E_{\mathrm {T}}^{\text {miss}}} $ resolution has been applied. |
png ; pdf ; |
Figure 26:
Outline of the Phase II Timeline. Each project will include a detailed schedule in its respective TDR. |

png ; pdf ; |
Figure 27:
Anticipated CORE cost profile with the installation occurring during LS3 in 2024-2026. |
png ; pdf ; |
Figure 28:
Timeline of the CMS Phase II Tracker upgrade |
png ; pdf ; |
Figure 29:
Timeline of the CMS Phase II barrel Calorimeters upgrades |

png ; pdf ; |
Figure 30:
Timeline of the CMS Phase II Endcap Calorimeter upgrades |
png ; pdf ; |
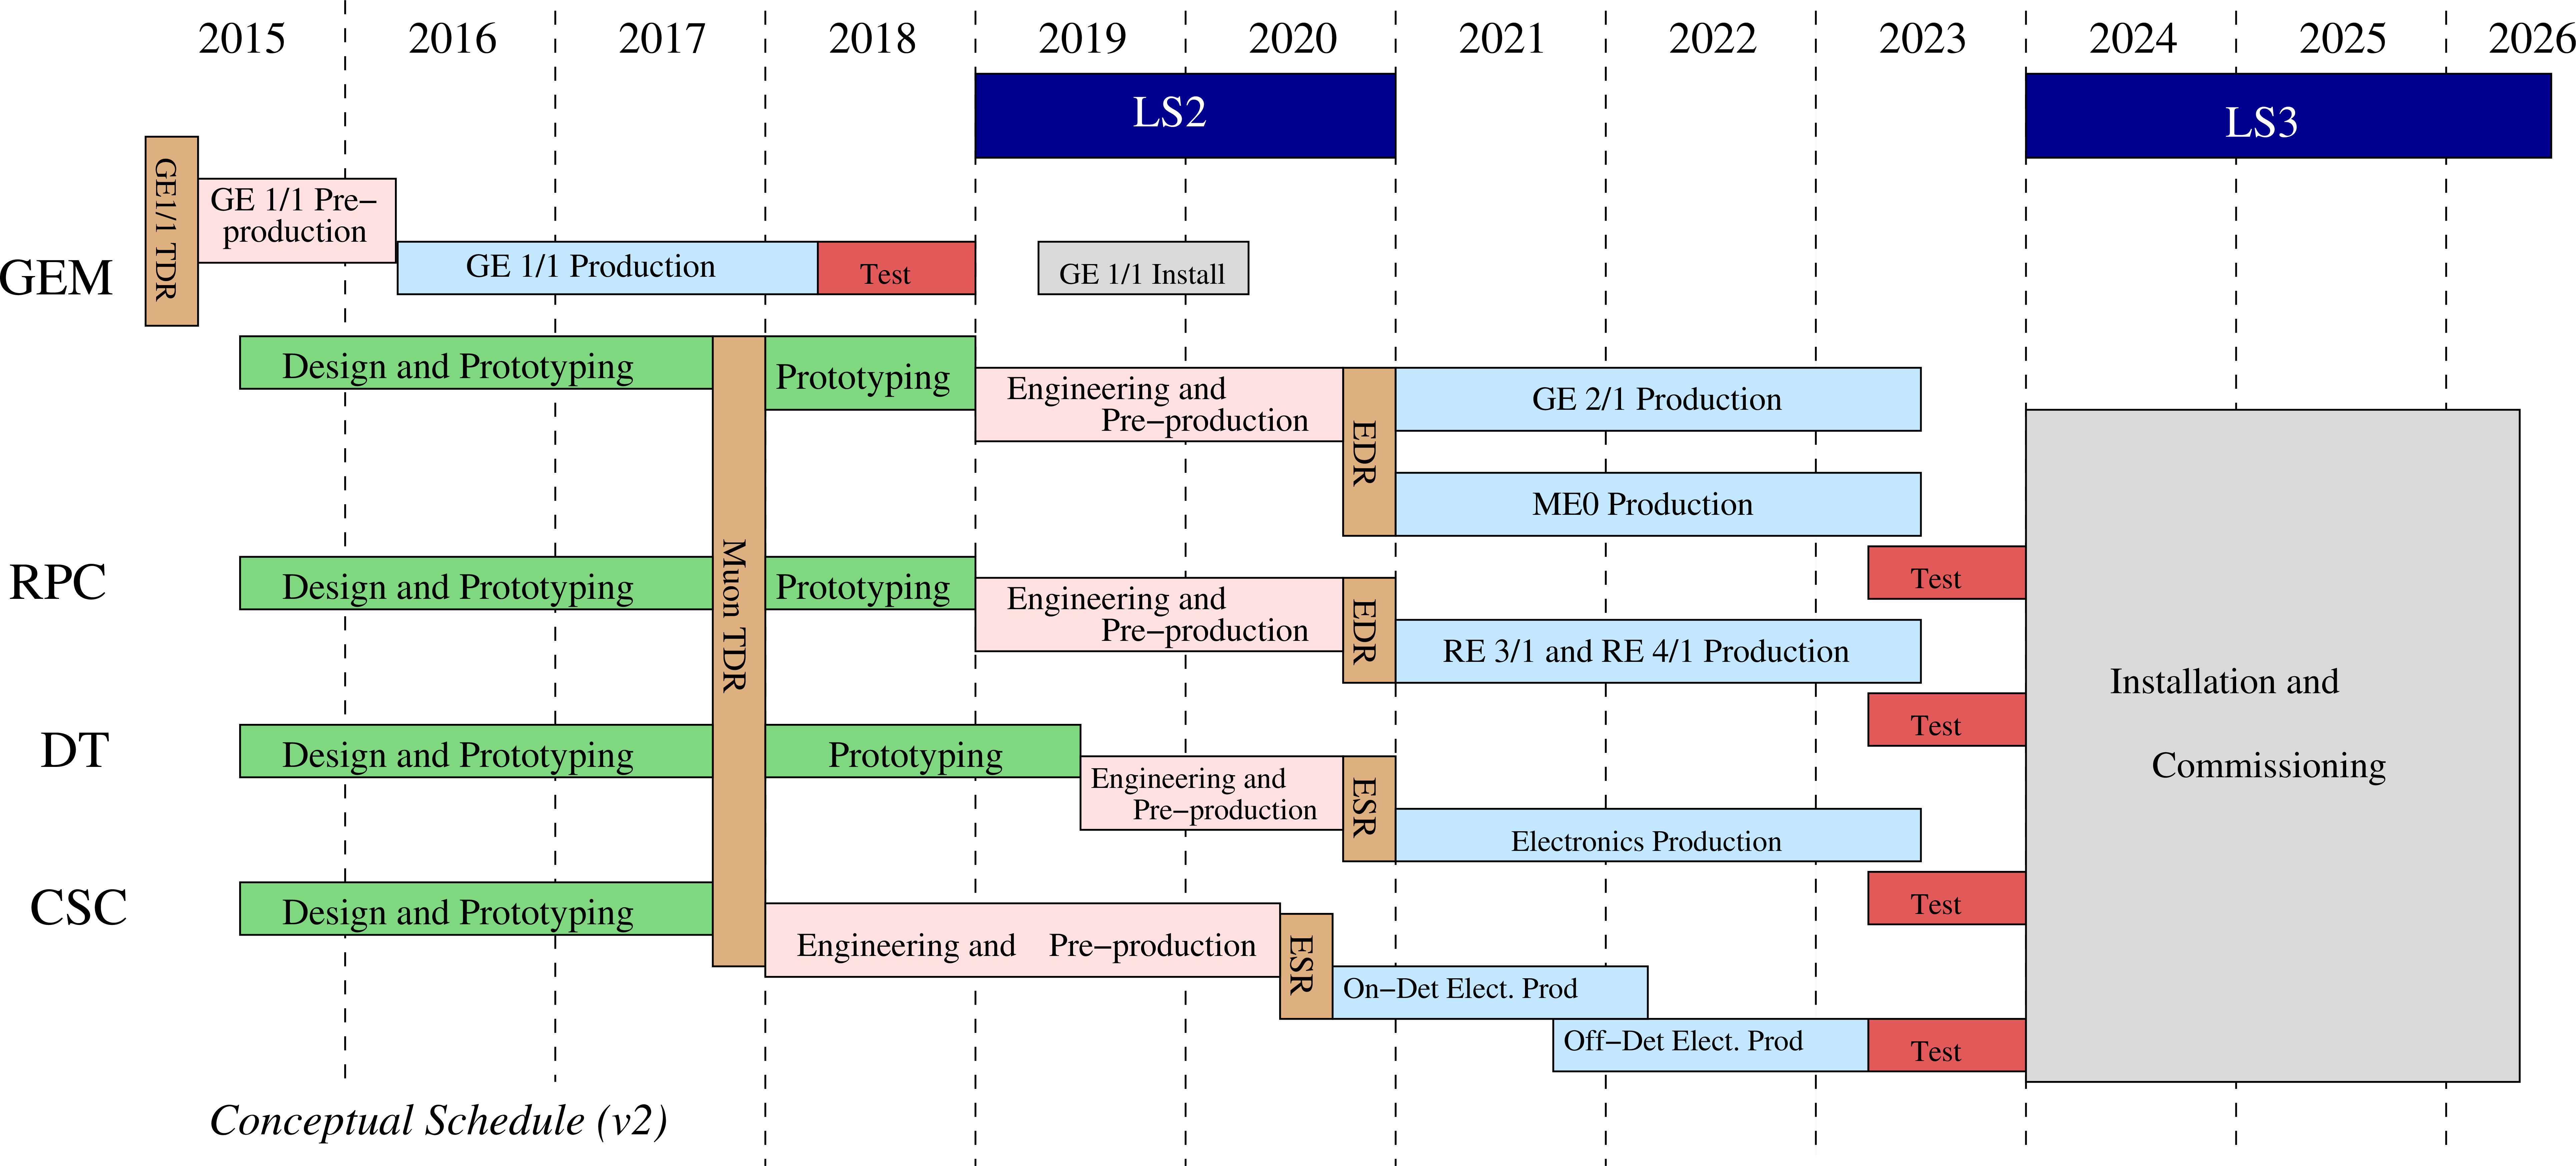
Figure 31:
Timeline of the CMS Phase II Muon system upgrades |
png ; pdf ; |
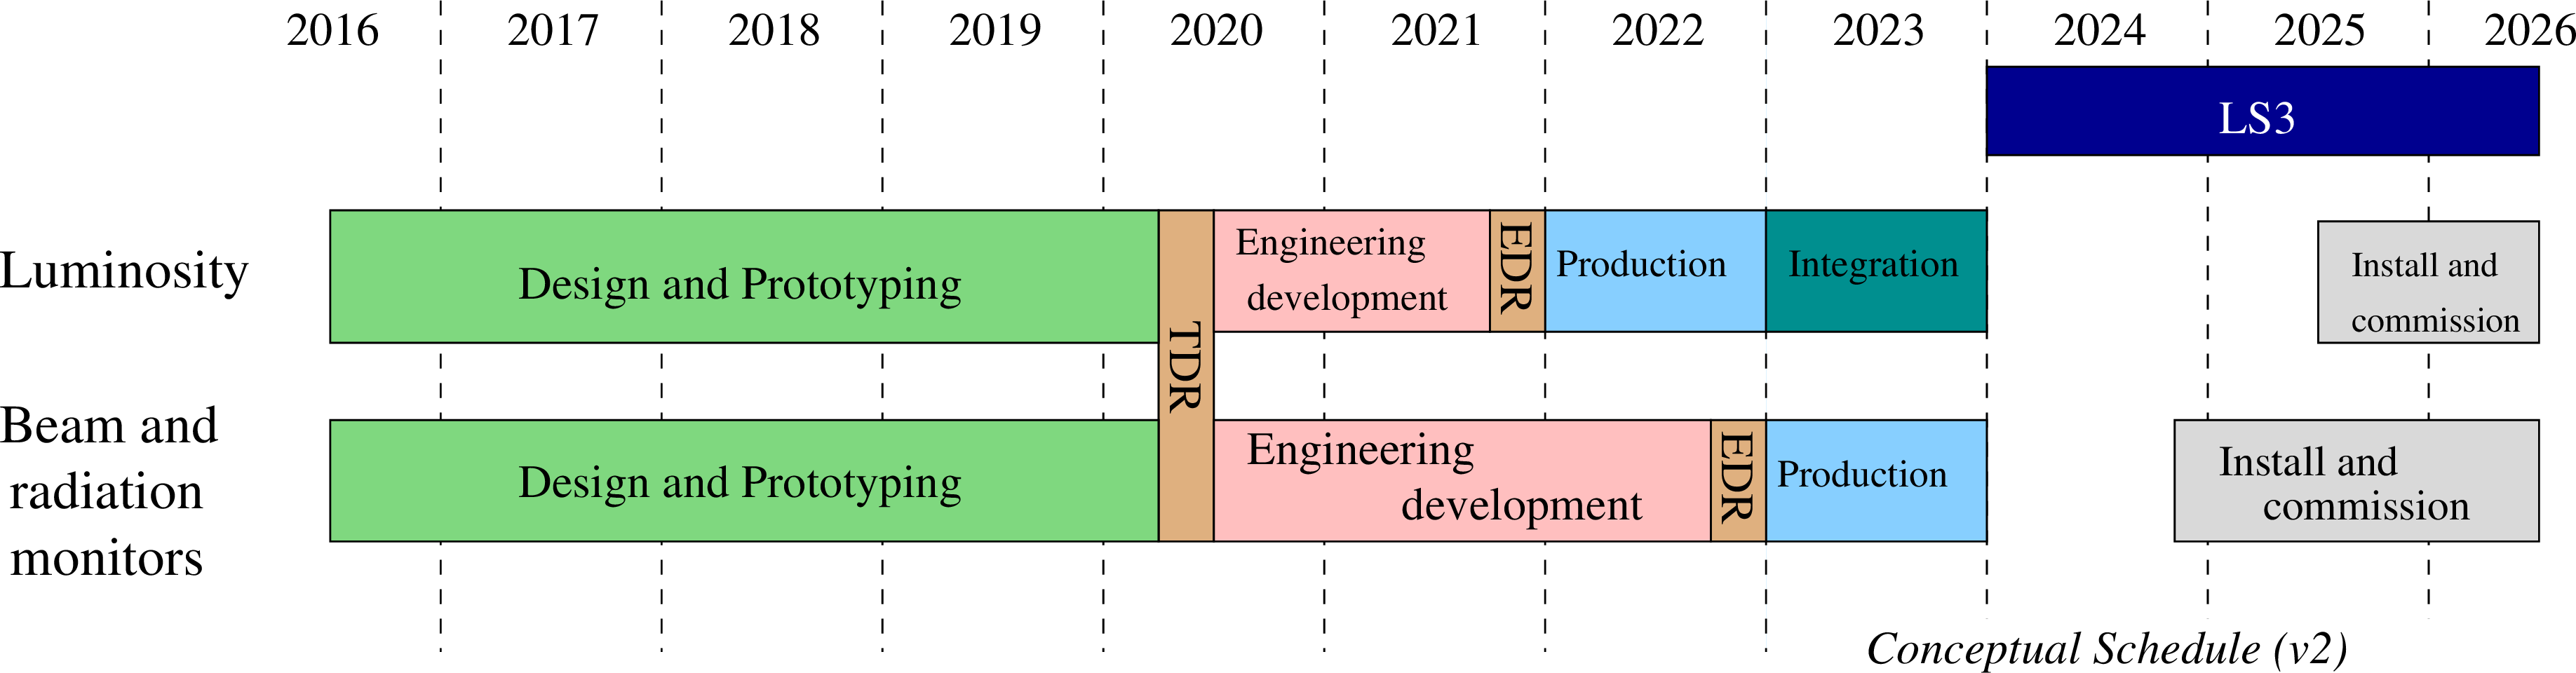
Figure 32:
Timeline of the CMS Phase II BRIL upgrades |

png ; pdf ; |
Figure 33:
Timeline of the CMS Phase II Trigger and DAQ upgrades |
|
|
Compact Muon Solenoid LHC, CERN |
|

|

|

|

|

|