

Compact Muon Solenoid
LHC, CERN
| CMS-B2G-13-008 ; CERN-PH-EP-2015-126 | ||
| Search for resonant $\mathrm{ t \bar{t} }$ production in proton-proton collisions at $\sqrt{s} =$ 8 TeV | ||
| CMS Collaboration | ||
| 8 June 2015 | ||
| Phys. Rev. D 93 (2016) 012001 | ||
|
Abstract:
A search is performed for the production of heavy resonances decaying into top-antitop quark pairs in proton-proton collisions at $\sqrt{s} = $ 8 TeV. Data used for the analyses were collected with the CMS detector and correspond to an integrated luminosity of 19.7 fb$^{-1}$. The search is performed using events with three different final states, defined by the number of leptons (electrons and muons) from the $\mathrm{ t \bar{t} \to W b W b }$ decay. The analyses are optimized for reconstruction of top quarks with high Lorentz boosts, where jet substructure techniques are used to enhance the sensitivity. Results are presented for all channels and a combination is performed. No significant excess of events relative to the expected yield from standard model processes is observed. Upper limits on the production cross section of heavy resonances decaying to $\mathrm{ t \bar{t} }$ are calculated. A narrow leptophobic topcolor Z' resonance with a mass below 2.4 TeV is excluded at 95% confidence level. Limits are also derived for a broad Z' resonance with a 10% width relative to the resonance mass, and a Kaluza--Klein excitation of the gluon in the Randall--Sundrum model. These are the most stringent limits to date on heavy resonances decaying into top-antitop quark pairs. | ||
| Links: e-print arXiv:1506.03062 [hep-ex] (PDF) ; CDS record ; inSPIRE record ; CADI line (restricted) ; | ||
| Figures | |
png pdf |
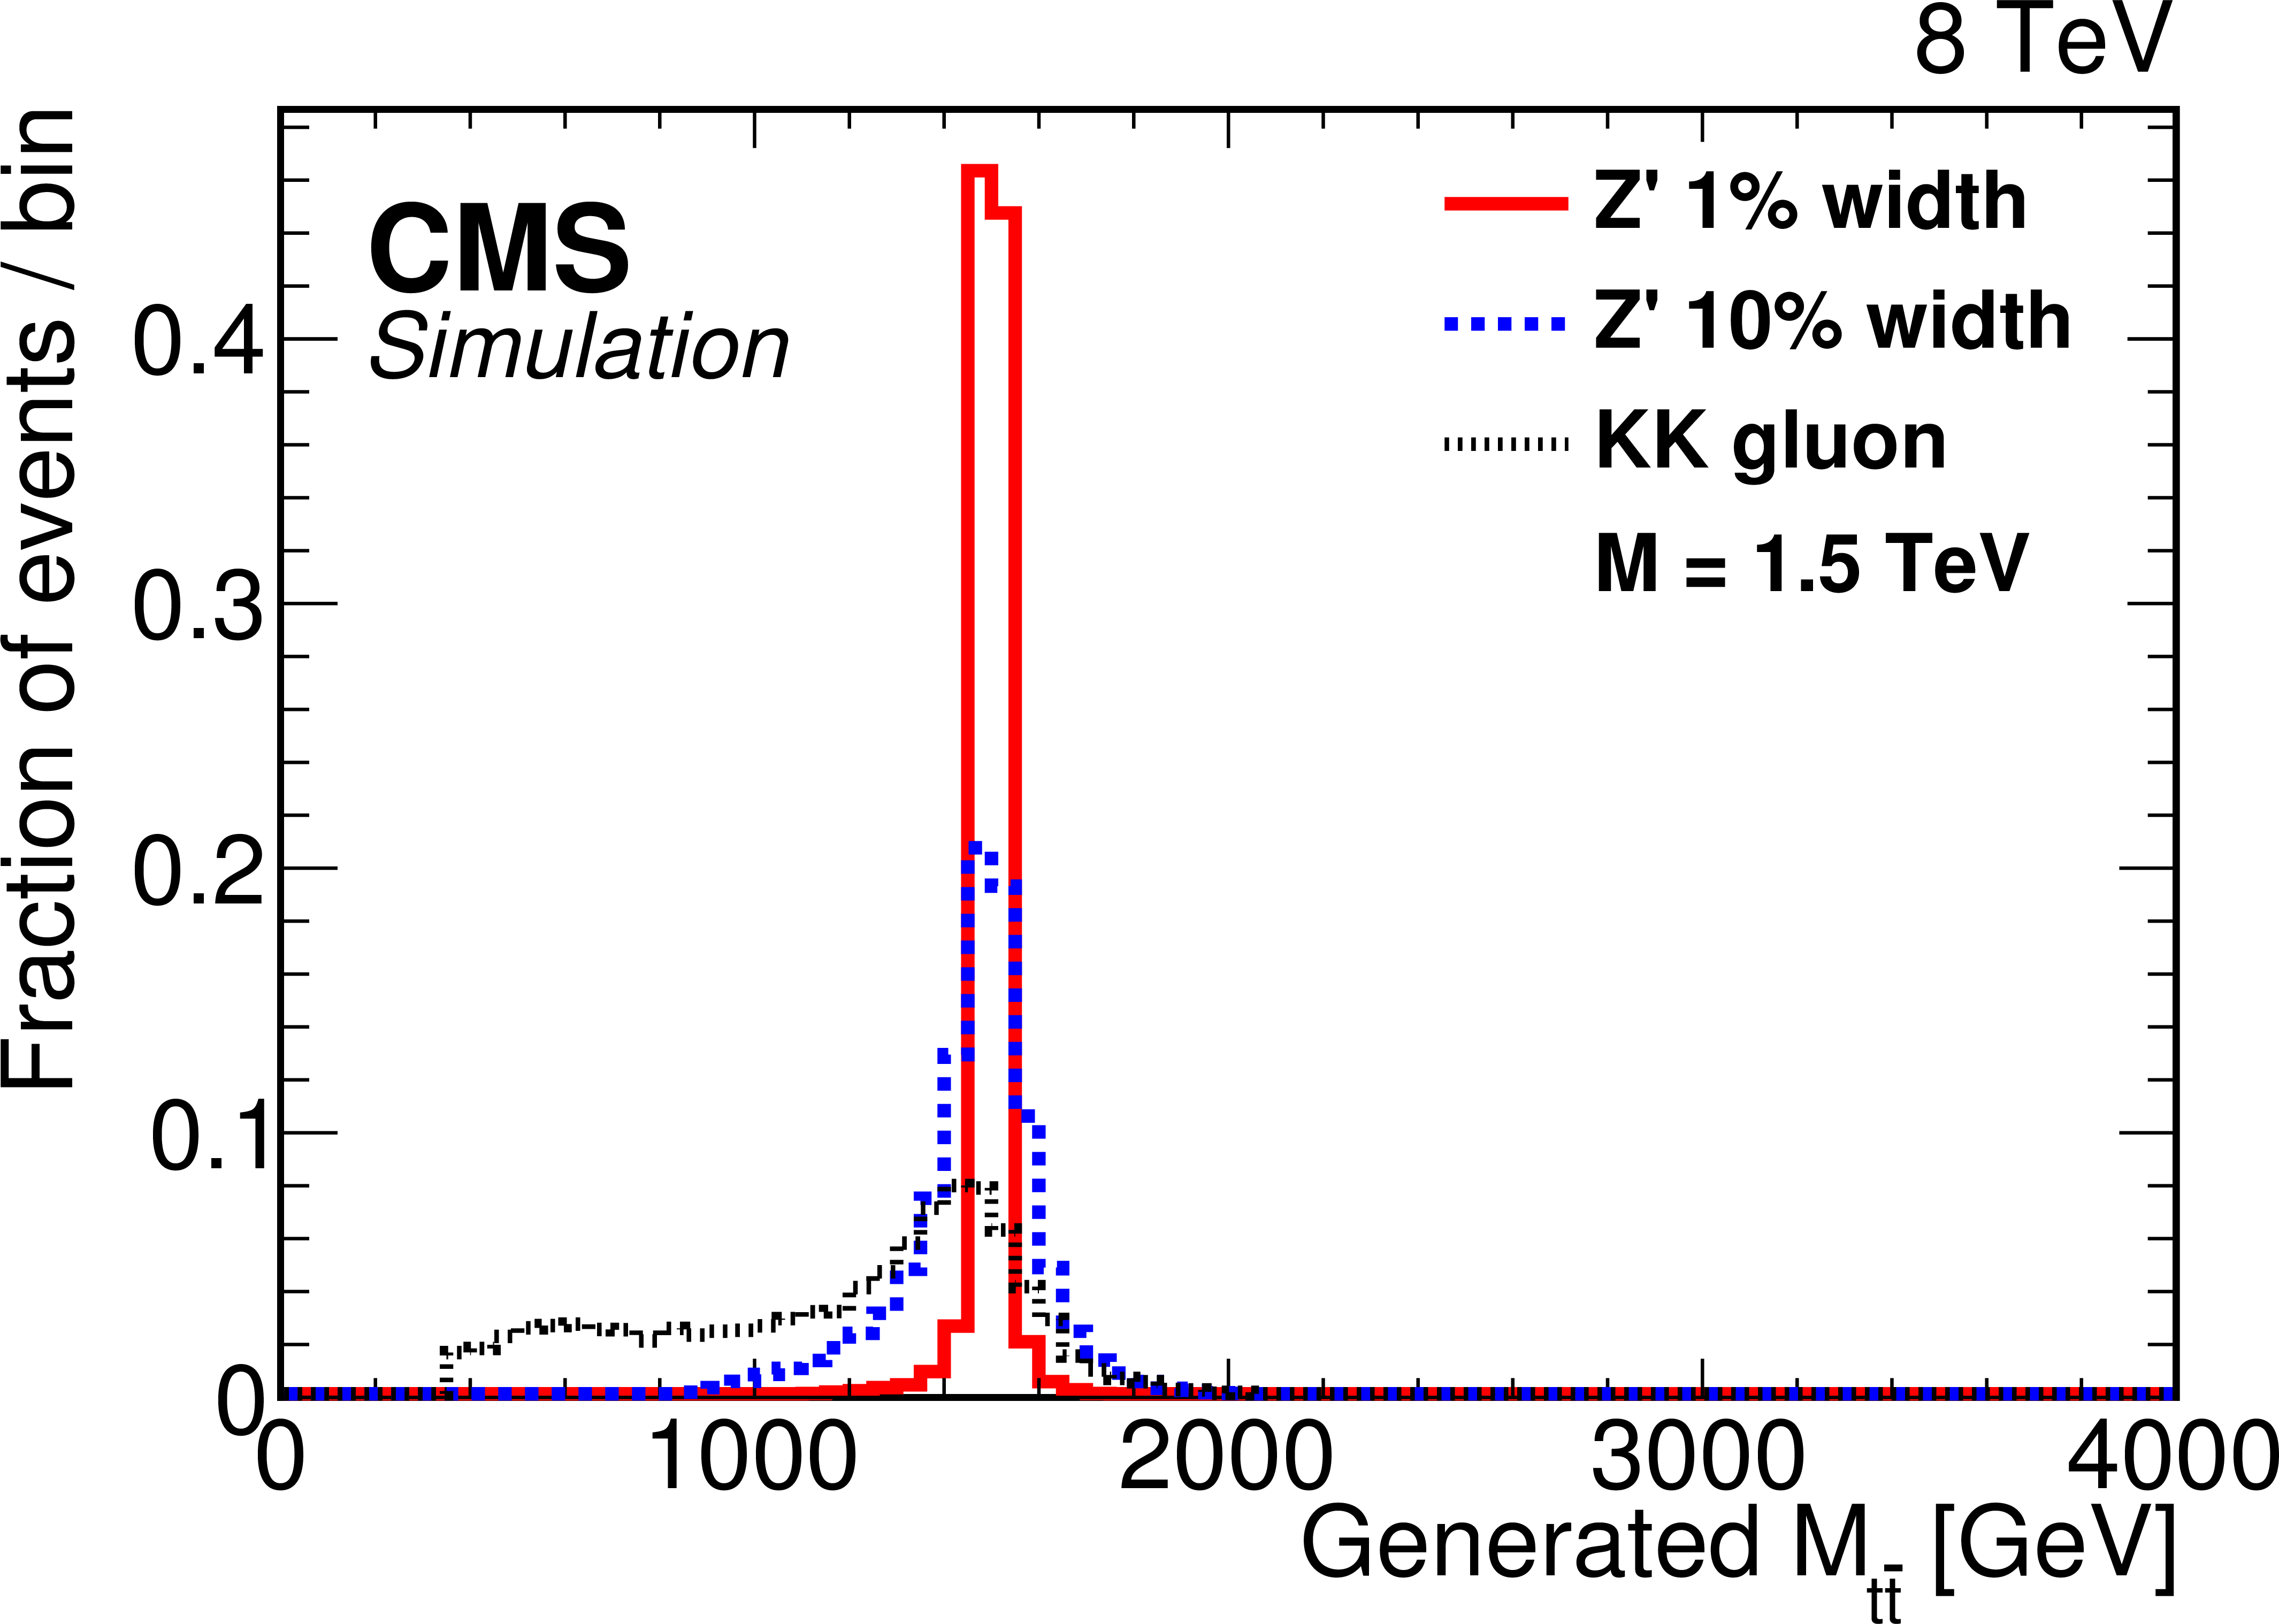
Figure 1-a:
The invariant mass distributions for different signal models, as described in the text, for (a) 1.5 TeV and (b) 3 TeV masses. The narrow Z' is shown with a solid line, the wide Z' is shown with a dashed line, and the KK gluon is shown with a dotted line. |
png pdf |
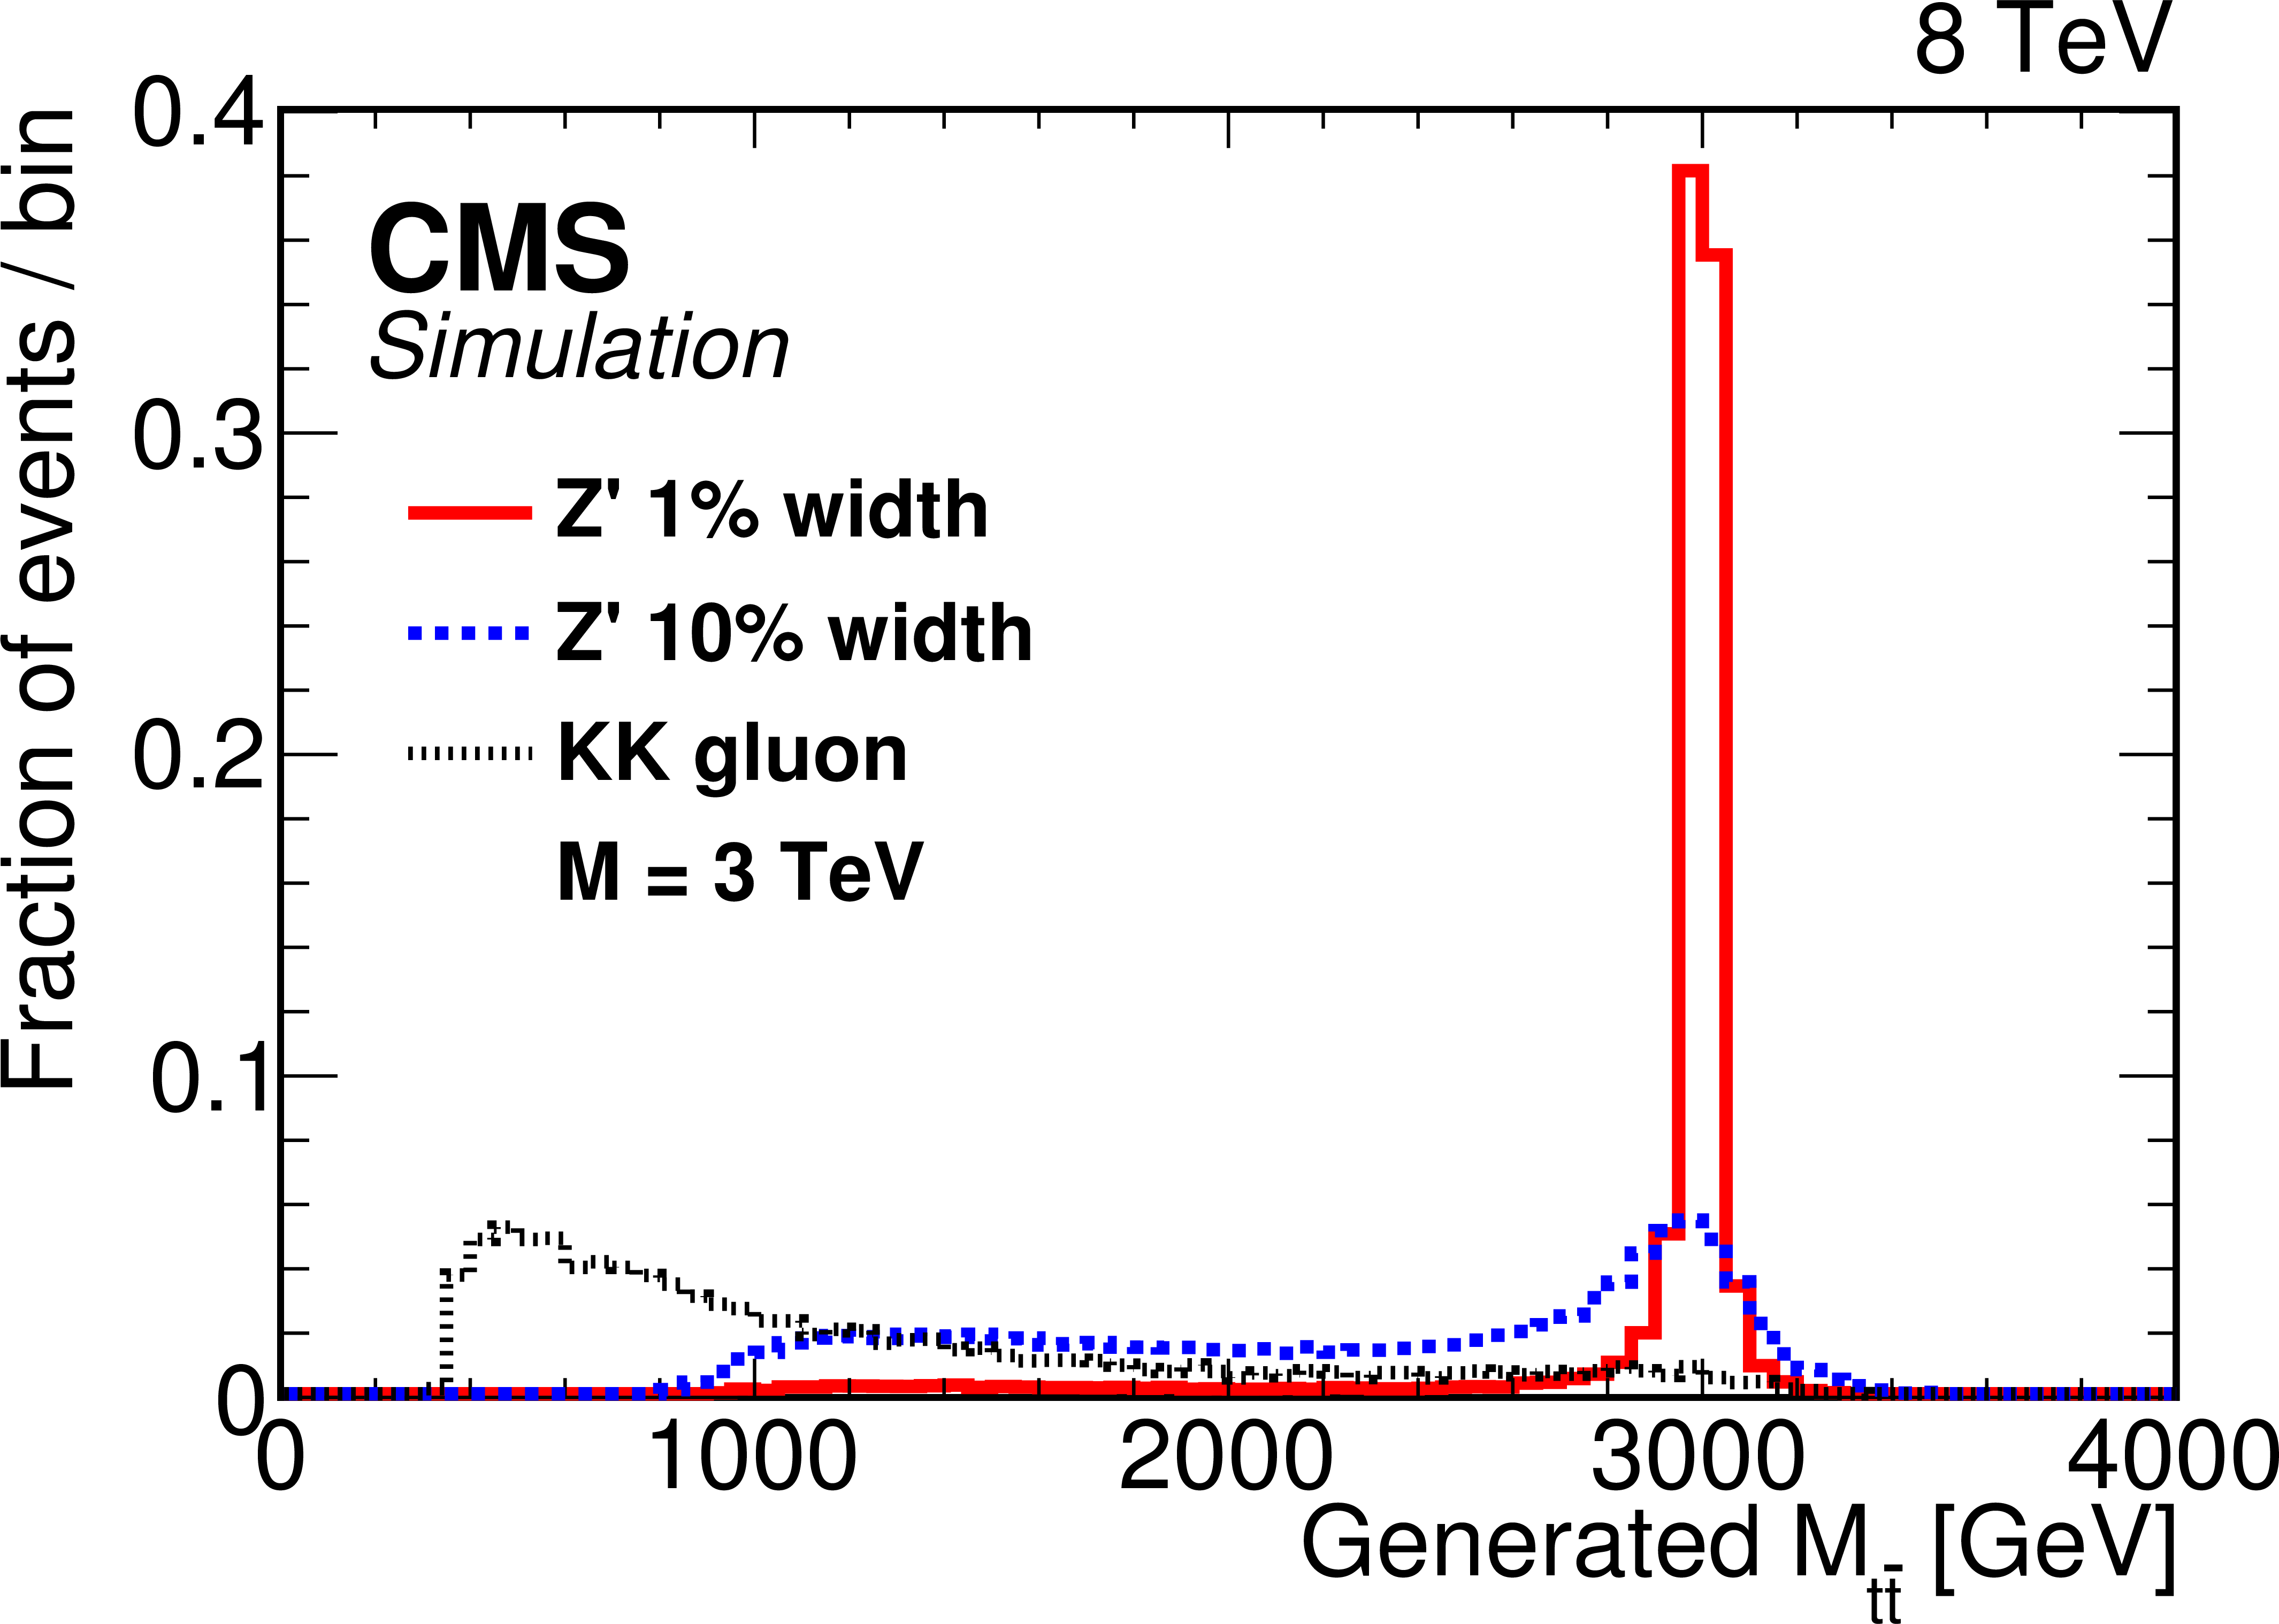
Figure 1-b:
The invariant mass distributions for different signal models, as described in the text, for (a) 1.5 TeV and (b) 3 TeV masses. The narrow Z' is shown with a solid line, the wide Z' is shown with a dashed line, and the KK gluon is shown with a dotted line. |
png pdf |
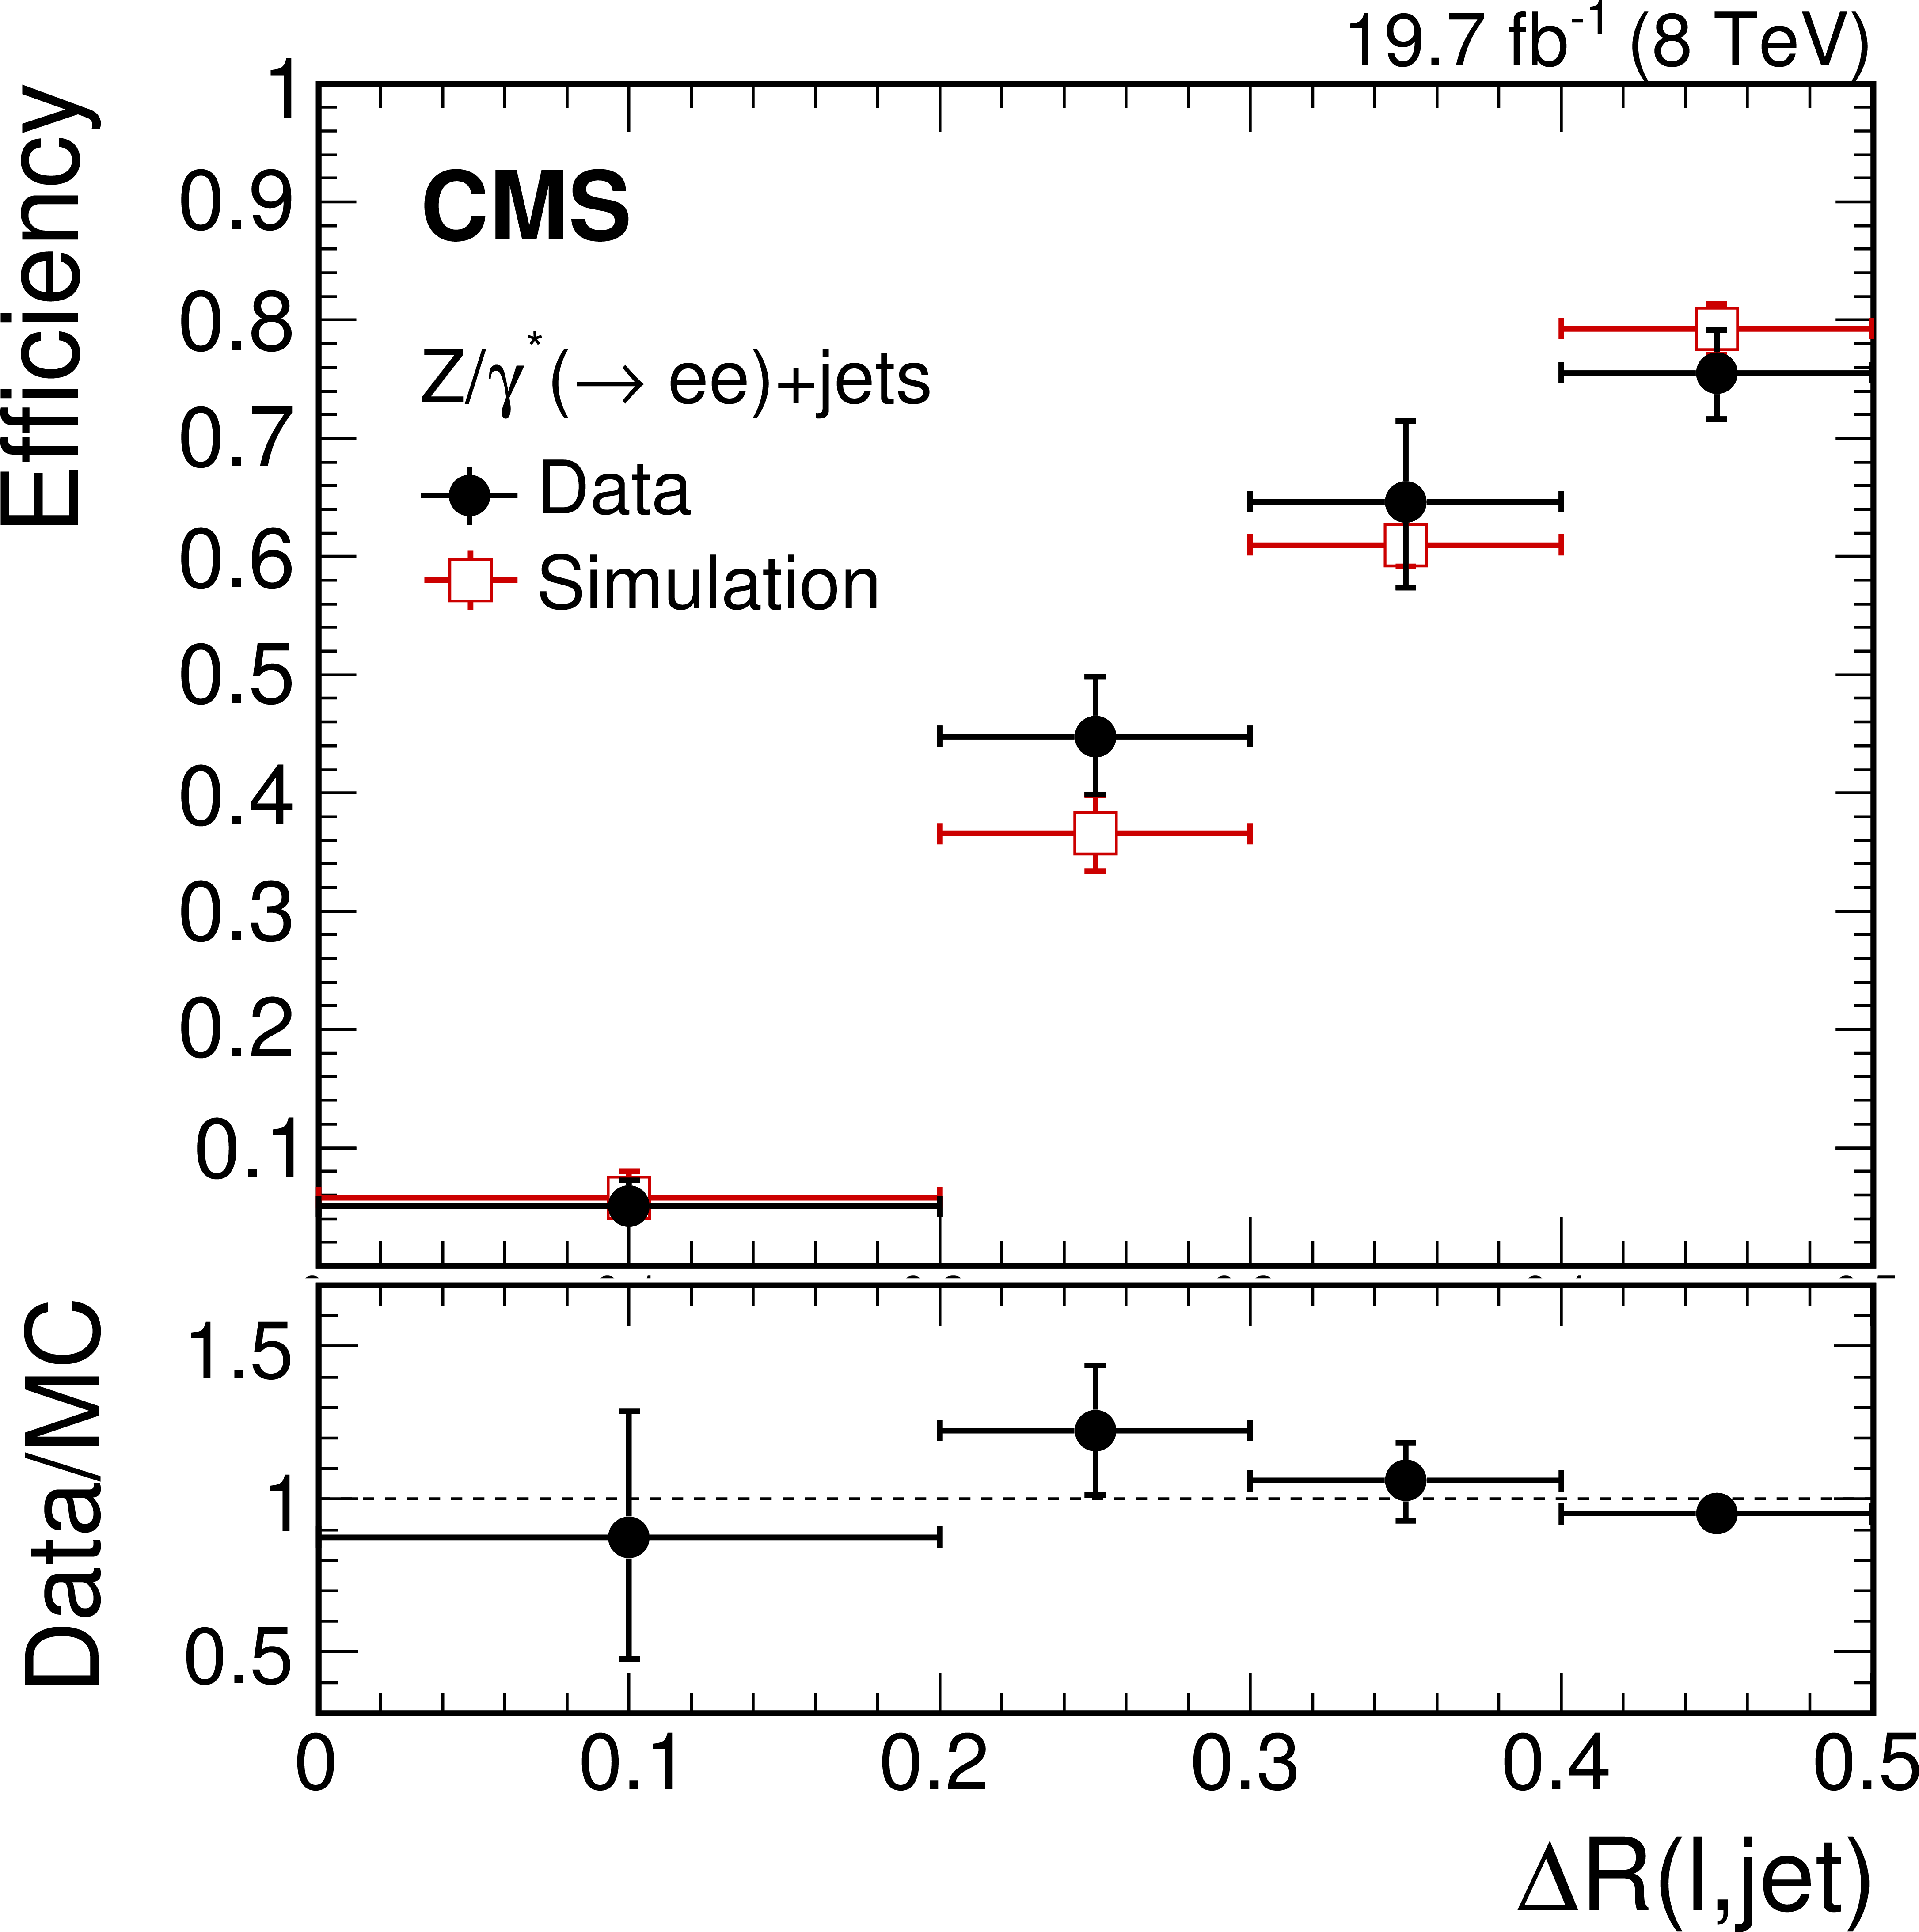
Figure 2-a:
Efficiency of the two-dimensional isolation requirement for data and simulated events for the electron (a) and muon (b) selection, as measured in a sample of $ {\mathrm {Z}} /\gamma ^*(\to \ell \ell )$+jets. The ratio of the efficiencies in data to simulation is shown at the bottom of each panel. |
png pdf |
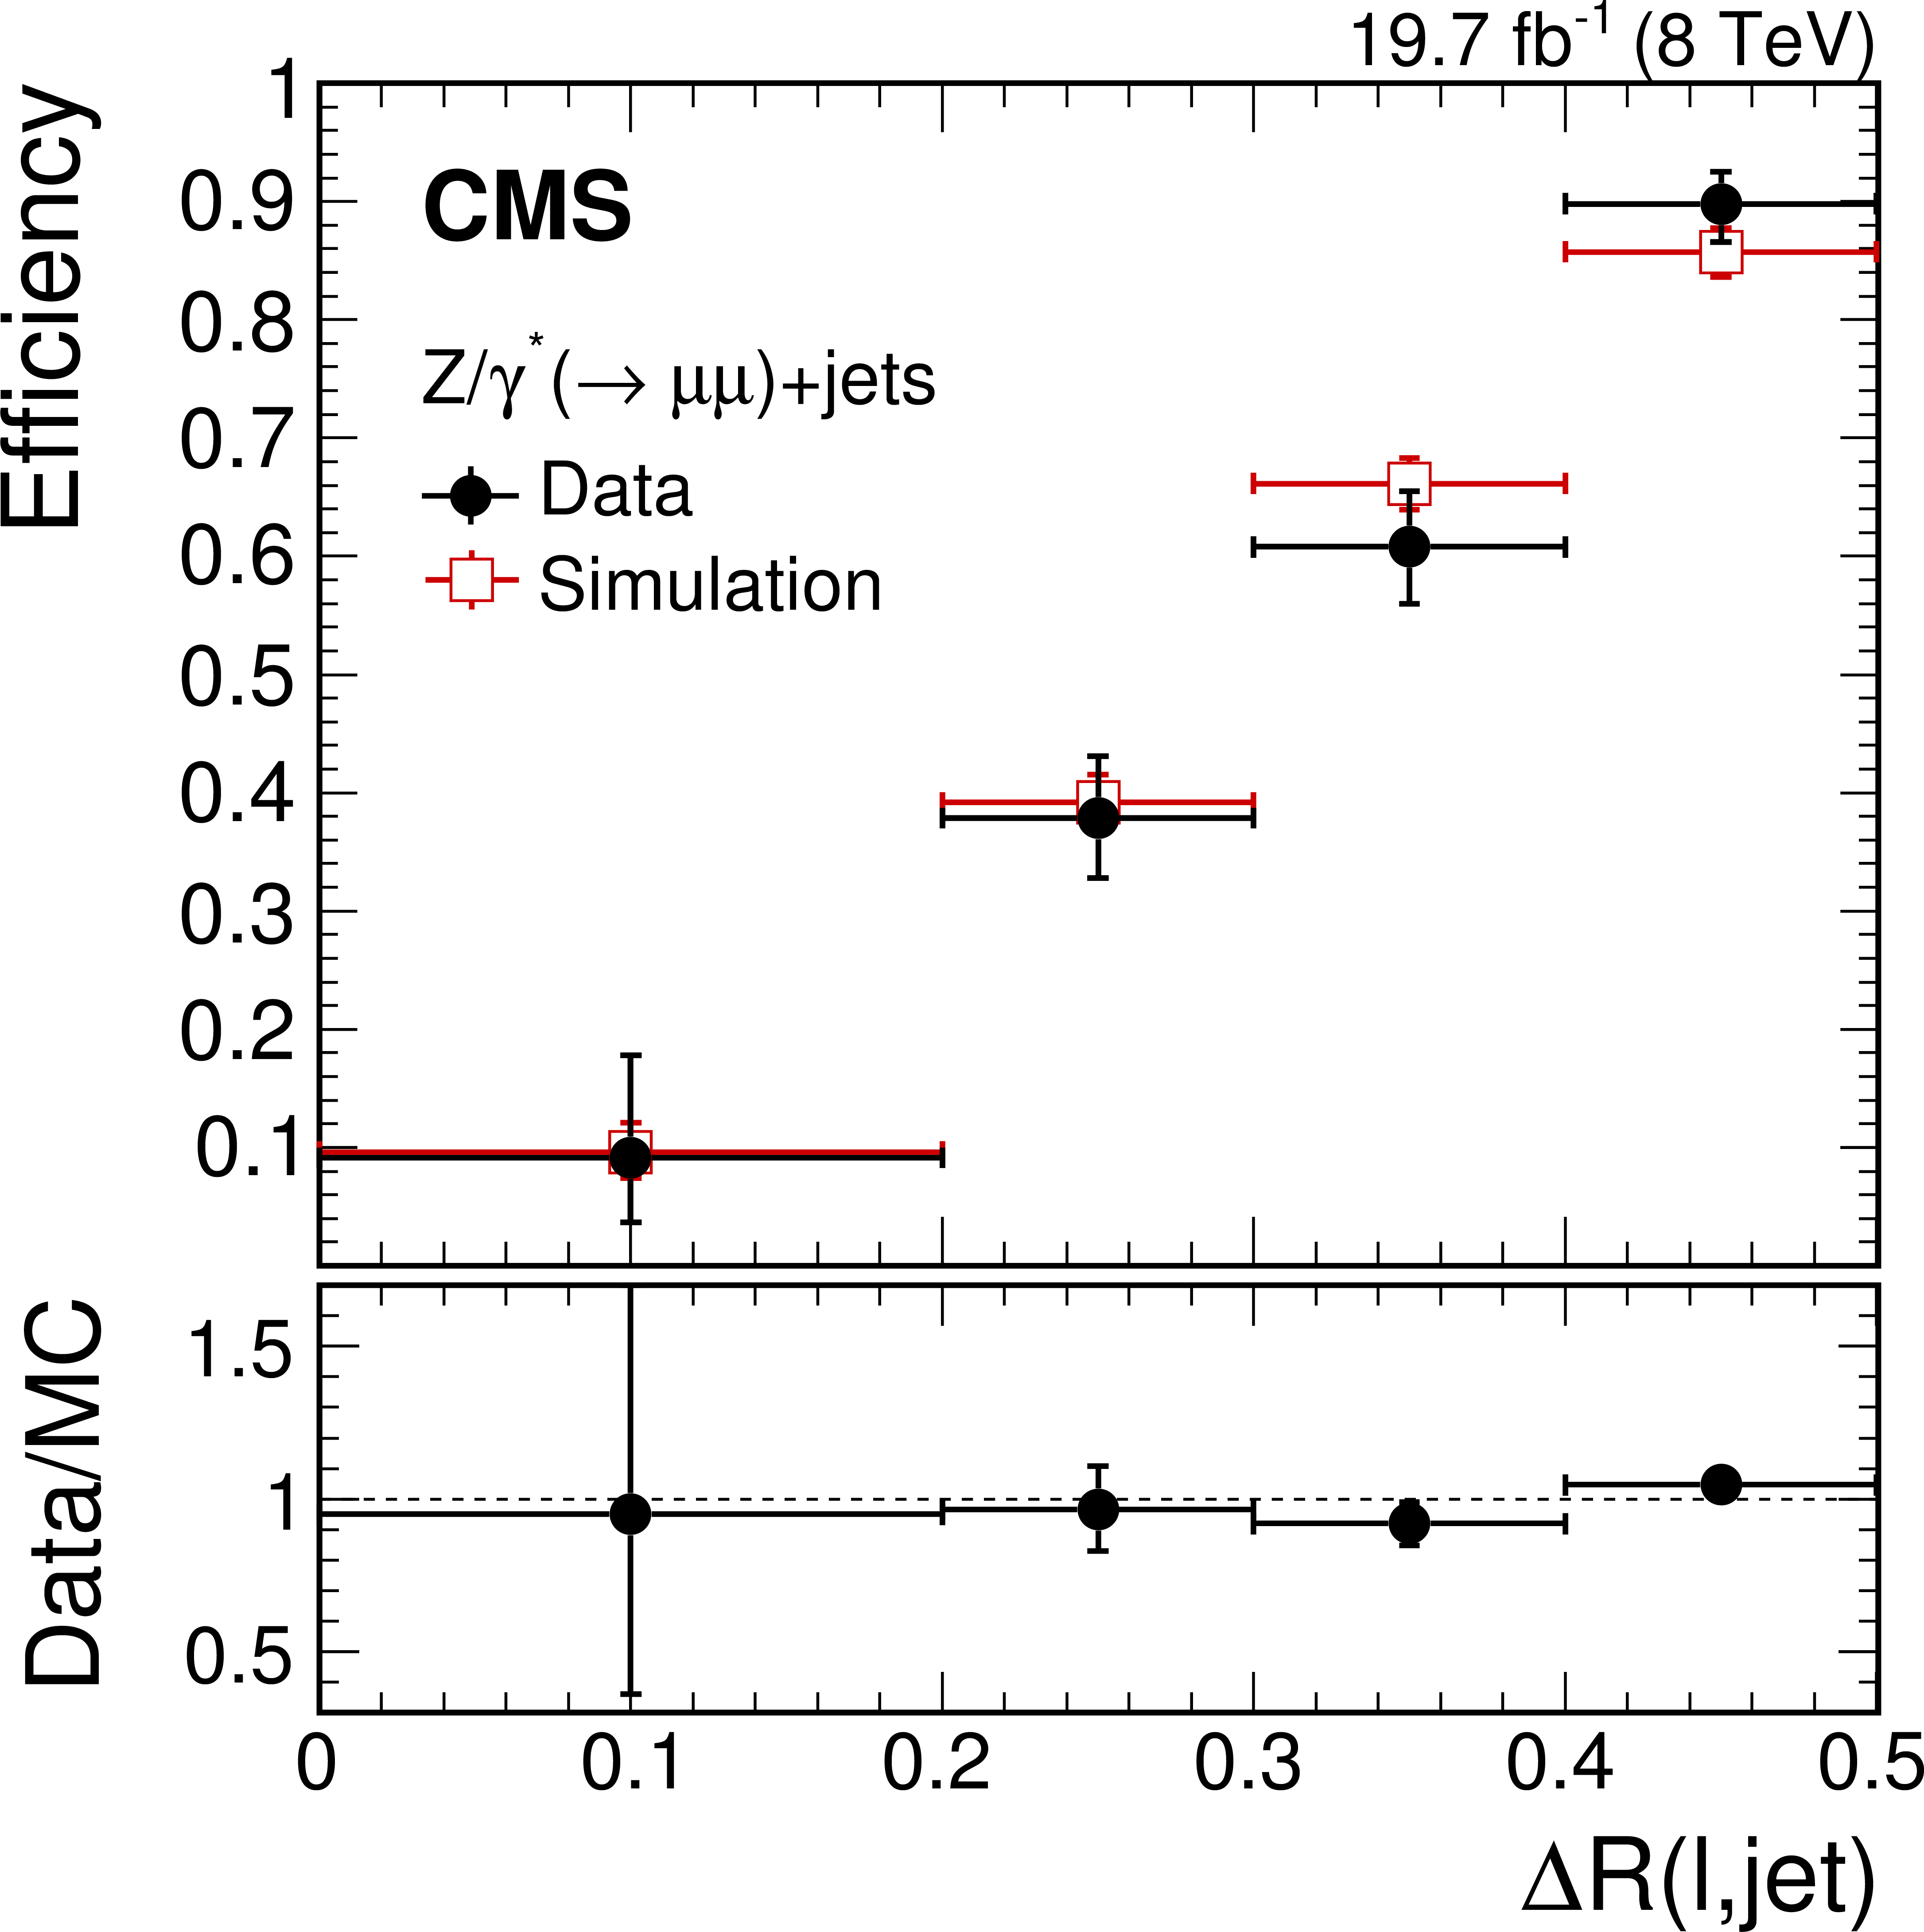
Figure 2-b:
Efficiency of the two-dimensional isolation requirement for data and simulated events for the electron (a) and muon (b) selection, as measured in a sample of $ {\mathrm {Z}} /\gamma ^*(\to \ell \ell )$+jets. The ratio of the efficiencies in data to simulation is shown at the bottom of each panel. |
png pdf |
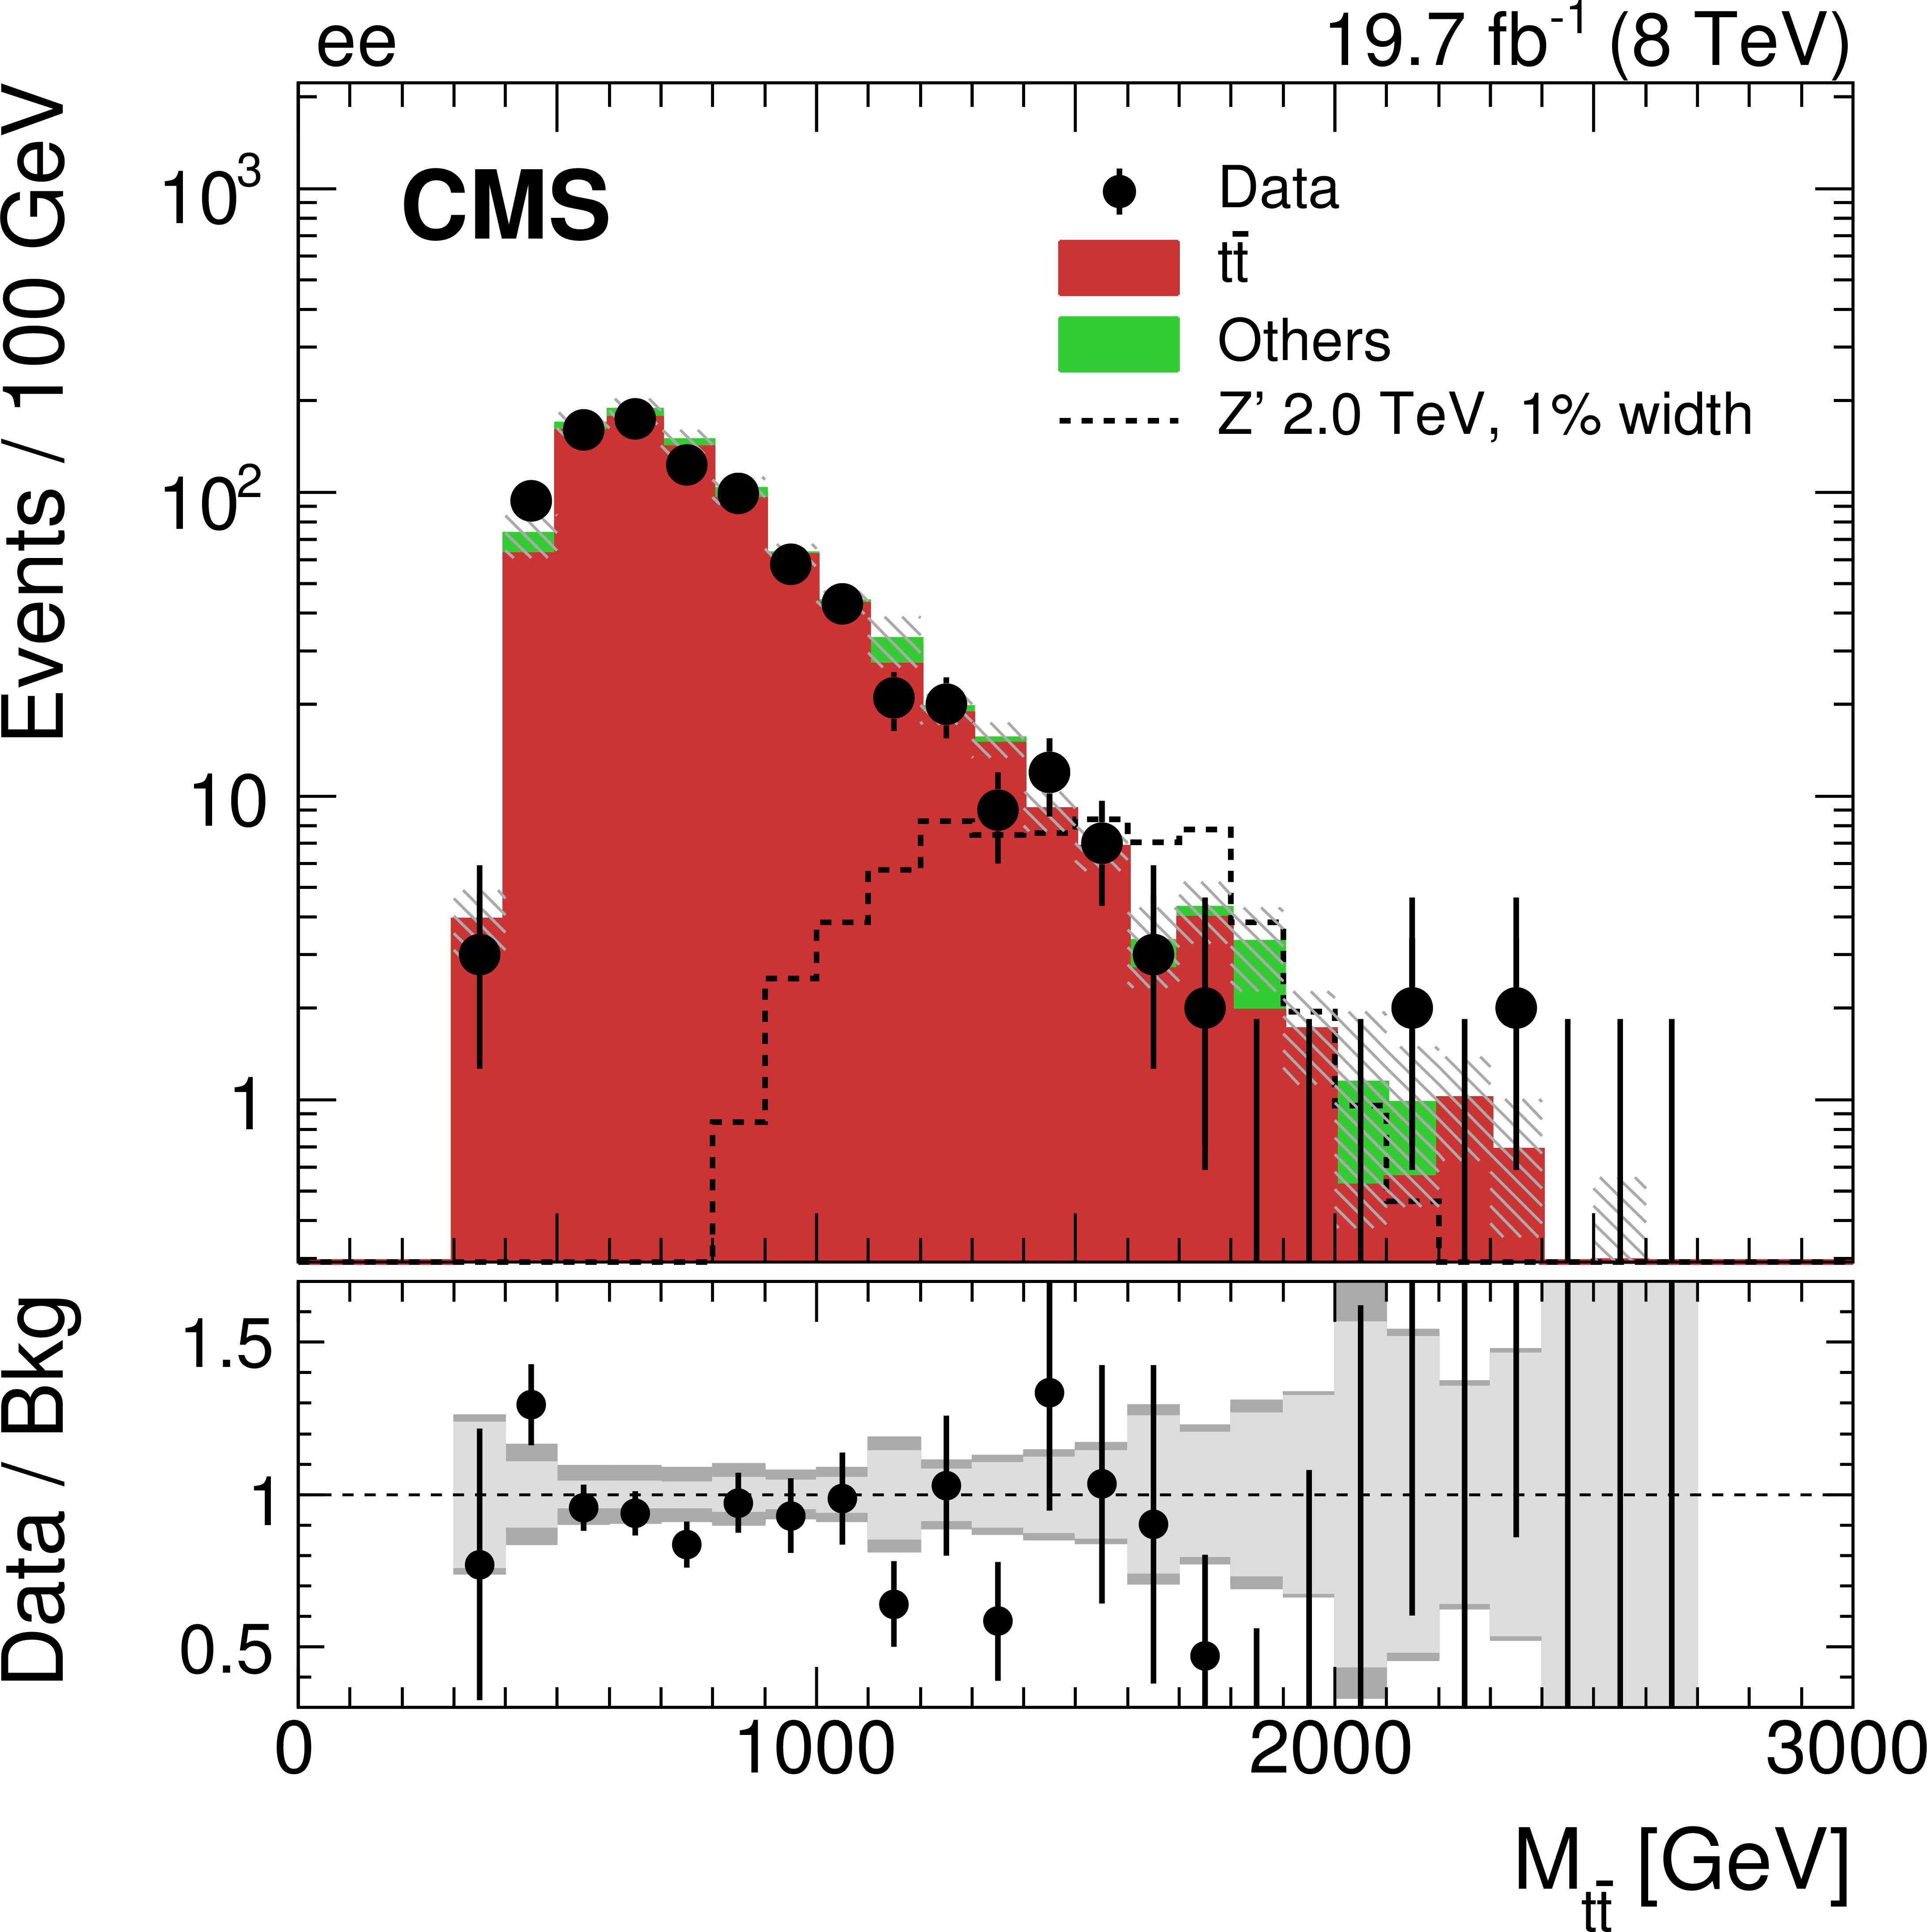
Figure 3-a:
Reconstructed invariant mass of the $ {\mathrm {t}\overline {\mathrm {t}}} $ pair in the $ {\mathrm {e}} {\mathrm {e}}$ (a), $ {\mathrm {e}} {{\mu }}$ (b), and $ {{\mu }} {{\mu }}$ (c) channels for data and simulated events. Each background process is scaled by a factor derived from the maximum likelihood fit to data as explained in Section "Backgrounds". The expected distribution from a Z' signal with $ {M_{ {\mathrm {Z}^\prime } }} = $ 2 TeV and $ {\Gamma _{ {\mathrm {Z}^\prime } }/M_{ {\mathrm {Z}^\prime } }} = $ 0.01, normalized to a cross section of 1 pb, is also shown. The uncertainty associated with the background expectation includes all the statistical and systematic uncertainties. The data-to-background ratio is shown in the bottom panel of each figure. For the ratio plot, the statistical uncertainty is shown in light gray, while the total uncertainty, which is the quadratic sum of the statistical and systematic uncertainties, is shown in dark gray. There is a systematic disagreement observed in the high-mass region that is accommodated by the renormalization and factorization scale uncertainty. |
png pdf |
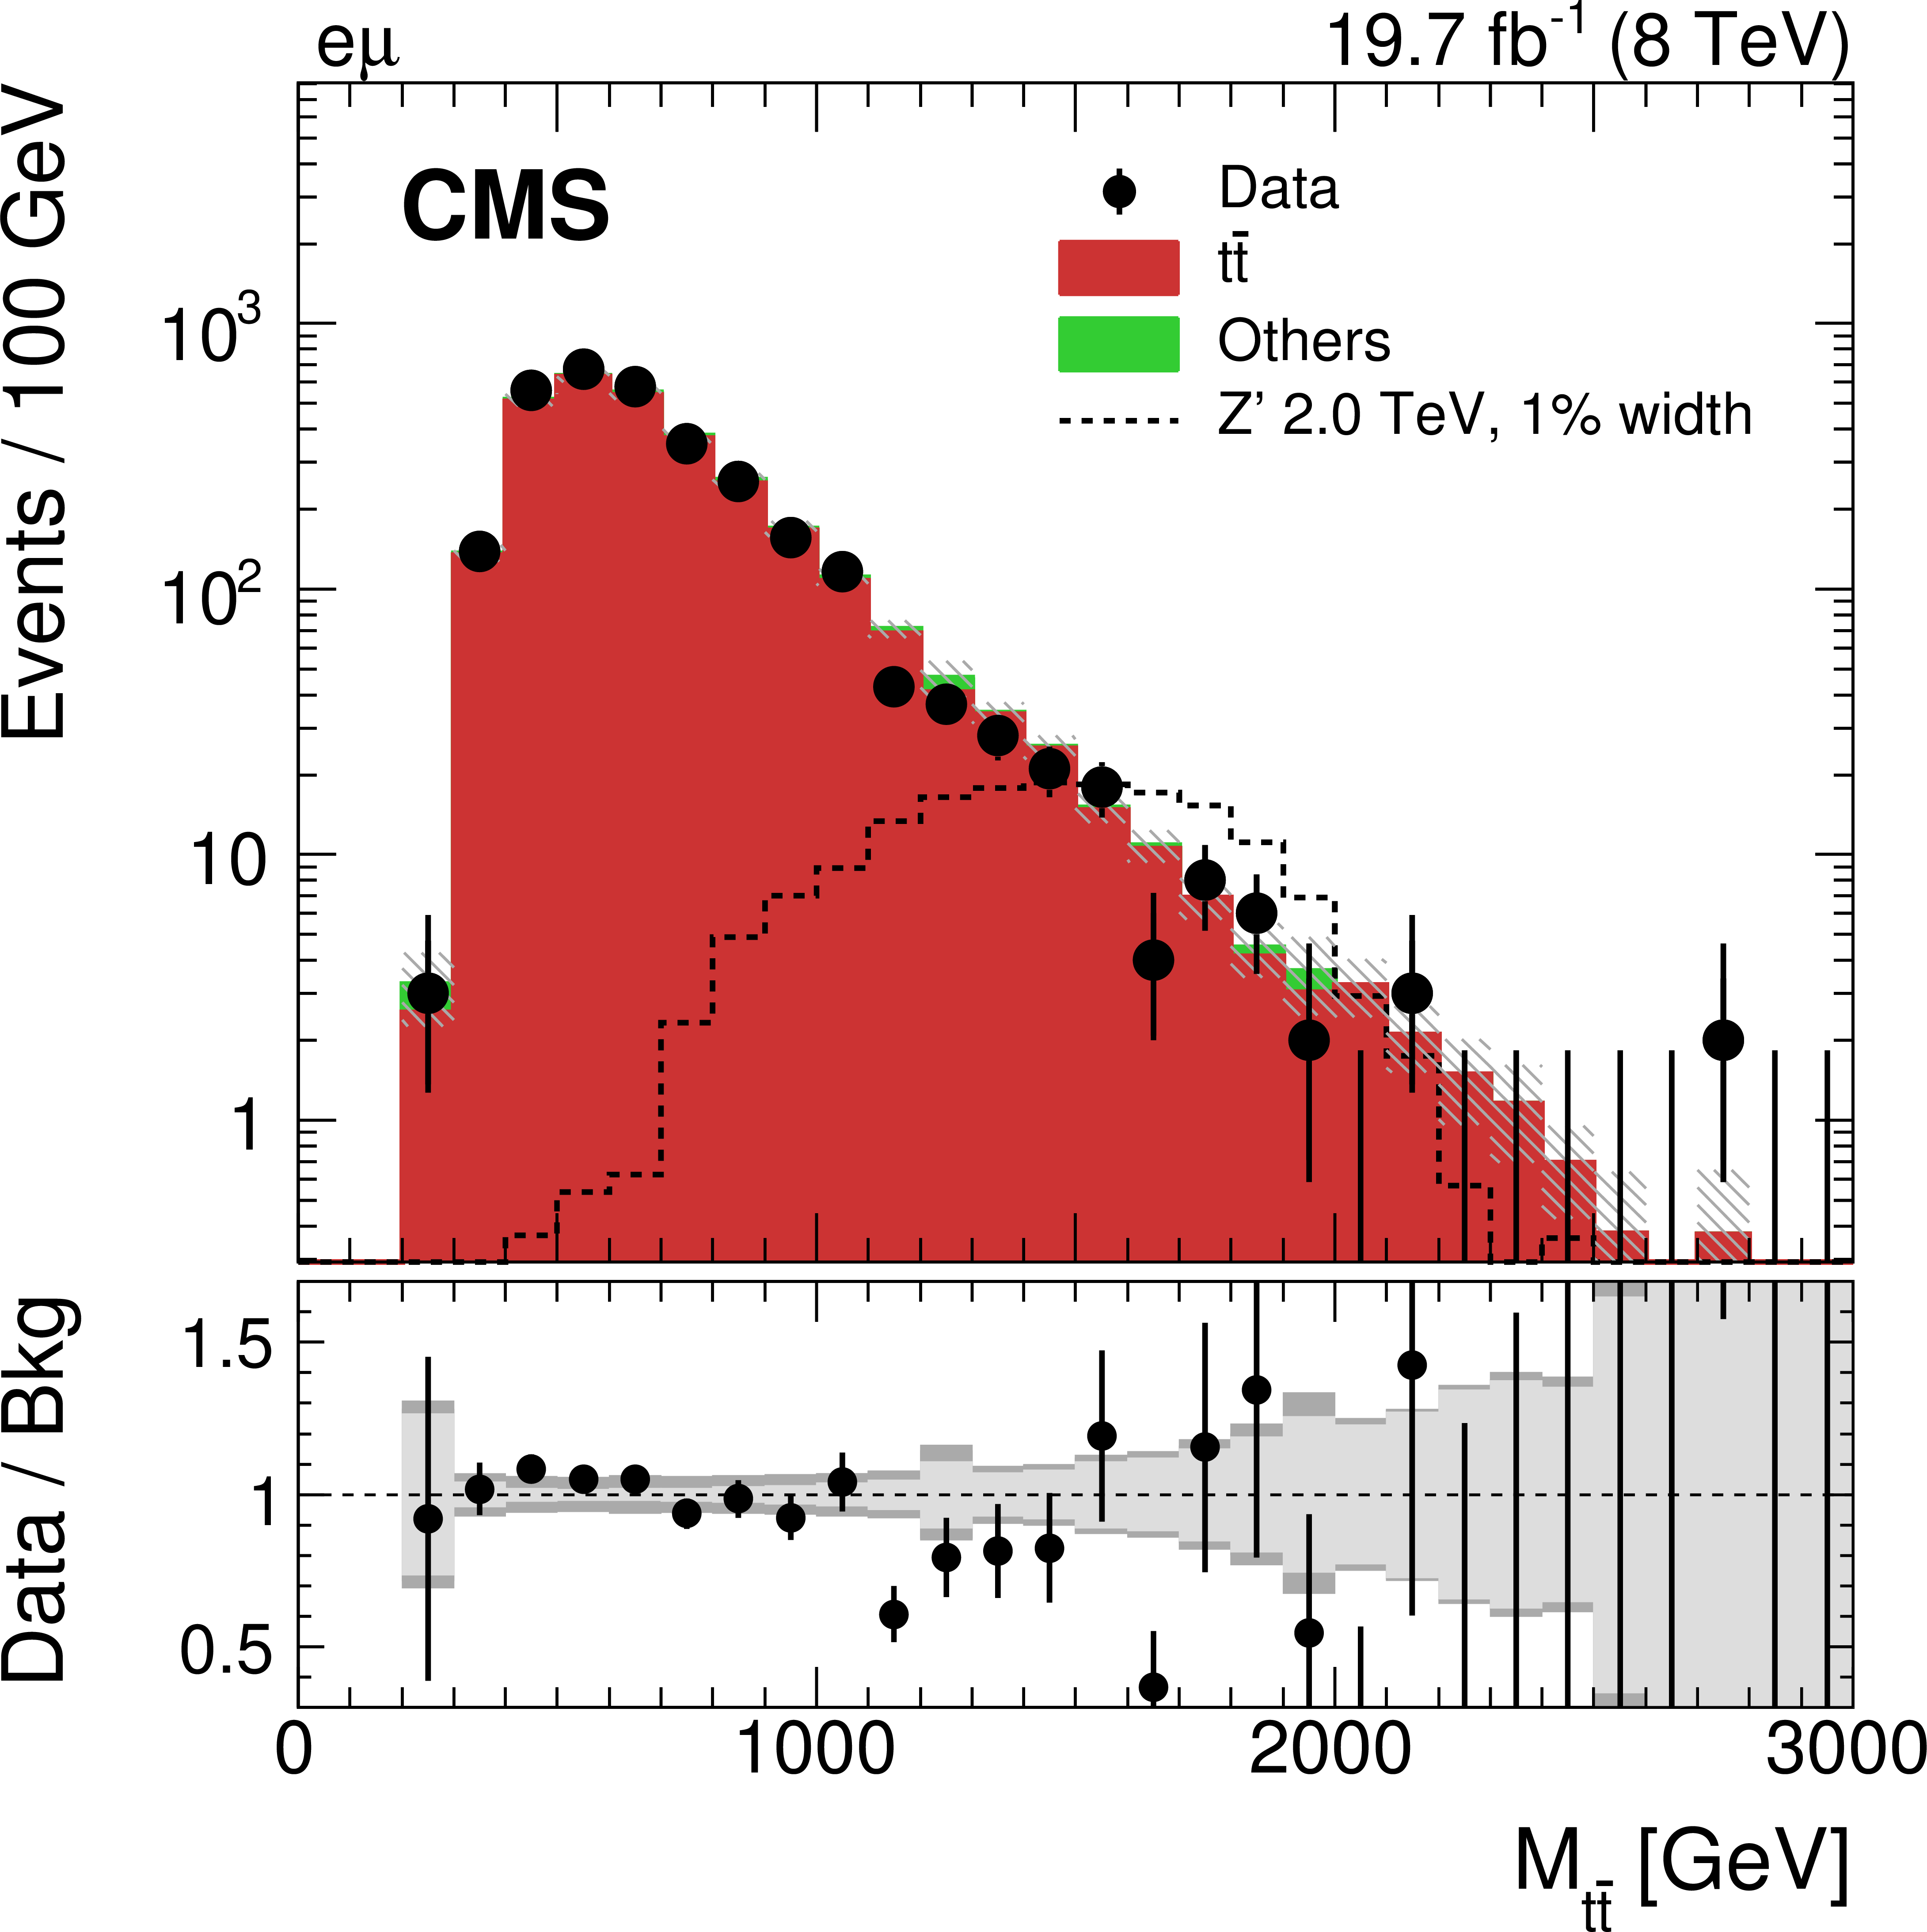
Figure 3-b:
Reconstructed invariant mass of the $ {\mathrm {t}\overline {\mathrm {t}}} $ pair in the $ {\mathrm {e}} {\mathrm {e}}$ (a), $ {\mathrm {e}} {{\mu }}$ (b), and $ {{\mu }} {{\mu }}$ (c) channels for data and simulated events. Each background process is scaled by a factor derived from the maximum likelihood fit to data as explained in Section "Backgrounds". The expected distribution from a Z' signal with $ {M_{ {\mathrm {Z}^\prime } }} = $ 2 TeV and $ {\Gamma _{ {\mathrm {Z}^\prime } }/M_{ {\mathrm {Z}^\prime } }} = $ 0.01, normalized to a cross section of 1 pb, is also shown. The uncertainty associated with the background expectation includes all the statistical and systematic uncertainties. The data-to-background ratio is shown in the bottom panel of each figure. For the ratio plot, the statistical uncertainty is shown in light gray, while the total uncertainty, which is the quadratic sum of the statistical and systematic uncertainties, is shown in dark gray. There is a systematic disagreement observed in the high-mass region that is accommodated by the renormalization and factorization scale uncertainty. |
png pdf |
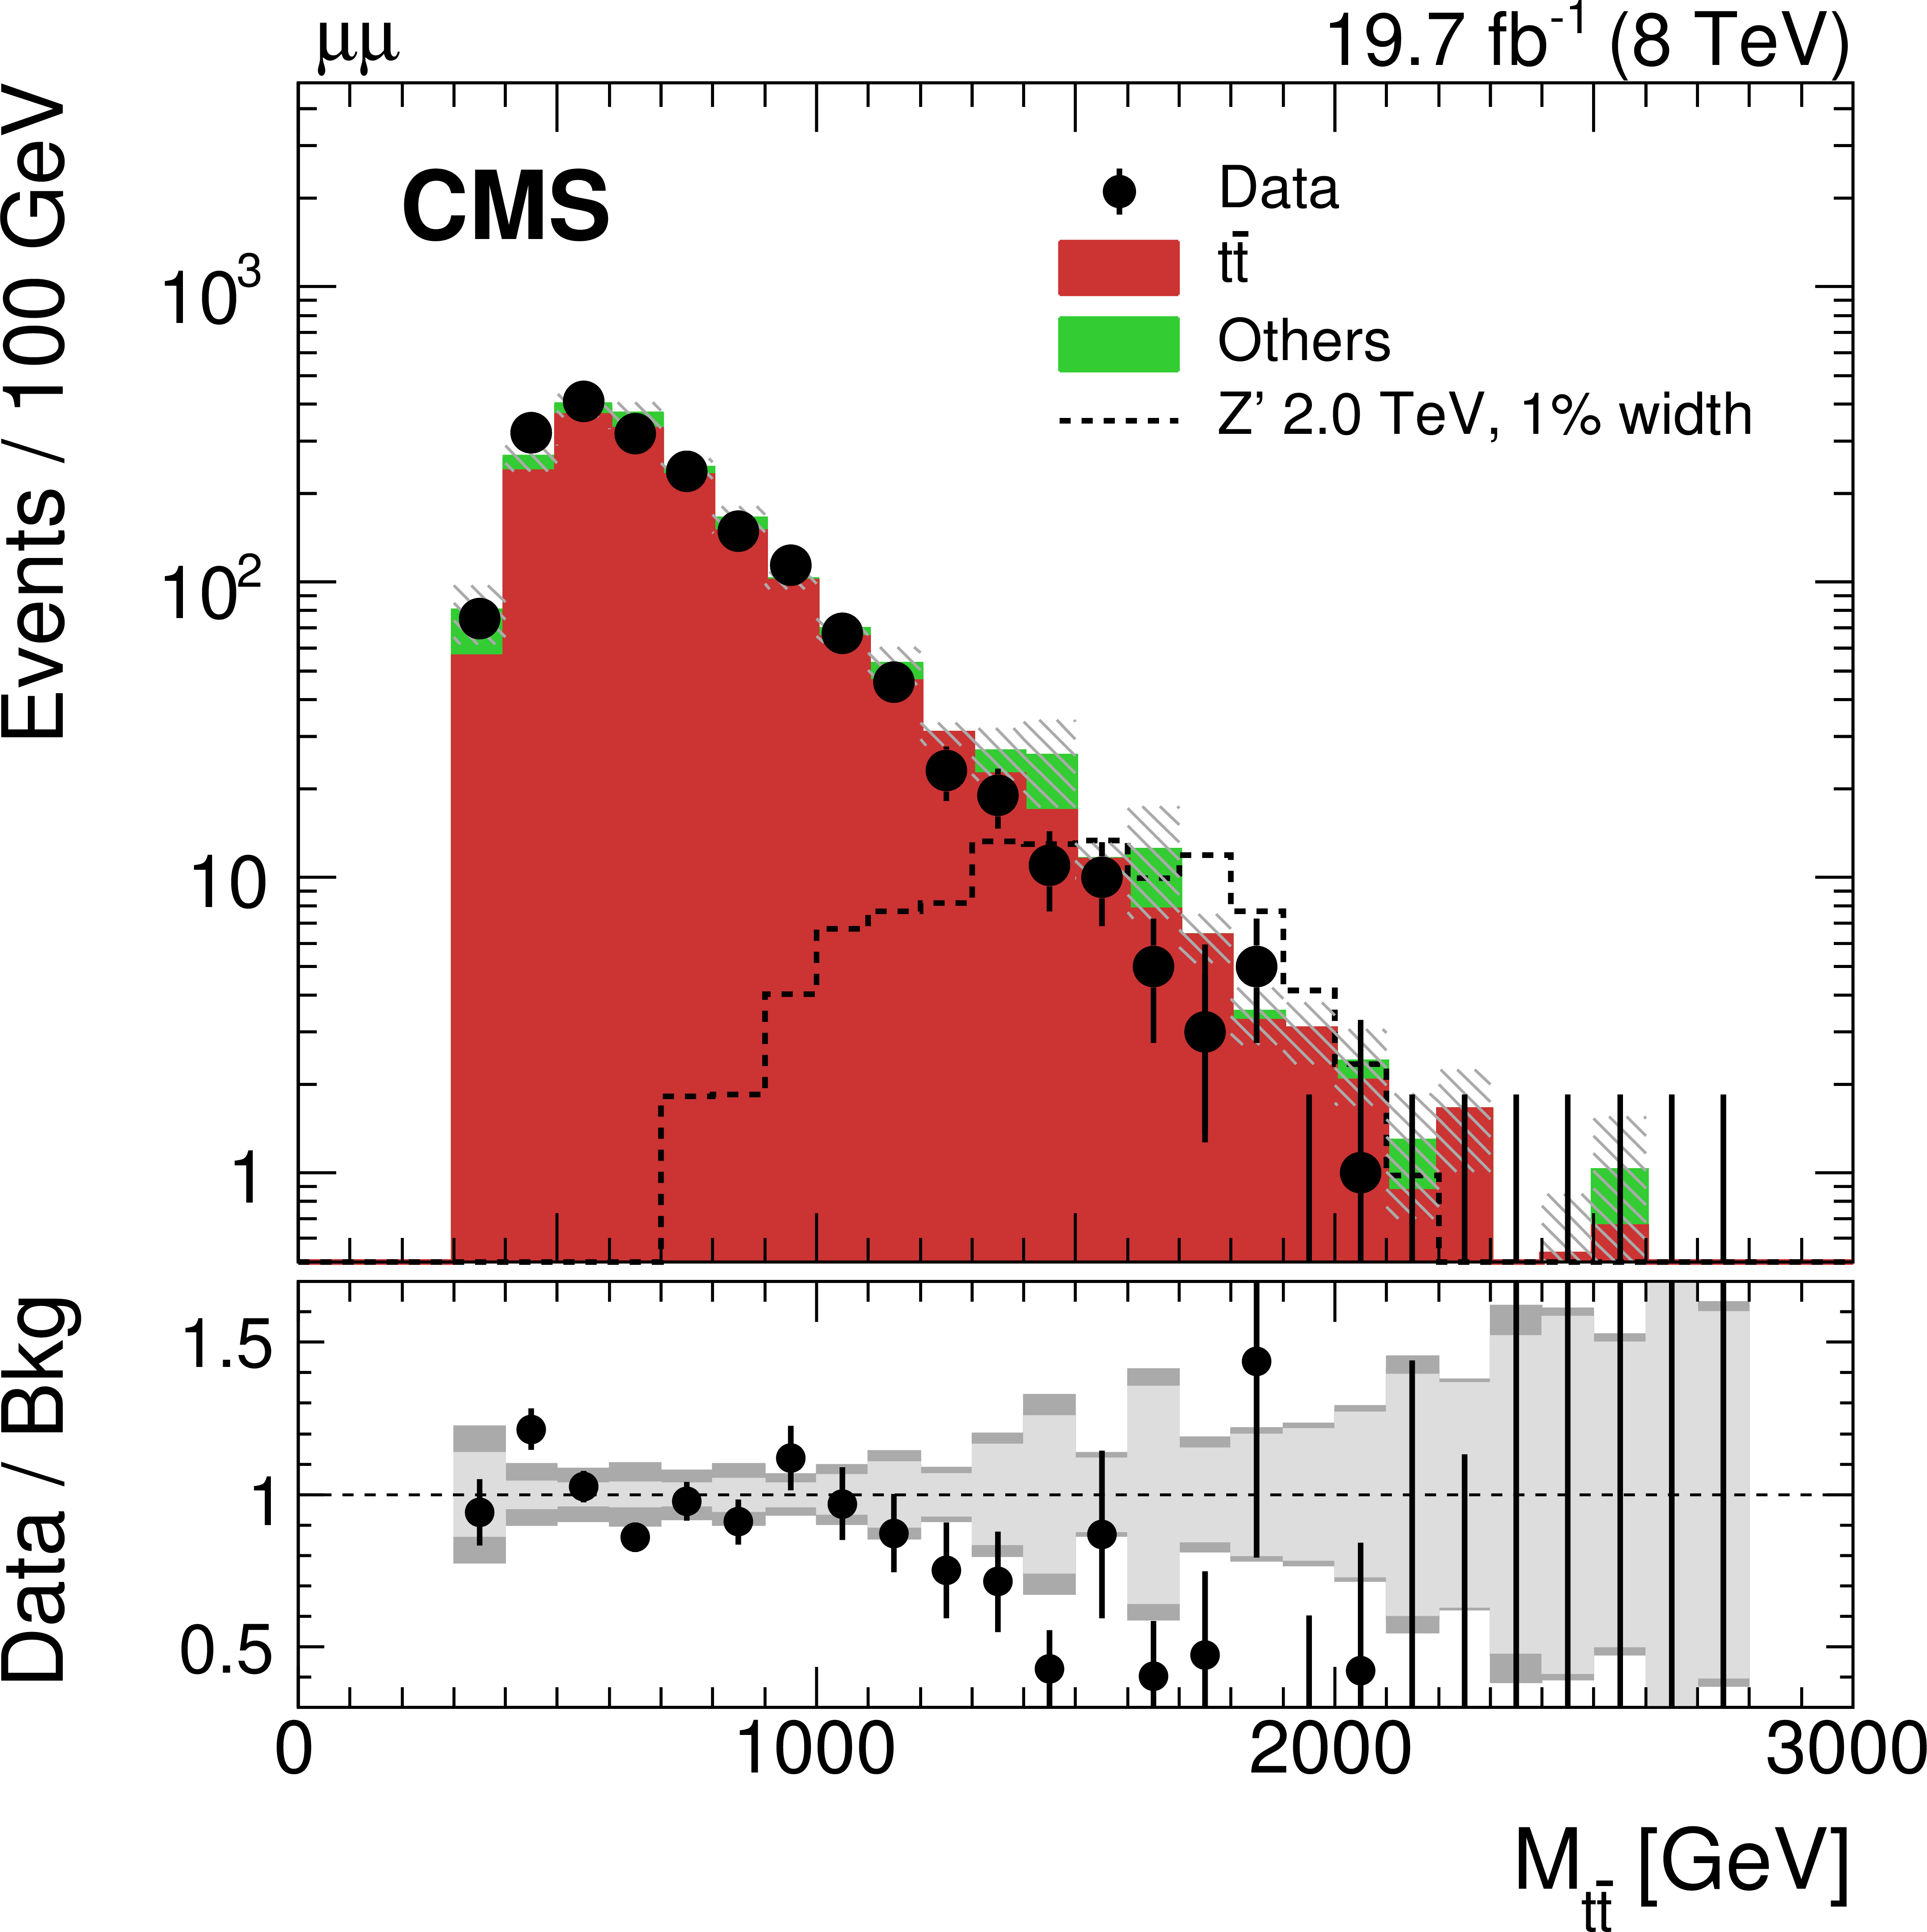
Figure 3-c:
Reconstructed invariant mass of the $ {\mathrm {t}\overline {\mathrm {t}}} $ pair in the $ {\mathrm {e}} {\mathrm {e}}$ (a), $ {\mathrm {e}} {{\mu }}$ (b), and $ {{\mu }} {{\mu }}$ (c) channels for data and simulated events. Each background process is scaled by a factor derived from the maximum likelihood fit to data as explained in Section "Backgrounds". The expected distribution from a Z' signal with $ {M_{ {\mathrm {Z}^\prime } }} = $ 2 TeV and $ {\Gamma _{ {\mathrm {Z}^\prime } }/M_{ {\mathrm {Z}^\prime } }} = $ 0.01, normalized to a cross section of 1 pb, is also shown. The uncertainty associated with the background expectation includes all the statistical and systematic uncertainties. The data-to-background ratio is shown in the bottom panel of each figure. For the ratio plot, the statistical uncertainty is shown in light gray, while the total uncertainty, which is the quadratic sum of the statistical and systematic uncertainties, is shown in dark gray. There is a systematic disagreement observed in the high-mass region that is accommodated by the renormalization and factorization scale uncertainty. |
png pdf |
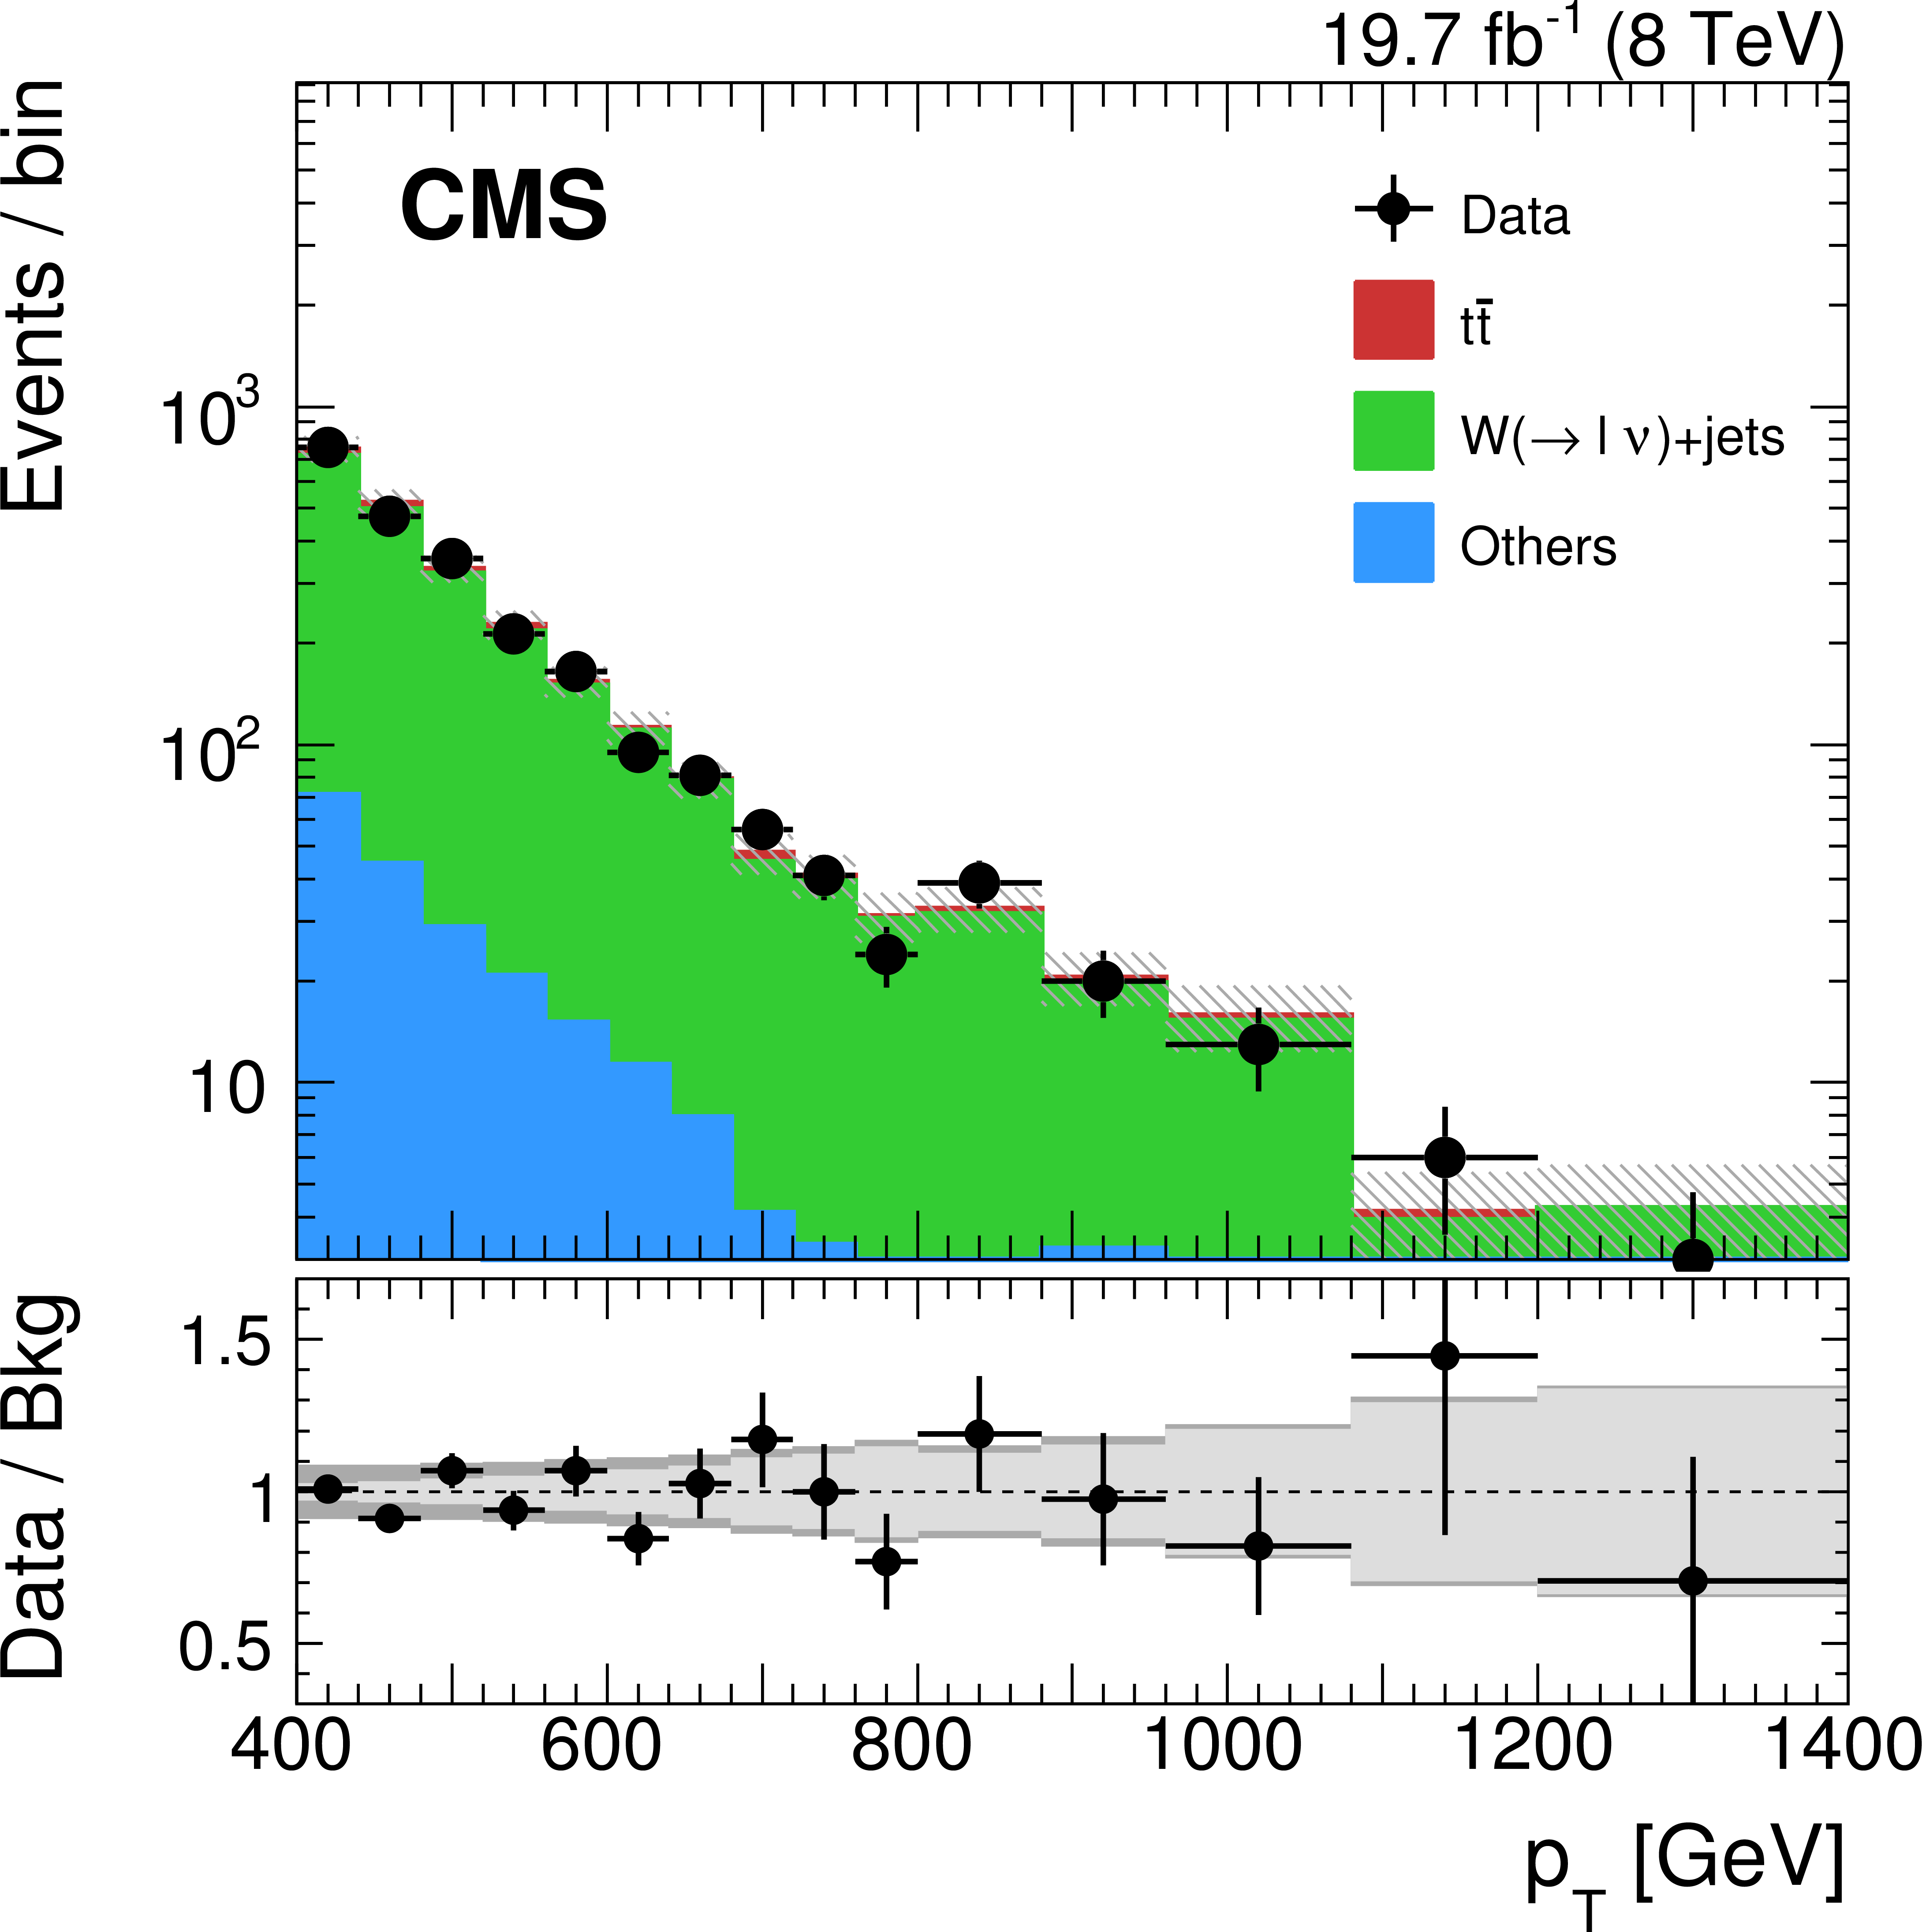
Figure 4-a:
Distribution of $ {p_{\mathrm {T}}} $ (a) and the jet mass (b) of the leading CA8 jet in a $ {\mathrm {W}}$+jets control region, used to obtain the mistag rate of CA8 $ {\mathrm {t}}$-tagged jets. The horizontal error bars indicate the bin width. The data-to-background ratio is shown in the bottom panel of each figure. For the ratio plot, the statistical uncertainty is shown in light gray, while the total uncertainty, which is the quadratic sum of the statistical and systematic uncertainties, is shown in dark gray. |
png pdf |
Figure 4-b:
Distribution of $ {p_{\mathrm {T}}} $ (a) and the jet mass (b) of the leading CA8 jet in a $ {\mathrm {W}}$+jets control region, used to obtain the mistag rate of CA8 $ {\mathrm {t}}$-tagged jets. The horizontal error bars indicate the bin width. The data-to-background ratio is shown in the bottom panel of each figure. For the ratio plot, the statistical uncertainty is shown in light gray, while the total uncertainty, which is the quadratic sum of the statistical and systematic uncertainties, is shown in dark gray. |
png pdf |
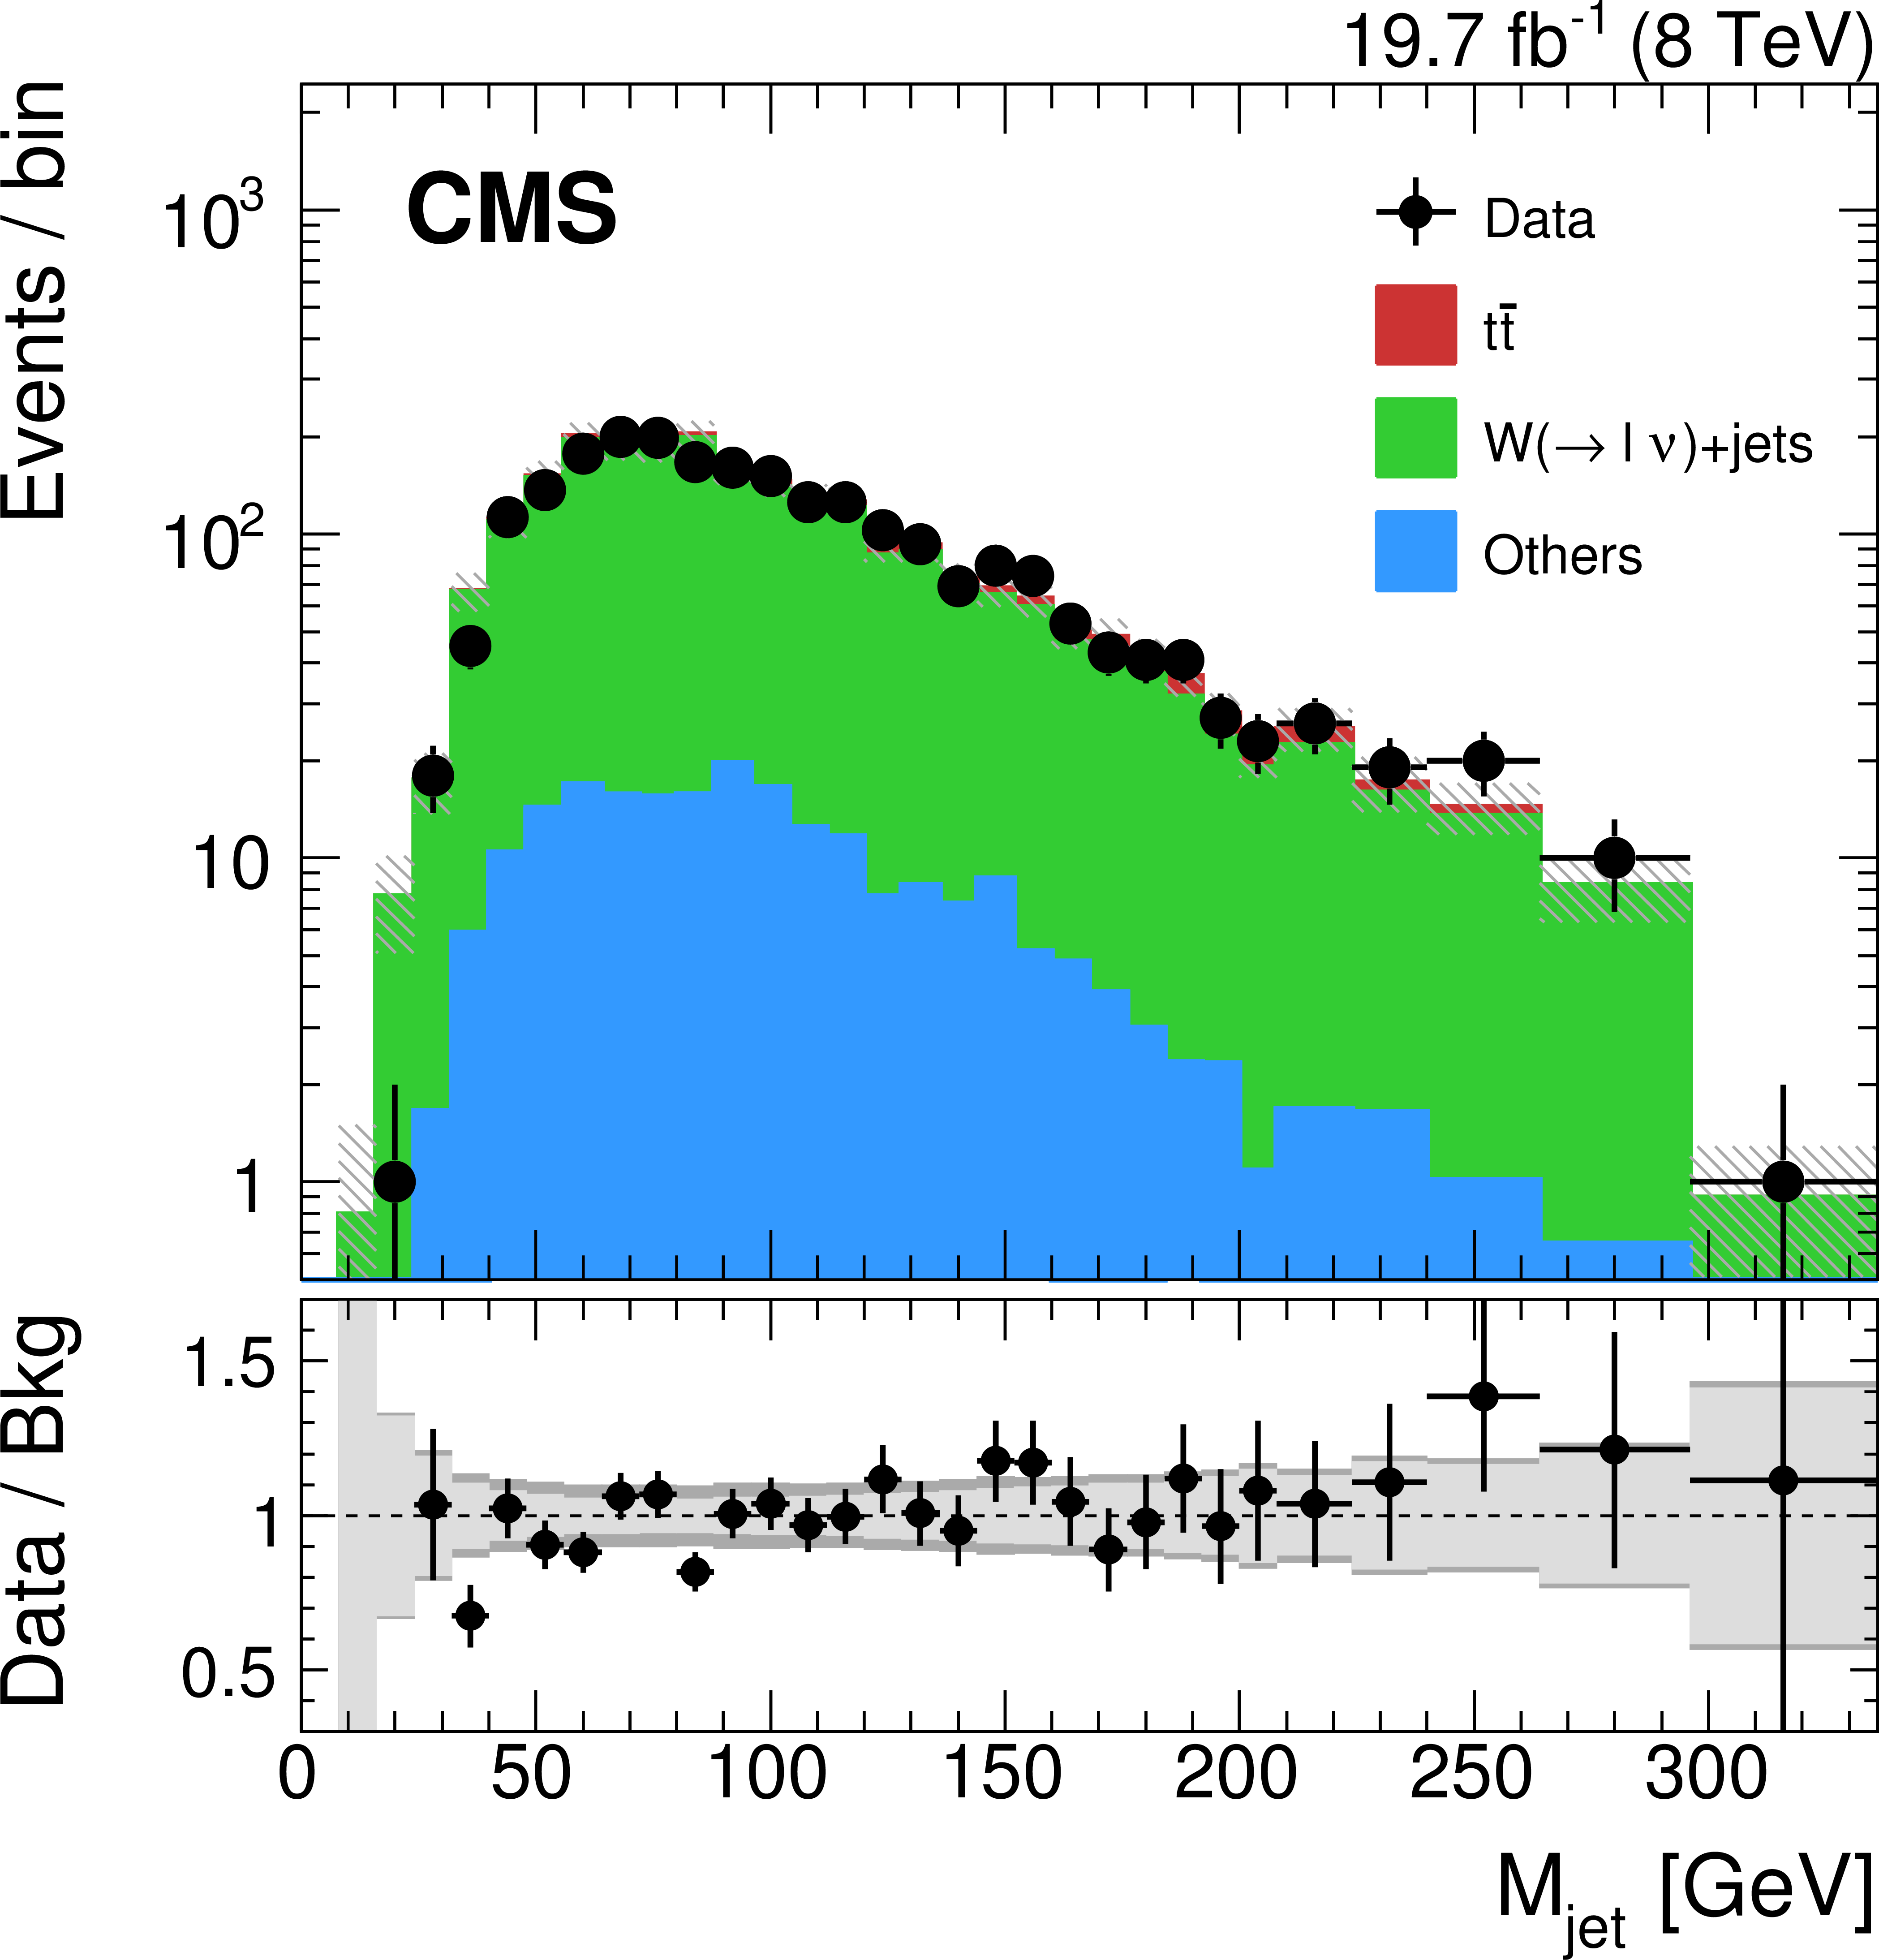
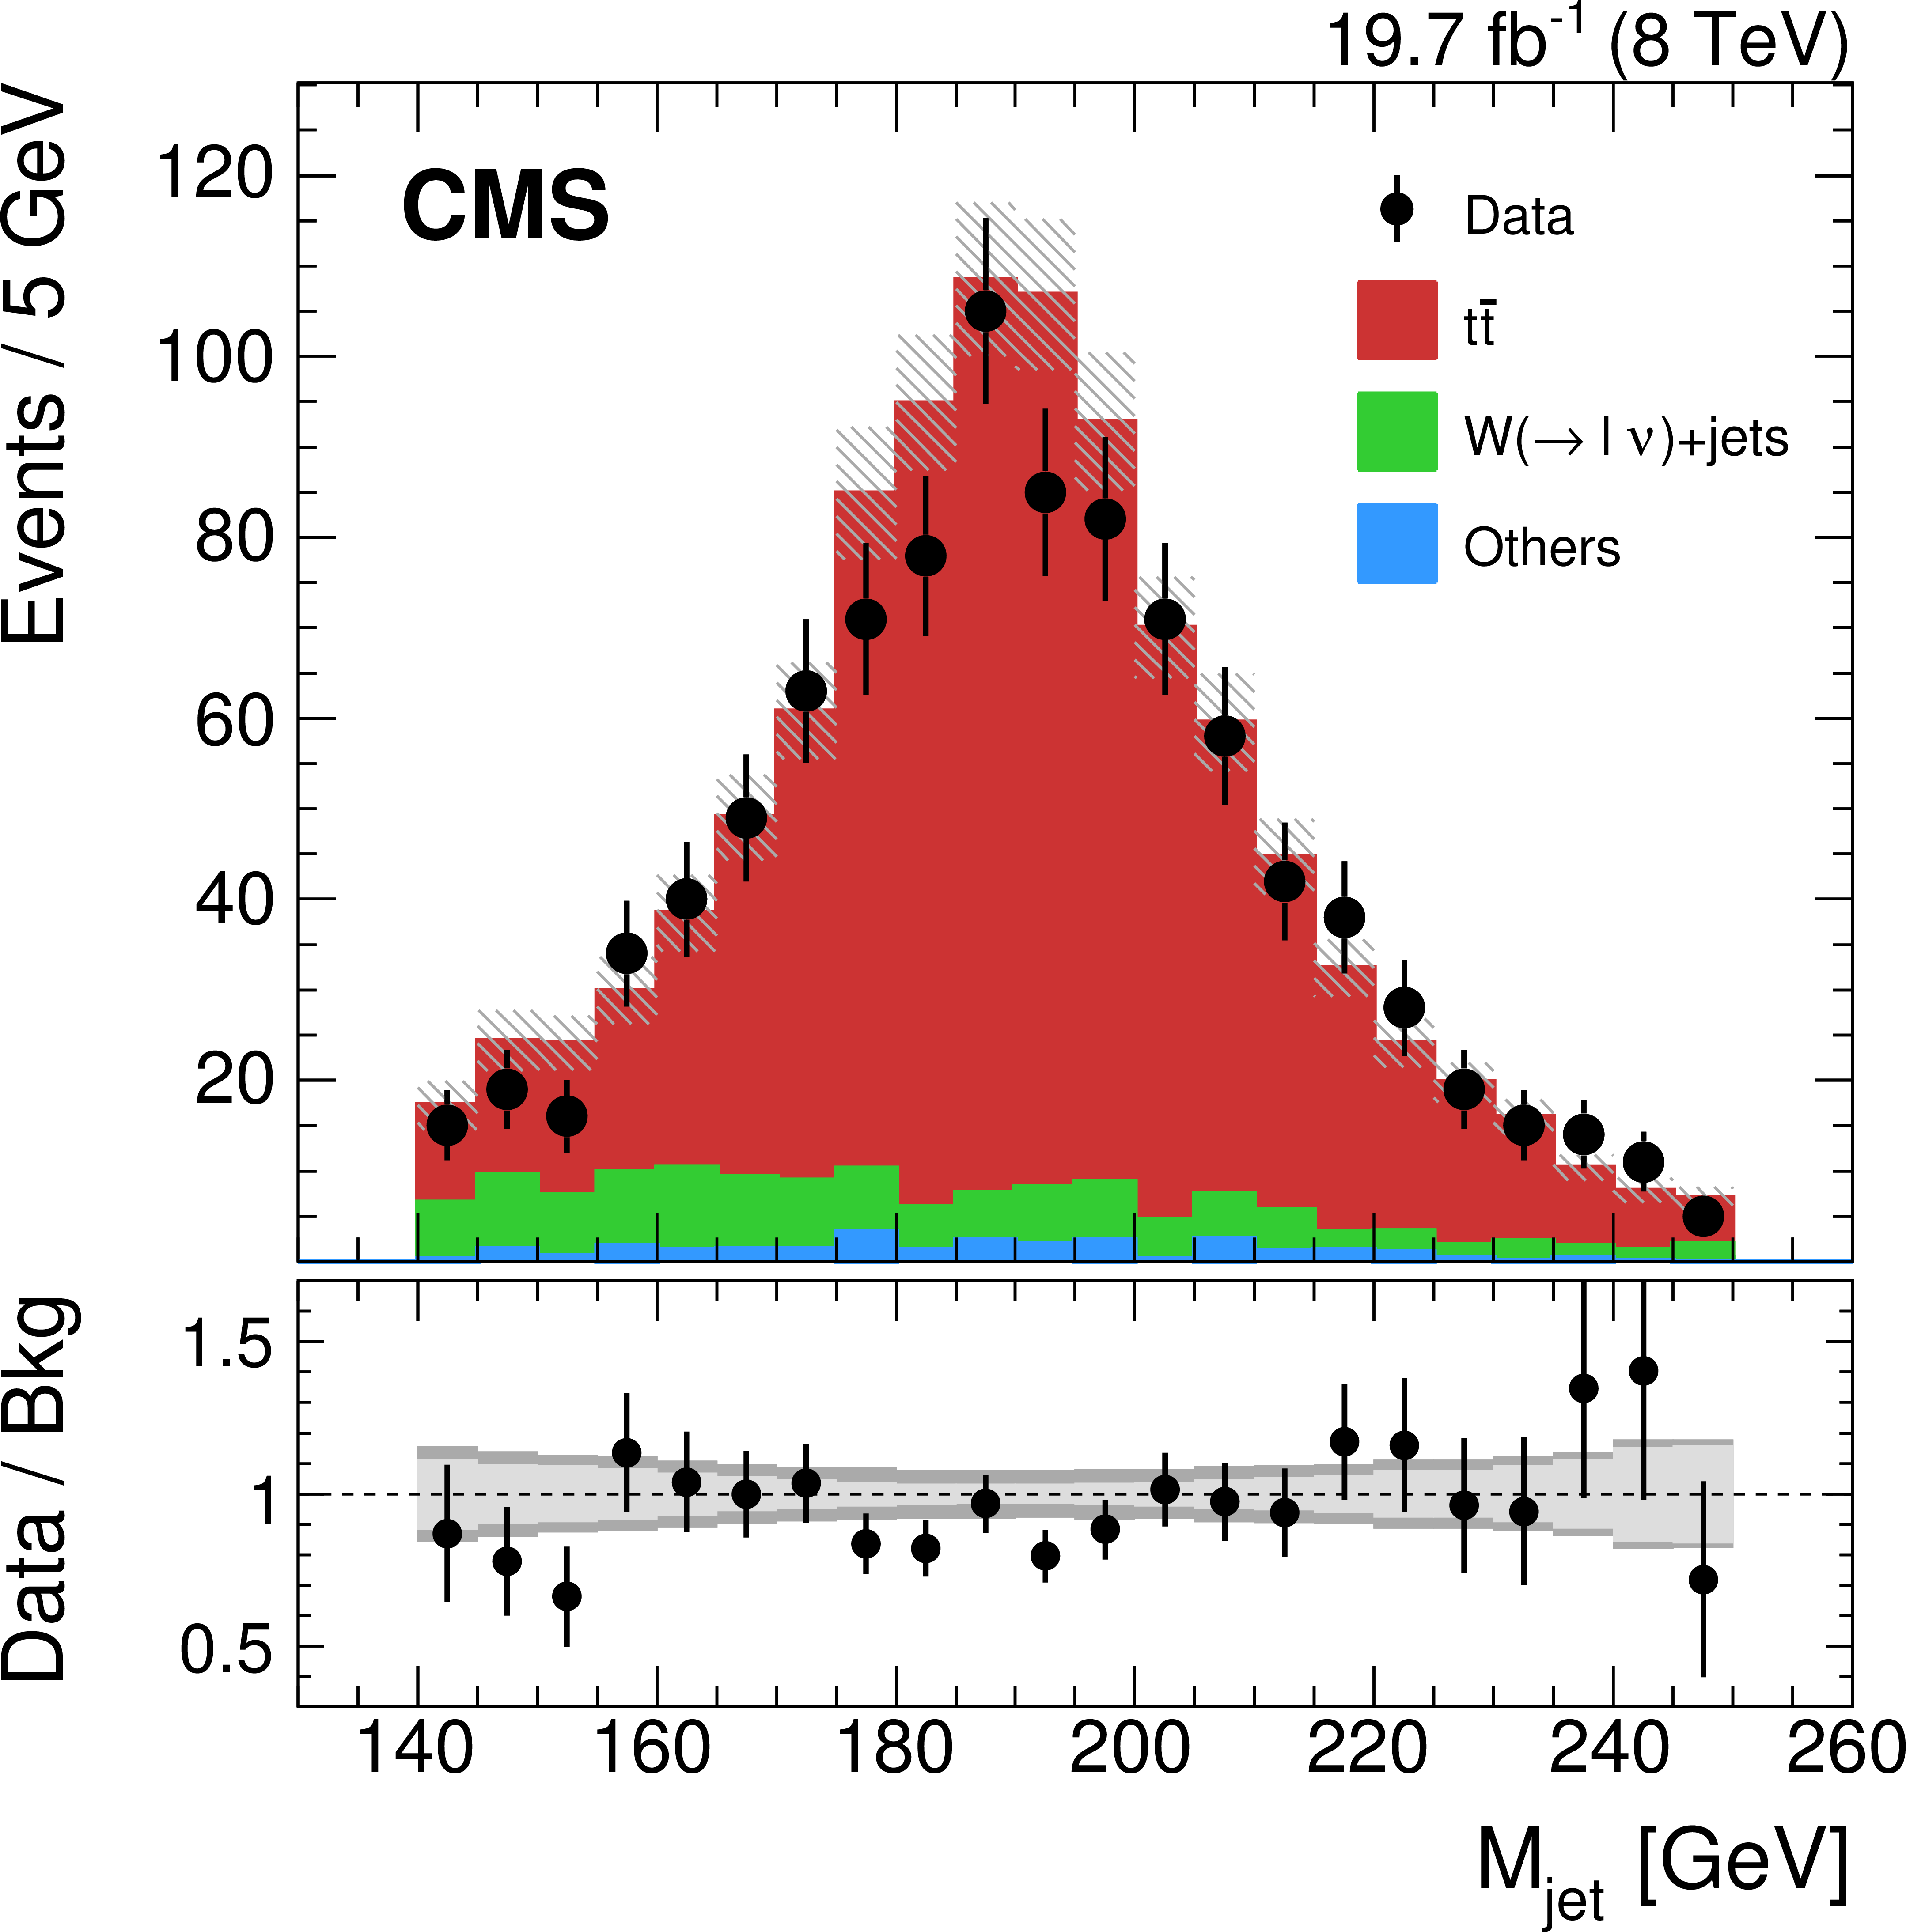
Figure 5-a:
Distributions of the jet mass (a), minimum pairwise mass $ {M_{\text {min}}} $ (b), and the ratio $\tau _{32}$ (c) for CA8 $ {\mathrm {t}}$-tagged jets in the lepton+jets channel. The SM backgrounds are scaled by a factor derived from the maximum likelihood fit to data as explained in Section {sec:background}. The uncertainty associated with the background expectation includes all the statistical and systematic uncertainties. The data-to-background ratio is shown in the bottom panel of each figure. For the ratio plot, the statistical uncertainty is shown in light gray, while the total uncertainty, which is the quadratic sum of the statistical and systematic uncertainties, is shown in dark gray. |
png pdf |
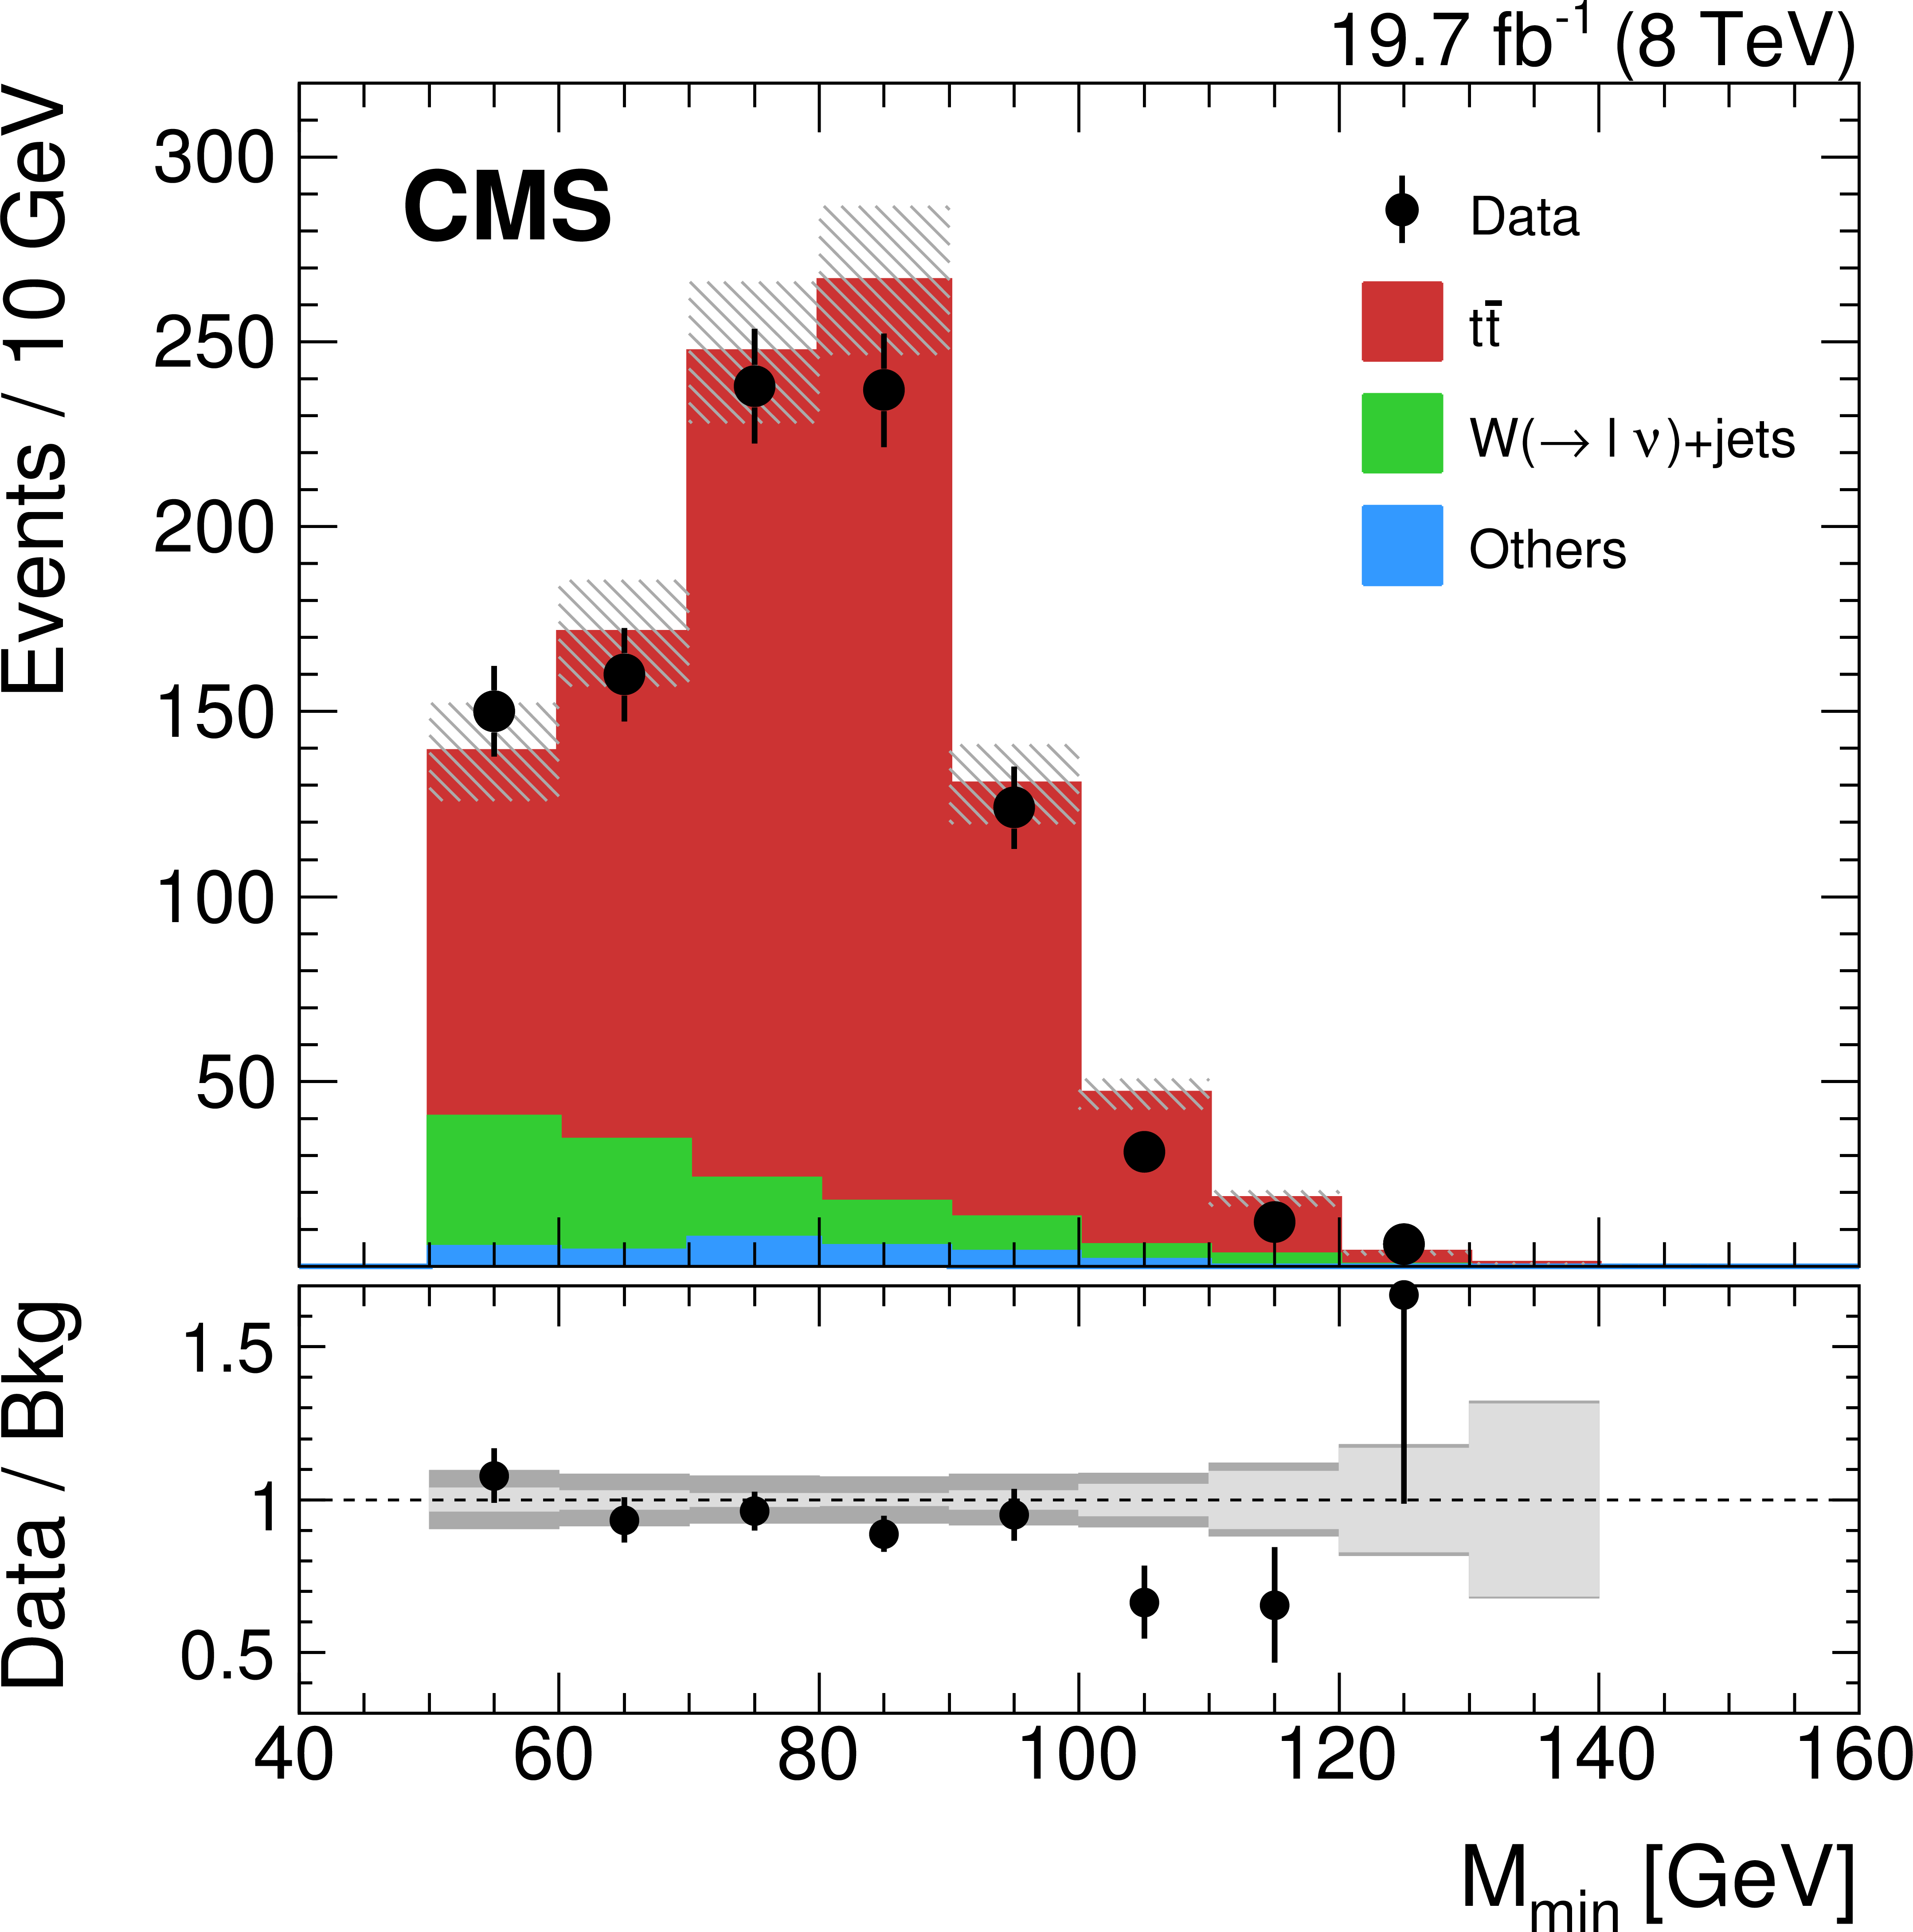
Figure 5-b:
Distributions of the jet mass (a), minimum pairwise mass $ {M_{\text {min}}} $ (b), and the ratio $\tau _{32}$ (c) for CA8 $ {\mathrm {t}}$-tagged jets in the lepton+jets channel. The SM backgrounds are scaled by a factor derived from the maximum likelihood fit to data as explained in Section {sec:background}. The uncertainty associated with the background expectation includes all the statistical and systematic uncertainties. The data-to-background ratio is shown in the bottom panel of each figure. For the ratio plot, the statistical uncertainty is shown in light gray, while the total uncertainty, which is the quadratic sum of the statistical and systematic uncertainties, is shown in dark gray. |
png pdf |
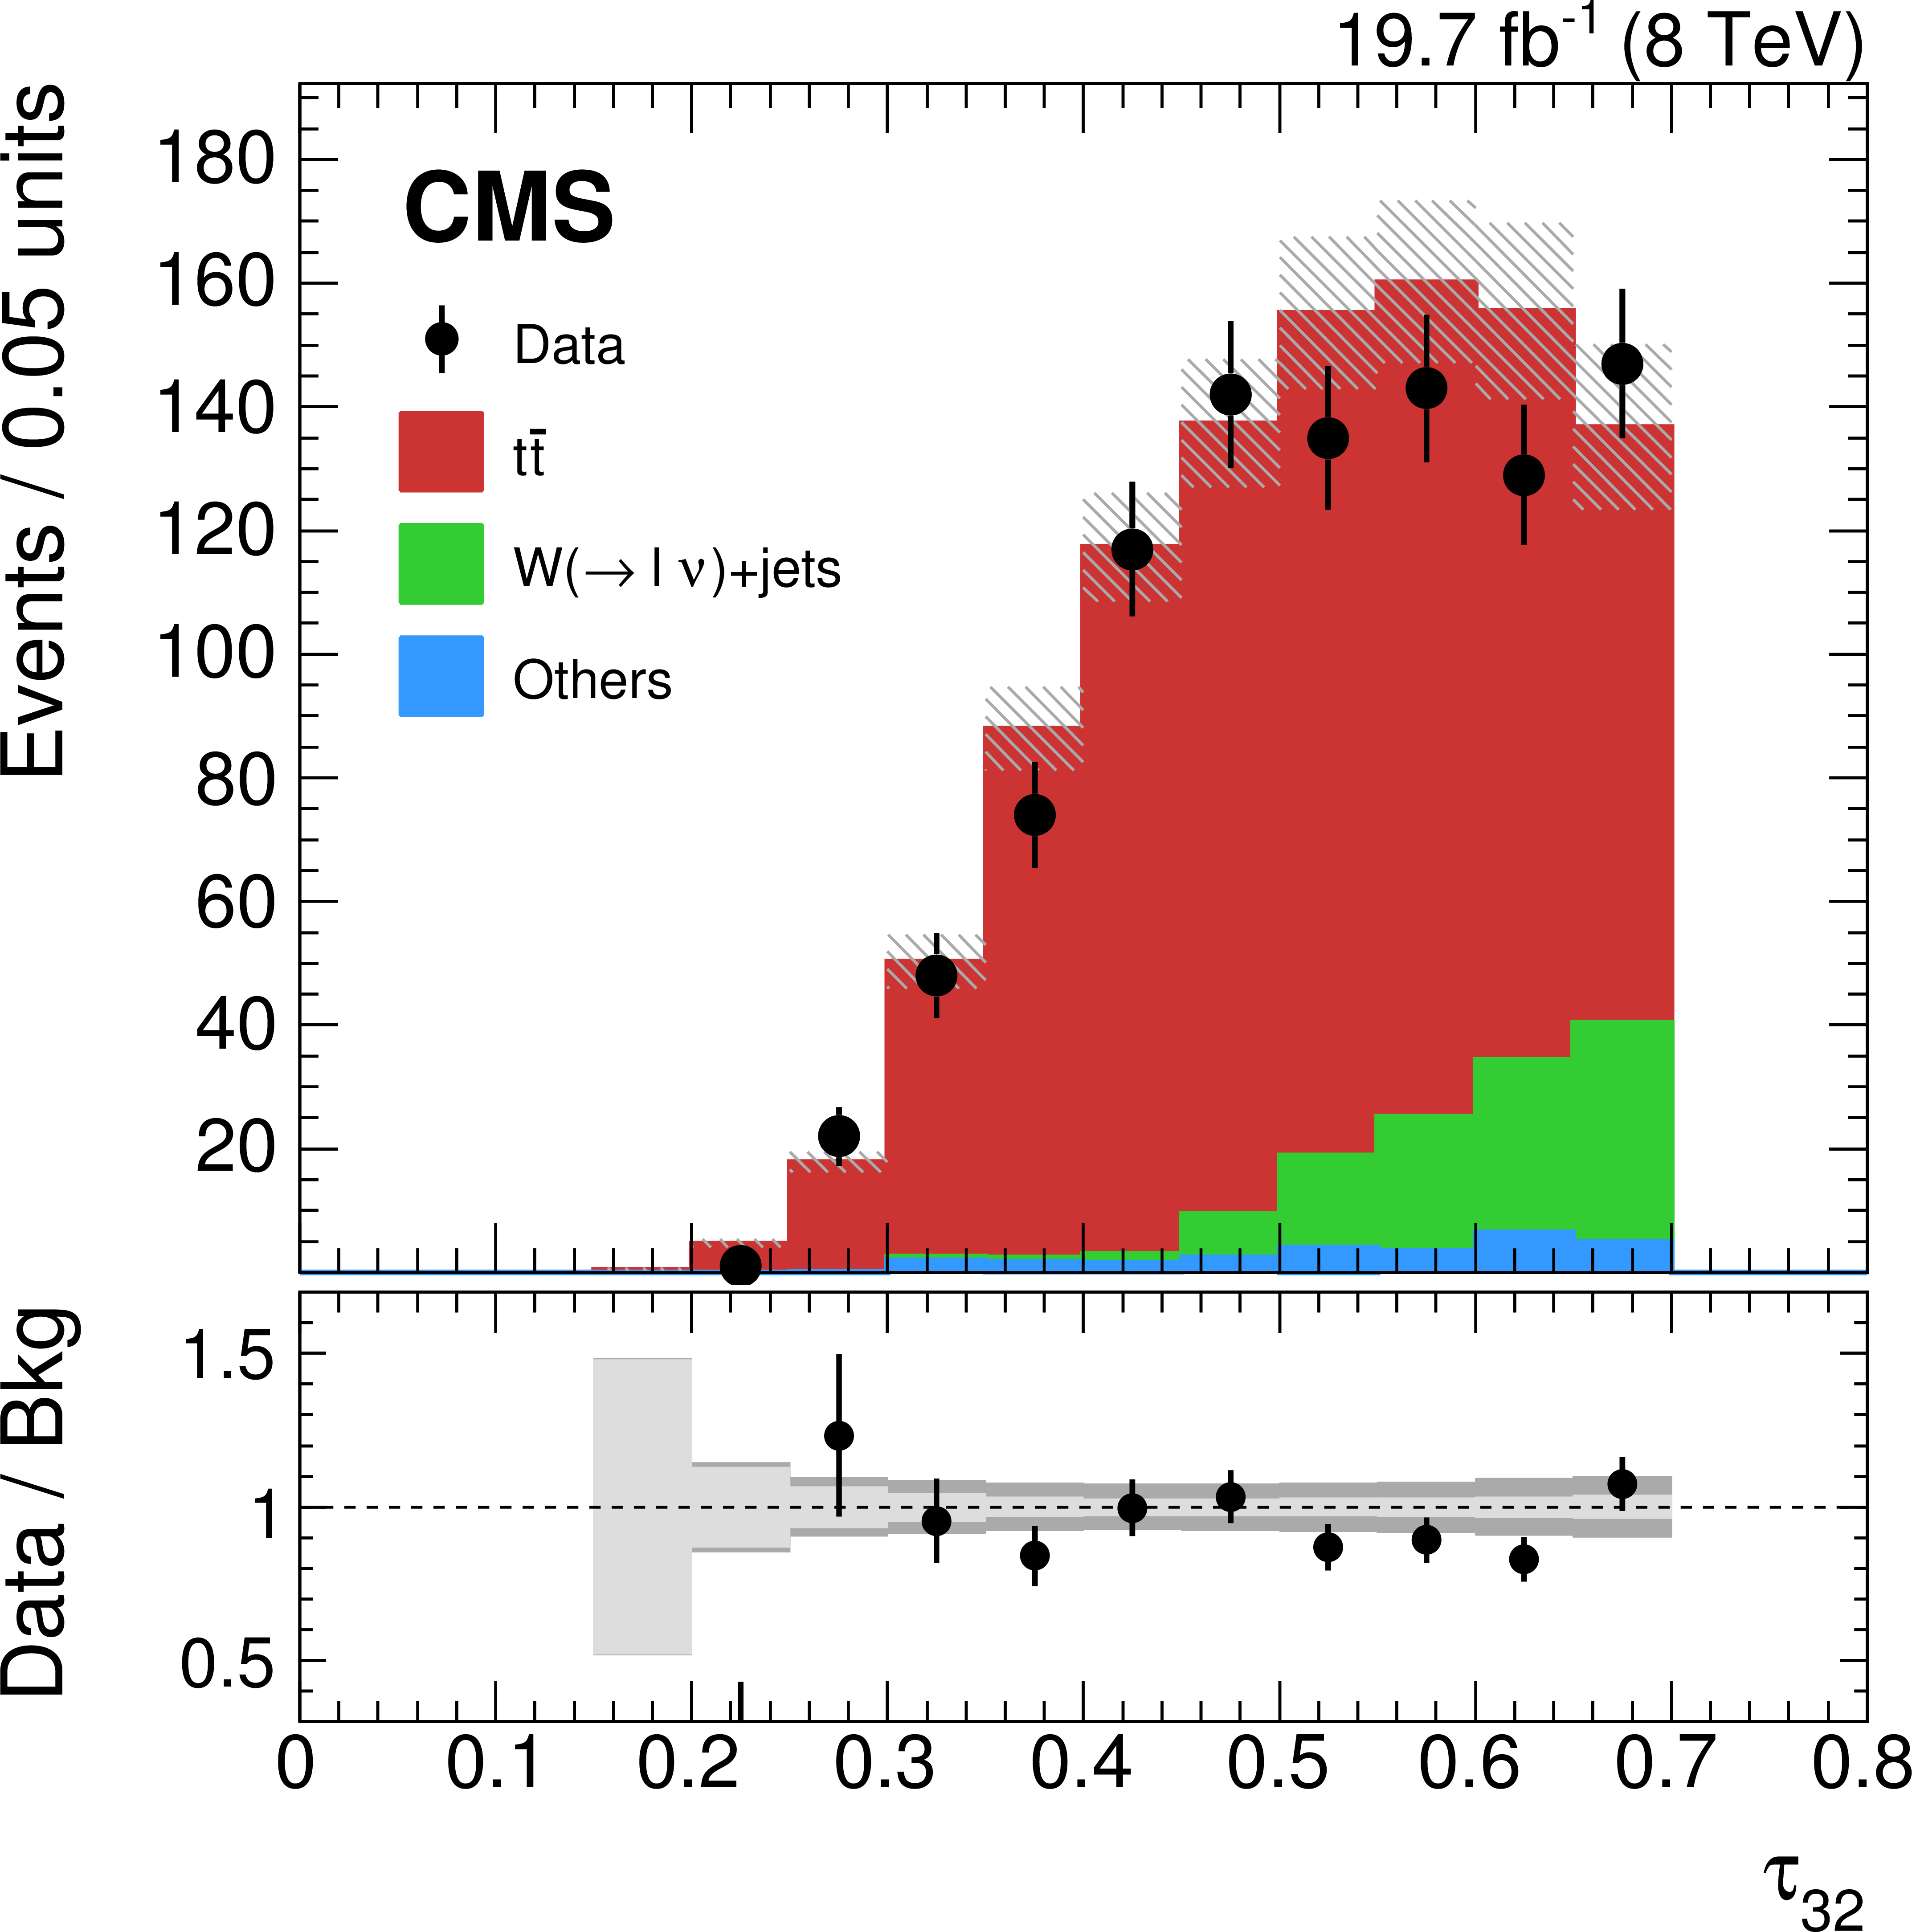
Figure 5-c:
Distributions of the jet mass (a), minimum pairwise mass $ {M_{\text {min}}} $ (b), and the ratio $\tau _{32}$ (c) for CA8 $ {\mathrm {t}}$-tagged jets in the lepton+jets channel. The SM backgrounds are scaled by a factor derived from the maximum likelihood fit to data as explained in Section {sec:background}. The uncertainty associated with the background expectation includes all the statistical and systematic uncertainties. The data-to-background ratio is shown in the bottom panel of each figure. For the ratio plot, the statistical uncertainty is shown in light gray, while the total uncertainty, which is the quadratic sum of the statistical and systematic uncertainties, is shown in dark gray. |
png pdf |
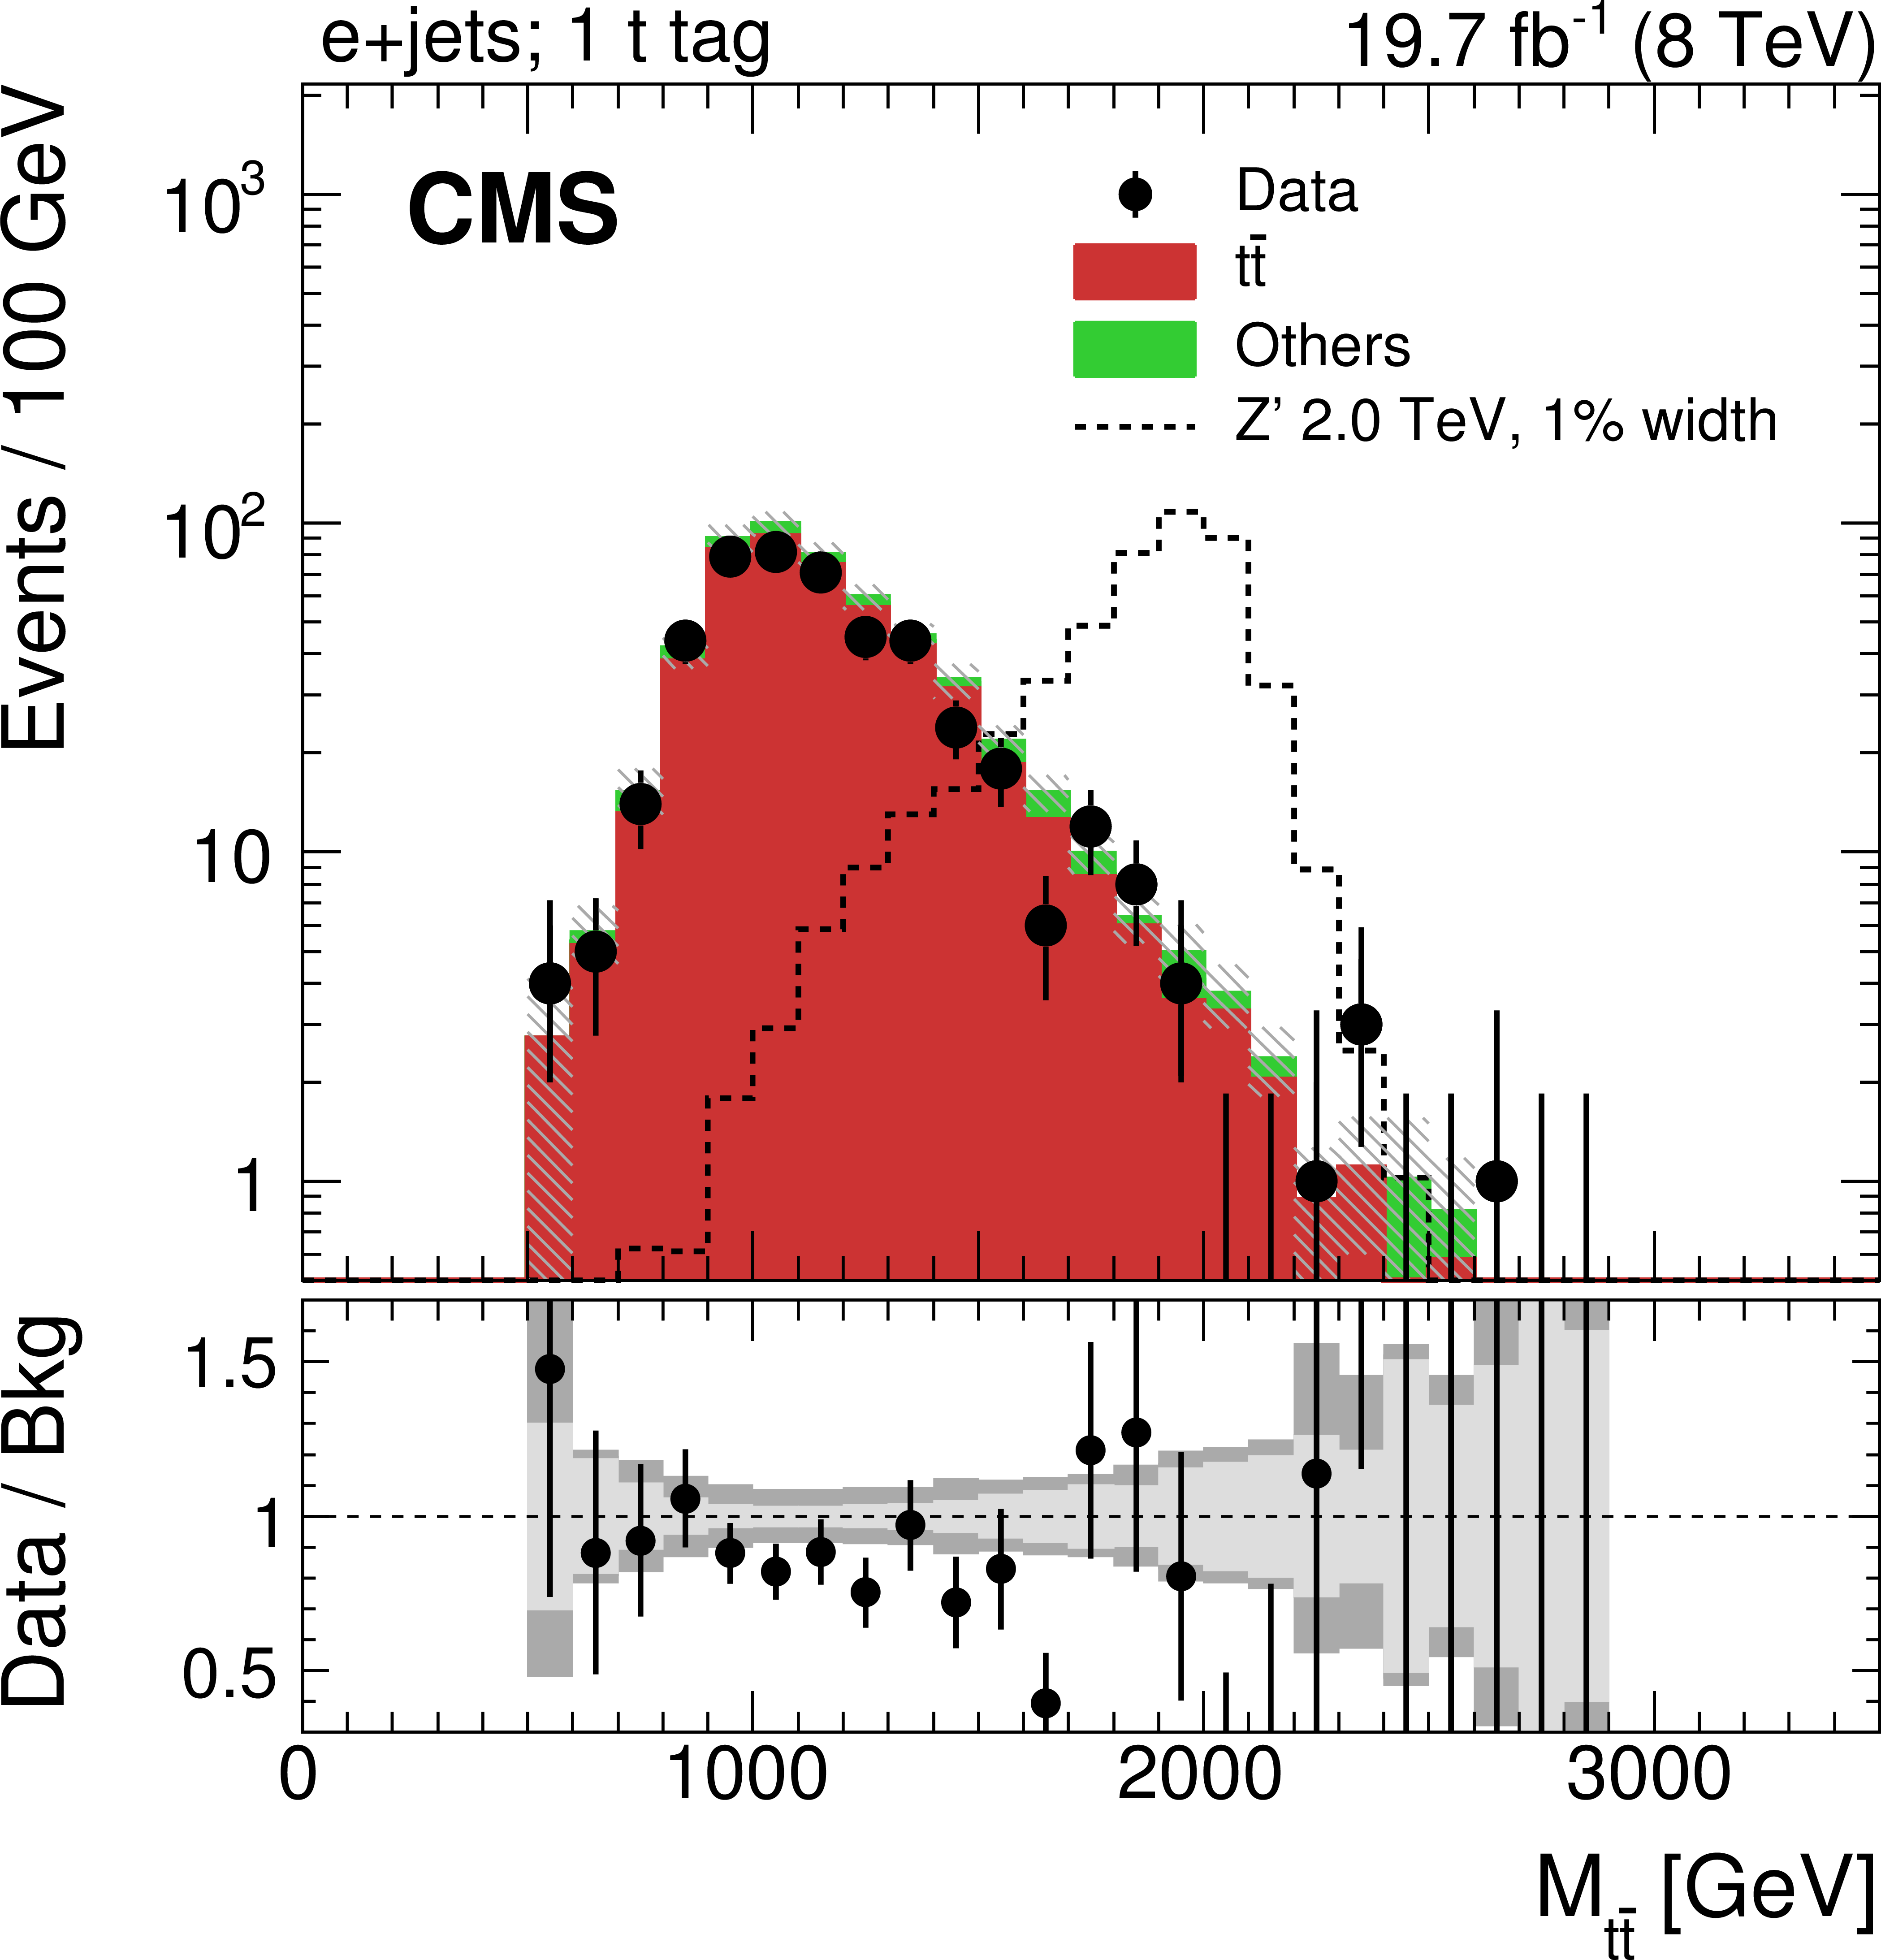
Figure 6-a:
Invariant mass of the reconstructed $ {\mathrm {t}\overline {\mathrm {t}}} $ pair in data and simulation in the electron+jets (a,c,e) and muon+jets (b,d,f) channels. Events are separated into three categories: one CA8 $ {\mathrm {t}}$-tagged jet (a,b), no CA8 $ {\mathrm {t}}$-tagged jet and at least one $ {\mathrm {b}}$ tag (c,d), and no CA8 $ {\mathrm {t}}$-tagged jet and no $ {\mathrm {b}}$ tag (e,f). Each background process is scaled by a factor derived from the maximum likelihood fit to data as explained in Section "Backgrounds". The expected distribution from a Z' signal with $ {M_{ {\mathrm {Z}^\prime } }} =$ 2 TeV and $ {\Gamma _{ {\mathrm {Z}^\prime } }/M_{ {\mathrm {Z}^\prime } }} =$ 0.01, normalized to a cross section of 1 pb, is also shown. The uncertainty associated with the background expectation includes all statistical and systematic uncertainties. The data-to-background ratio is shown in the bottom panel of each figure. For the ratio plot, the statistical uncertainty is shown in light gray, while the total uncertainty, which is the quadratic sum of the statistical and systematic uncertainties, is shown in dark gray. |
png pdf |
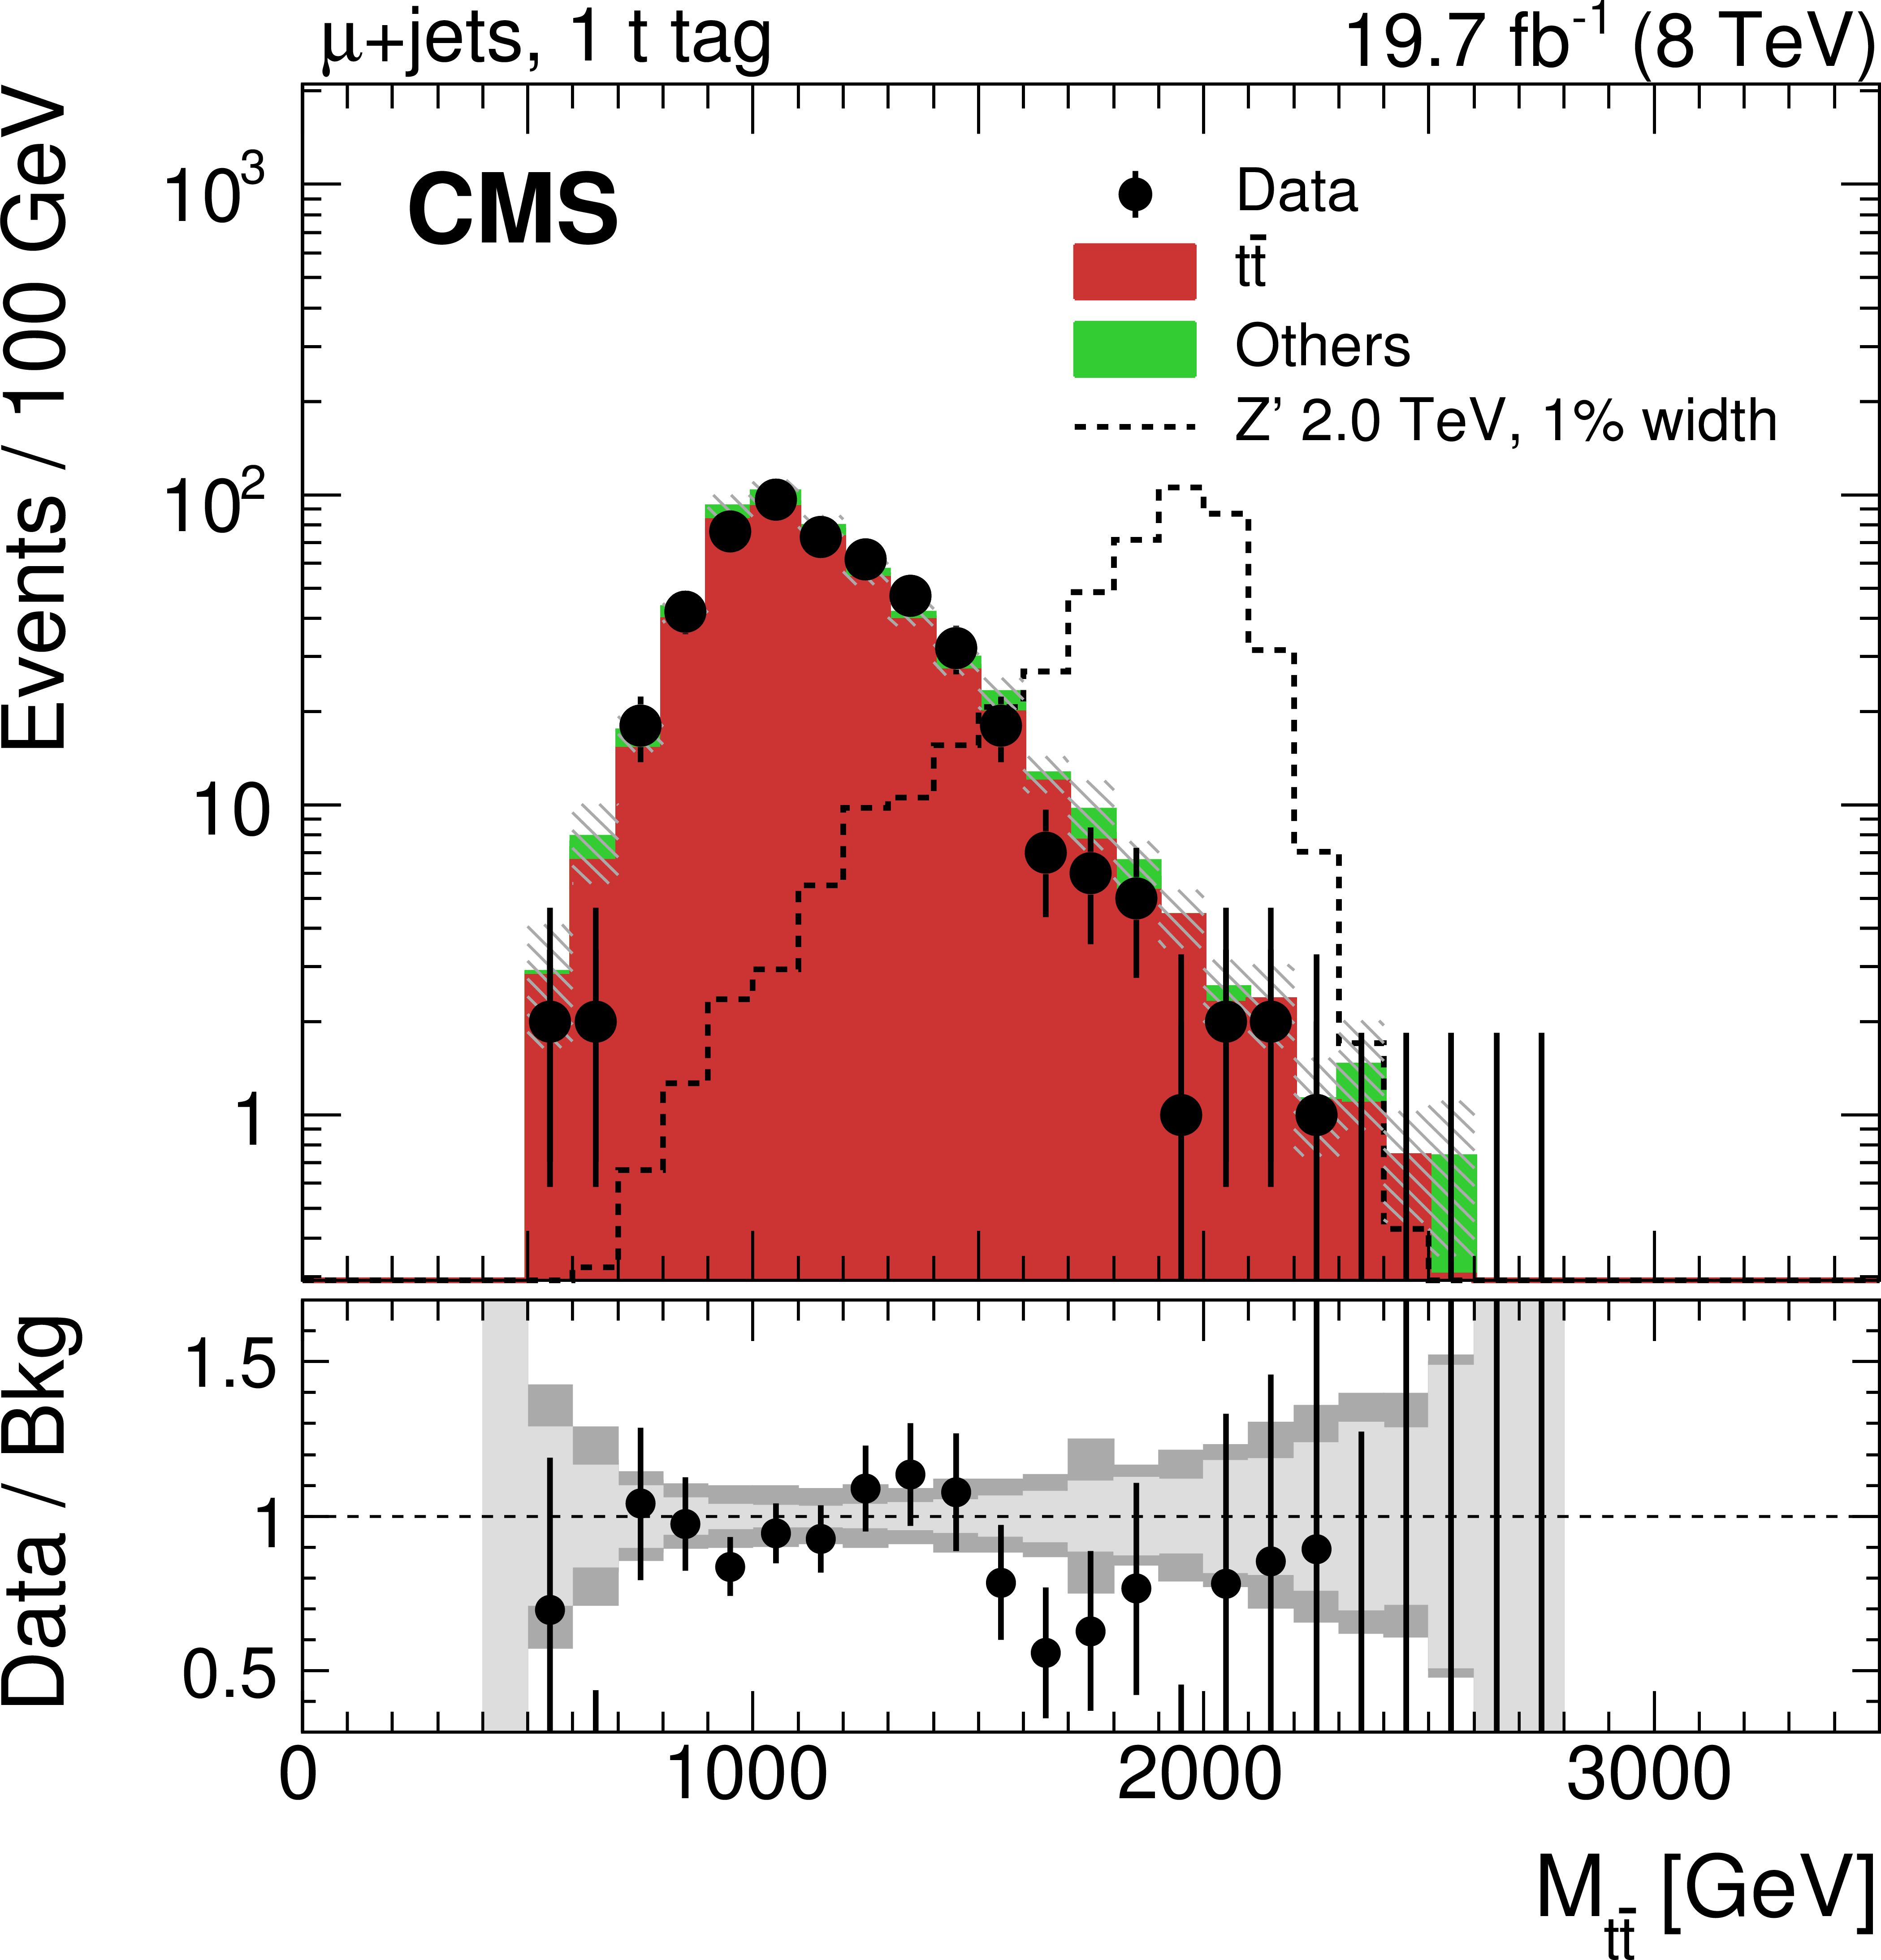
Figure 6-b:
Invariant mass of the reconstructed $ {\mathrm {t}\overline {\mathrm {t}}} $ pair in data and simulation in the electron+jets (a,c,e) and muon+jets (b,d,f) channels. Events are separated into three categories: one CA8 $ {\mathrm {t}}$-tagged jet (a,b), no CA8 $ {\mathrm {t}}$-tagged jet and at least one $ {\mathrm {b}}$ tag (c,d), and no CA8 $ {\mathrm {t}}$-tagged jet and no $ {\mathrm {b}}$ tag (e,f). Each background process is scaled by a factor derived from the maximum likelihood fit to data as explained in Section "Backgrounds". The expected distribution from a Z' signal with $ {M_{ {\mathrm {Z}^\prime } }} =$ 2 TeV and $ {\Gamma _{ {\mathrm {Z}^\prime } }/M_{ {\mathrm {Z}^\prime } }} =$ 0.01, normalized to a cross section of 1 pb, is also shown. The uncertainty associated with the background expectation includes all statistical and systematic uncertainties. The data-to-background ratio is shown in the bottom panel of each figure. For the ratio plot, the statistical uncertainty is shown in light gray, while the total uncertainty, which is the quadratic sum of the statistical and systematic uncertainties, is shown in dark gray. |
png pdf |
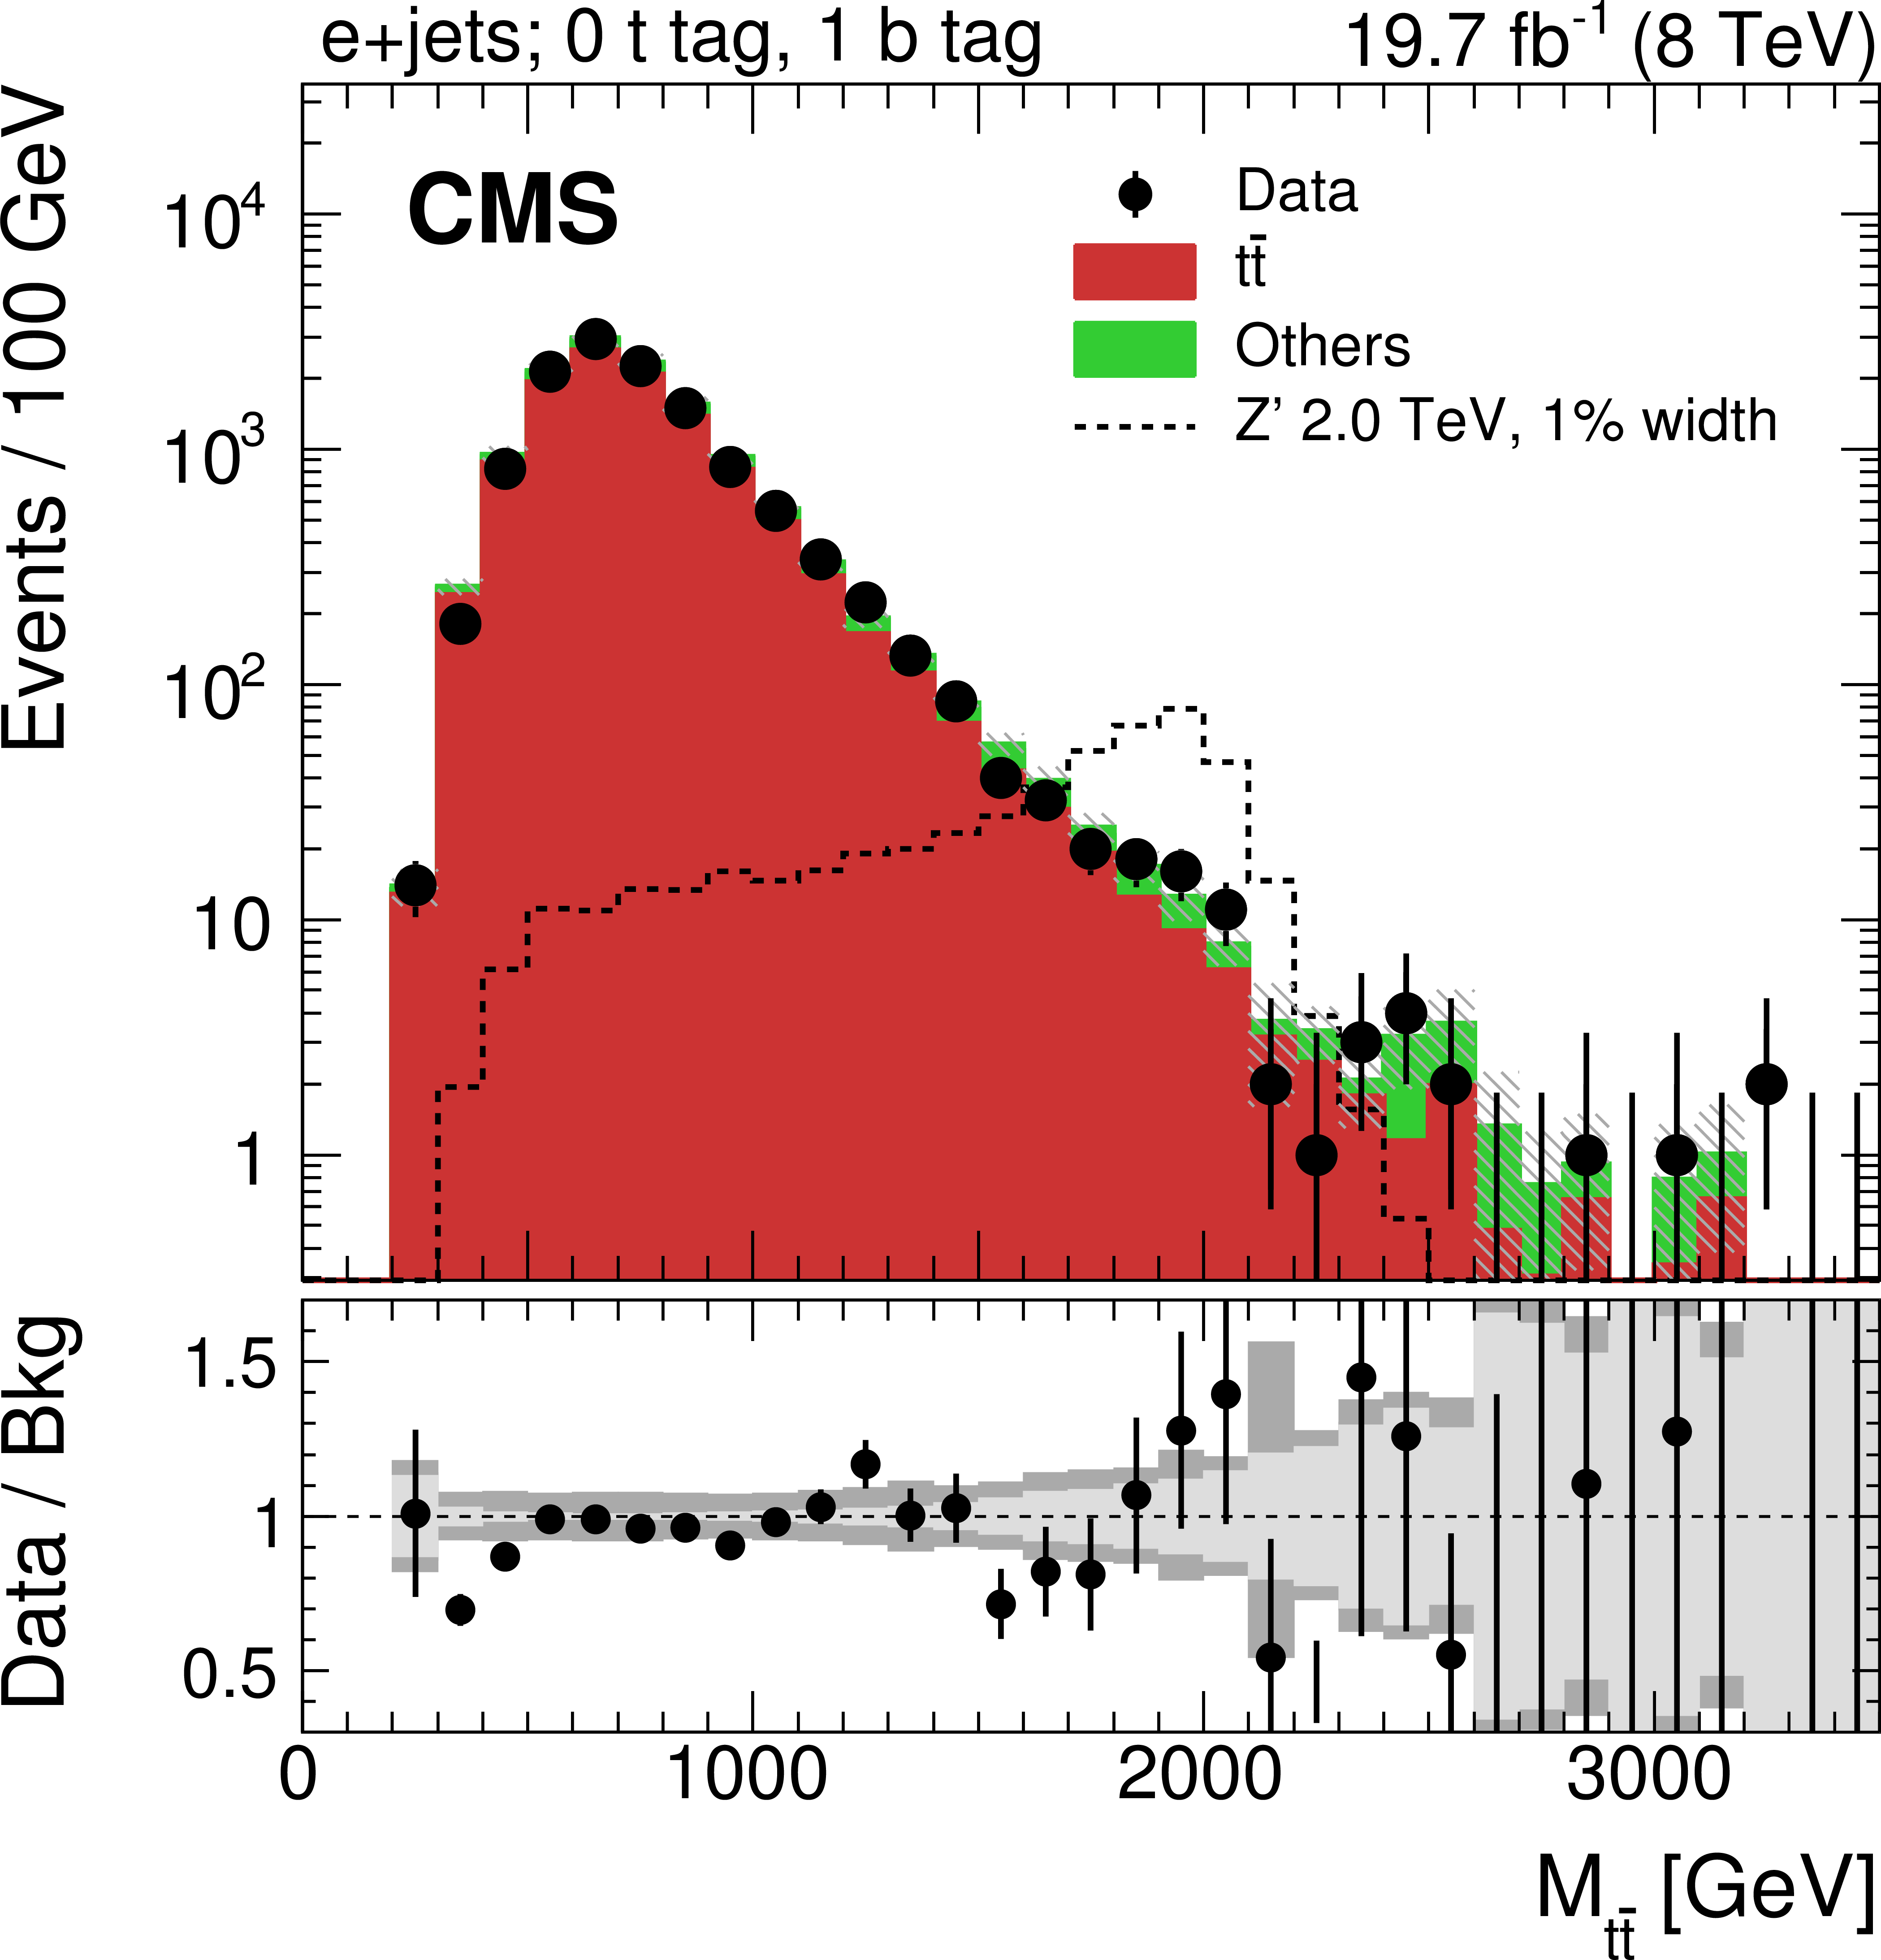
Figure 6-c:
Invariant mass of the reconstructed $ {\mathrm {t}\overline {\mathrm {t}}} $ pair in data and simulation in the electron+jets (a,c,e) and muon+jets (b,d,f) channels. Events are separated into three categories: one CA8 $ {\mathrm {t}}$-tagged jet (a,b), no CA8 $ {\mathrm {t}}$-tagged jet and at least one $ {\mathrm {b}}$ tag (c,d), and no CA8 $ {\mathrm {t}}$-tagged jet and no $ {\mathrm {b}}$ tag (e,f). Each background process is scaled by a factor derived from the maximum likelihood fit to data as explained in Section "Backgrounds". The expected distribution from a Z' signal with $ {M_{ {\mathrm {Z}^\prime } }} =$ 2 TeV and $ {\Gamma _{ {\mathrm {Z}^\prime } }/M_{ {\mathrm {Z}^\prime } }} =$ 0.01, normalized to a cross section of 1 pb, is also shown. The uncertainty associated with the background expectation includes all statistical and systematic uncertainties. The data-to-background ratio is shown in the bottom panel of each figure. For the ratio plot, the statistical uncertainty is shown in light gray, while the total uncertainty, which is the quadratic sum of the statistical and systematic uncertainties, is shown in dark gray. |
png pdf |
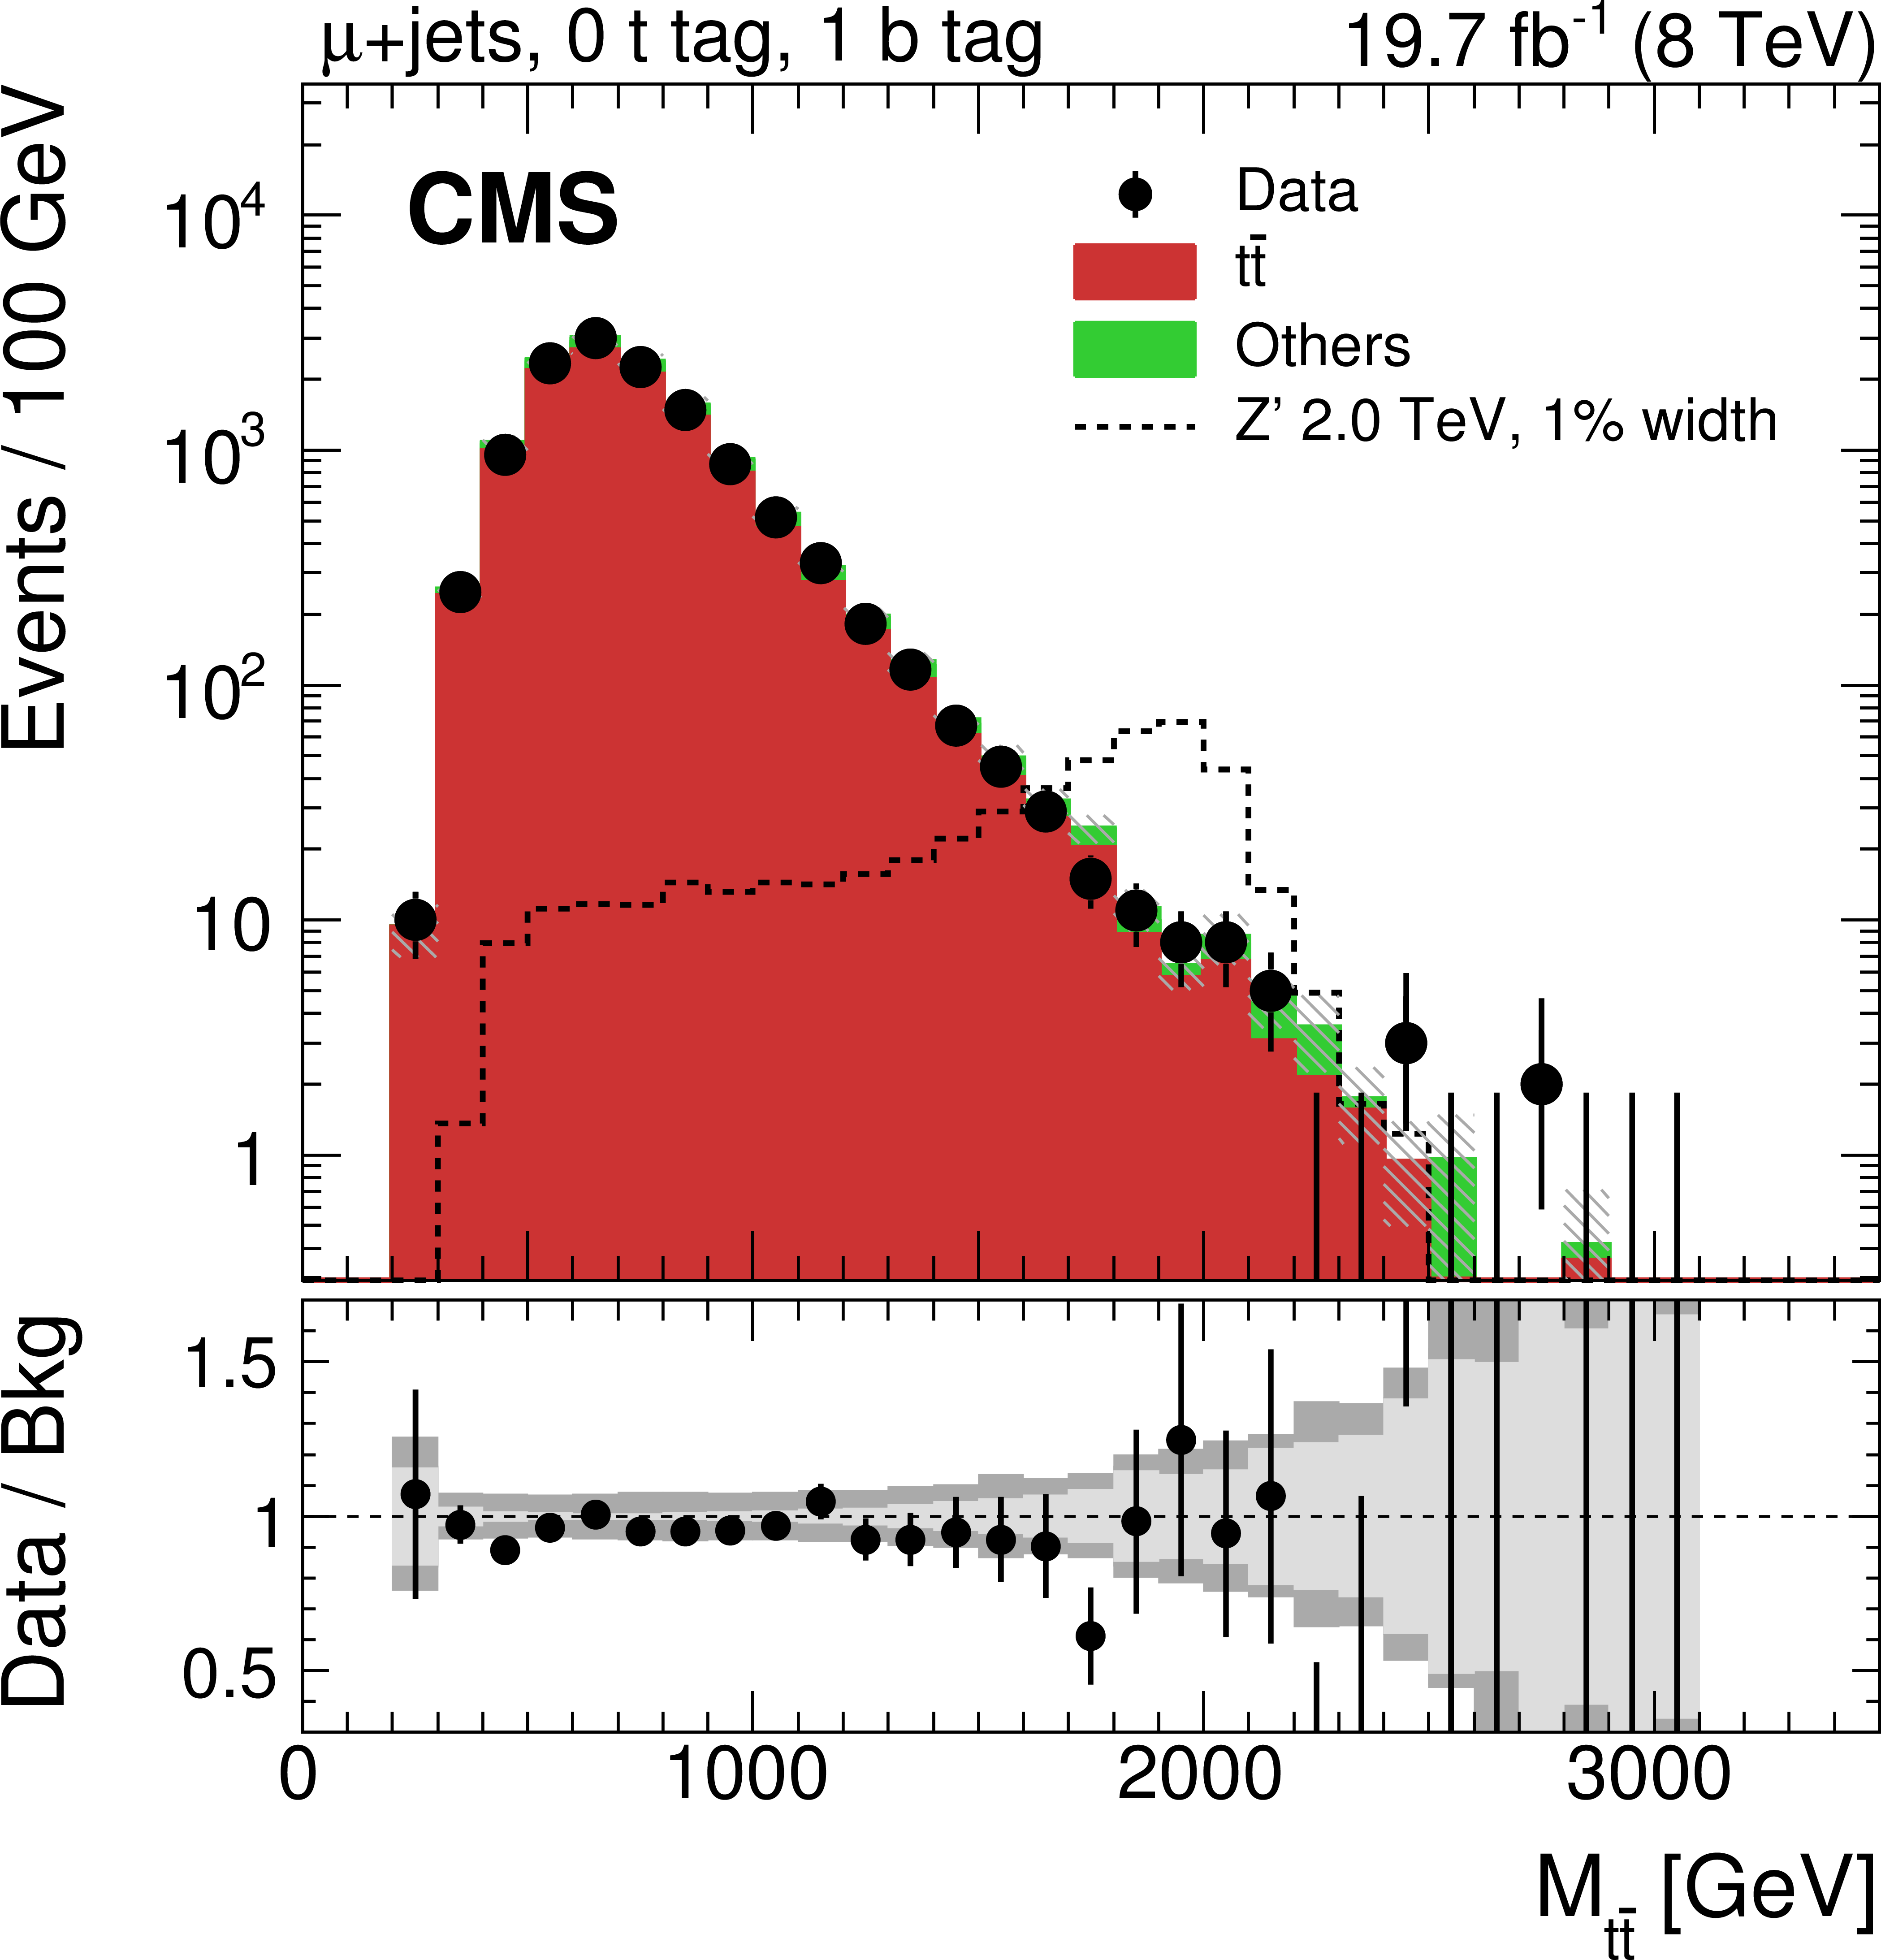
Figure 6-d:
Invariant mass of the reconstructed $ {\mathrm {t}\overline {\mathrm {t}}} $ pair in data and simulation in the electron+jets (a,c,e) and muon+jets (b,d,f) channels. Events are separated into three categories: one CA8 $ {\mathrm {t}}$-tagged jet (a,b), no CA8 $ {\mathrm {t}}$-tagged jet and at least one $ {\mathrm {b}}$ tag (c,d), and no CA8 $ {\mathrm {t}}$-tagged jet and no $ {\mathrm {b}}$ tag (e,f). Each background process is scaled by a factor derived from the maximum likelihood fit to data as explained in Section "Backgrounds". The expected distribution from a Z' signal with $ {M_{ {\mathrm {Z}^\prime } }} =$ 2 TeV and $ {\Gamma _{ {\mathrm {Z}^\prime } }/M_{ {\mathrm {Z}^\prime } }} =$ 0.01, normalized to a cross section of 1 pb, is also shown. The uncertainty associated with the background expectation includes all statistical and systematic uncertainties. The data-to-background ratio is shown in the bottom panel of each figure. For the ratio plot, the statistical uncertainty is shown in light gray, while the total uncertainty, which is the quadratic sum of the statistical and systematic uncertainties, is shown in dark gray. |
png pdf |
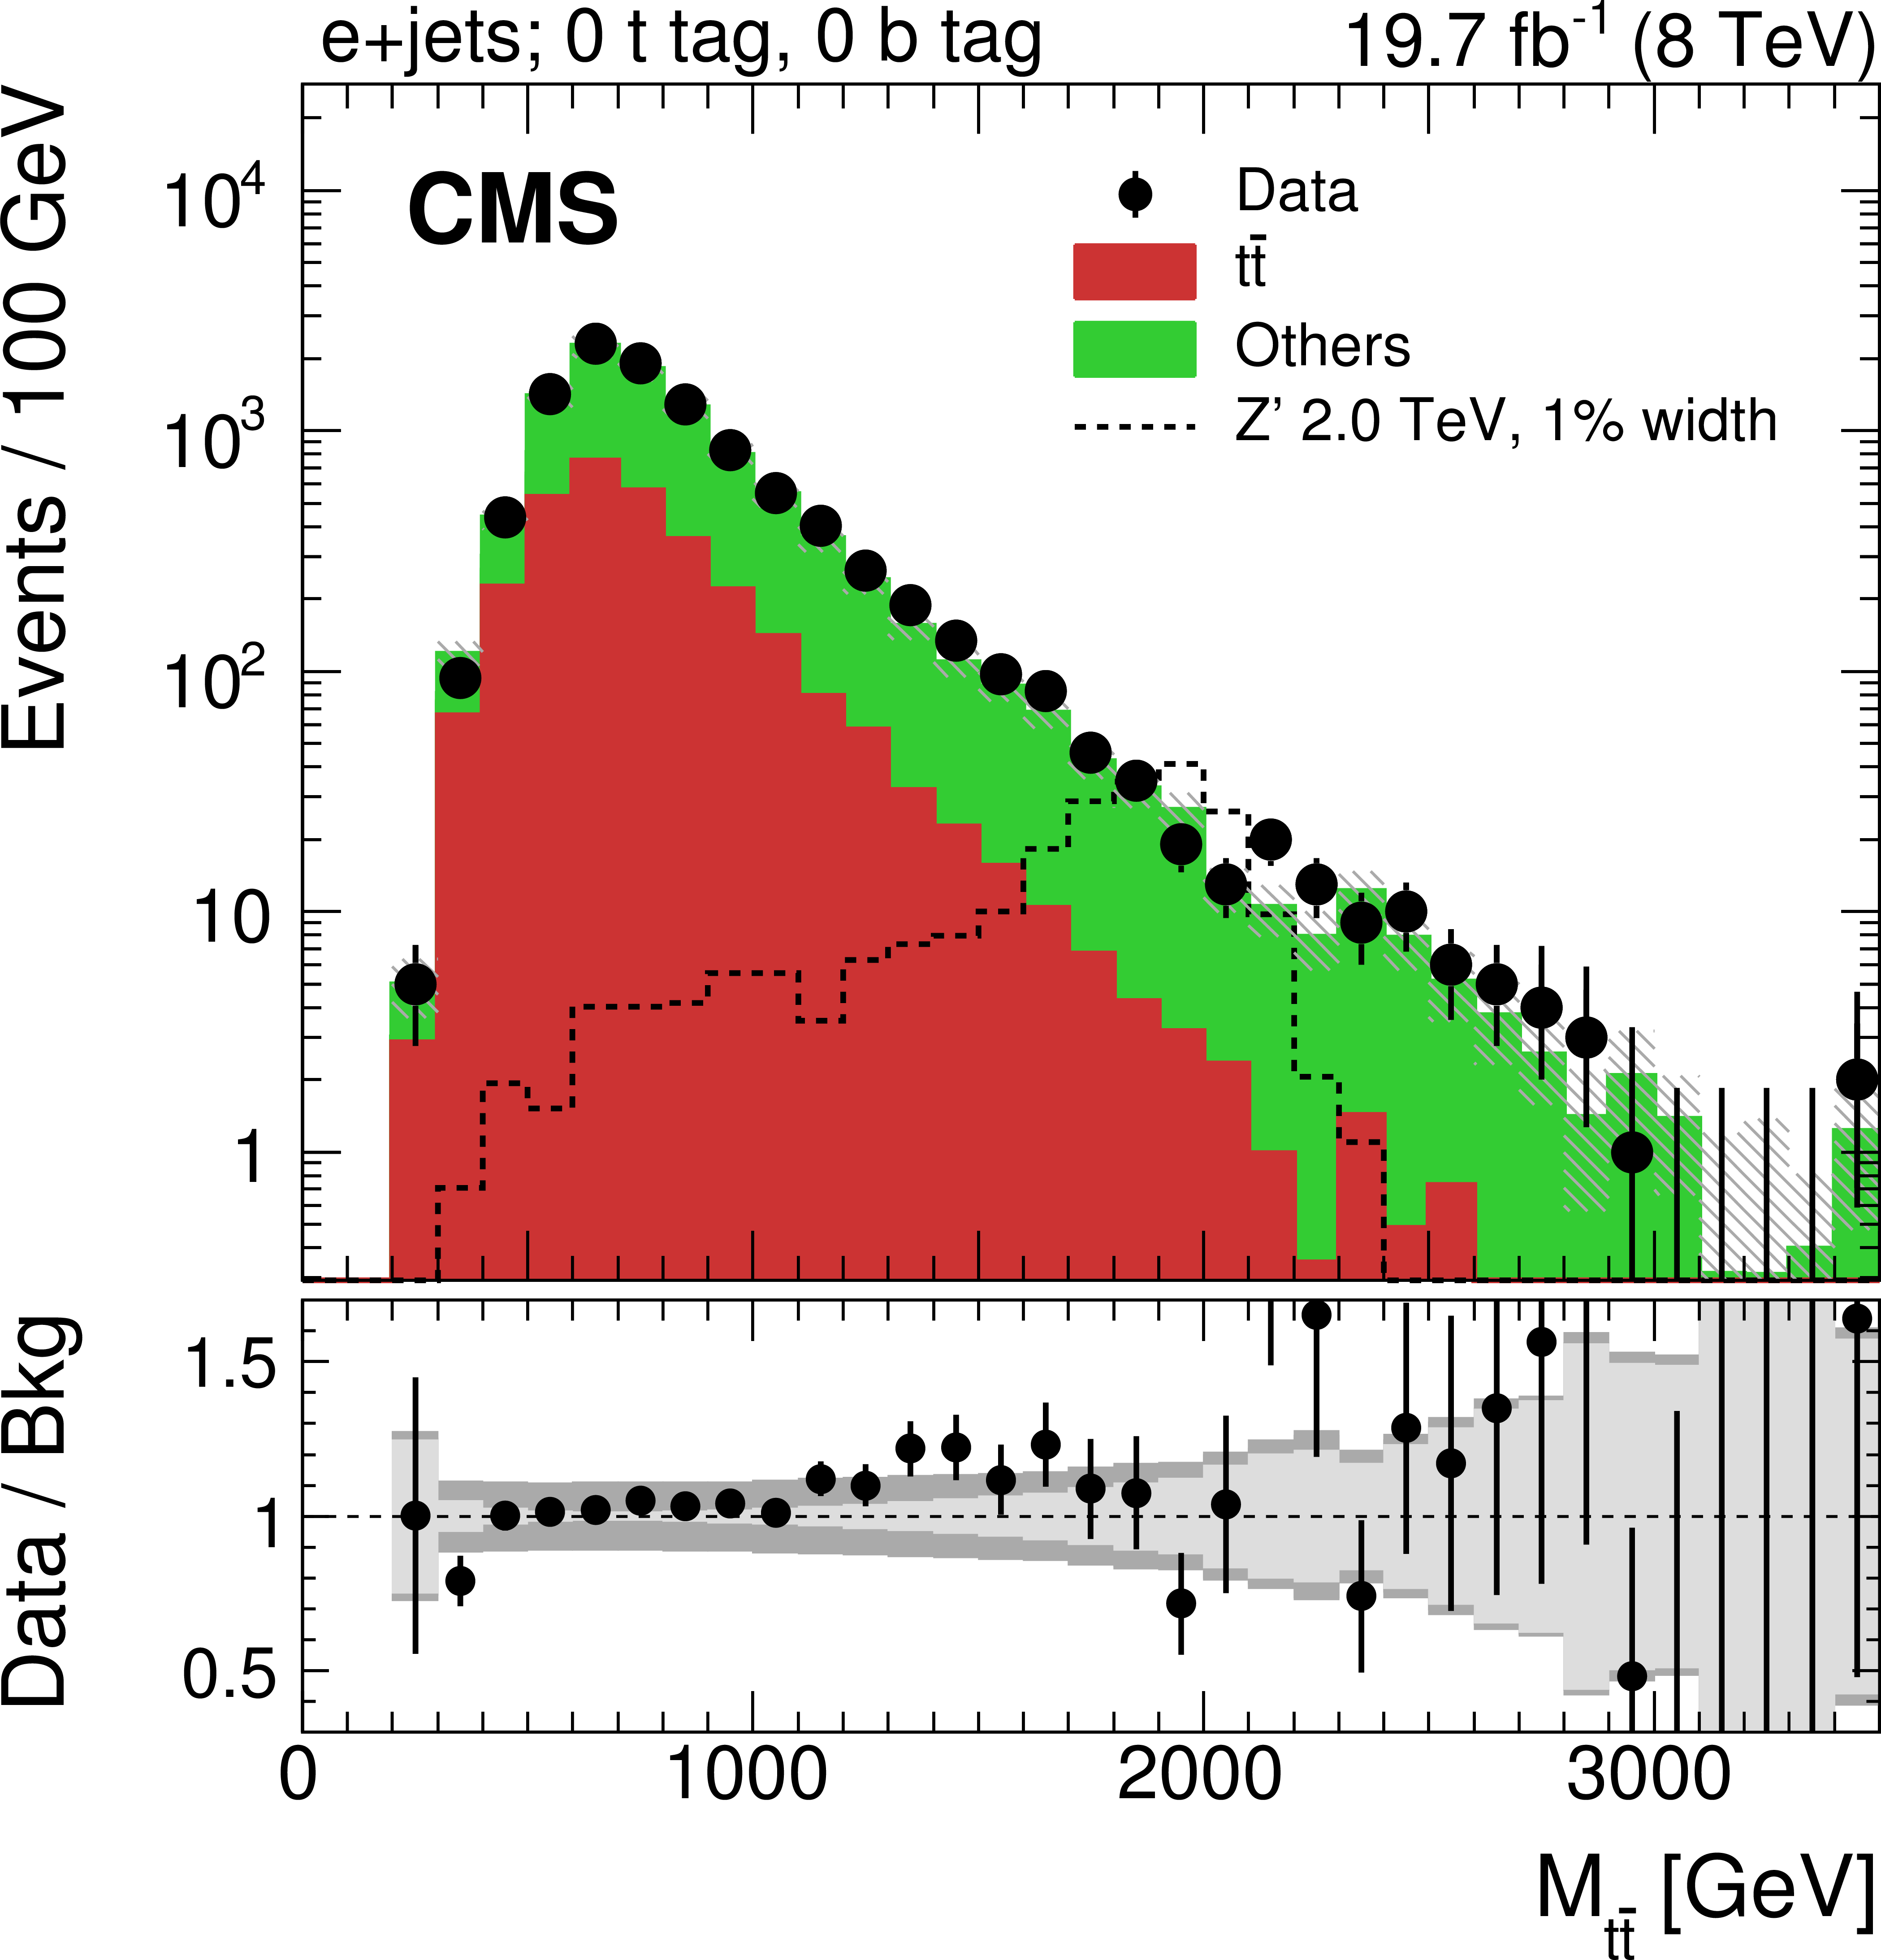
Figure 6-e:
Invariant mass of the reconstructed $ {\mathrm {t}\overline {\mathrm {t}}} $ pair in data and simulation in the electron+jets (a,c,e) and muon+jets (b,d,f) channels. Events are separated into three categories: one CA8 $ {\mathrm {t}}$-tagged jet (a,b), no CA8 $ {\mathrm {t}}$-tagged jet and at least one $ {\mathrm {b}}$ tag (c,d), and no CA8 $ {\mathrm {t}}$-tagged jet and no $ {\mathrm {b}}$ tag (e,f). Each background process is scaled by a factor derived from the maximum likelihood fit to data as explained in Section "Backgrounds". The expected distribution from a Z' signal with $ {M_{ {\mathrm {Z}^\prime } }} =$ 2 TeV and $ {\Gamma _{ {\mathrm {Z}^\prime } }/M_{ {\mathrm {Z}^\prime } }} =$ 0.01, normalized to a cross section of 1 pb, is also shown. The uncertainty associated with the background expectation includes all statistical and systematic uncertainties. The data-to-background ratio is shown in the bottom panel of each figure. For the ratio plot, the statistical uncertainty is shown in light gray, while the total uncertainty, which is the quadratic sum of the statistical and systematic uncertainties, is shown in dark gray. |
png pdf |
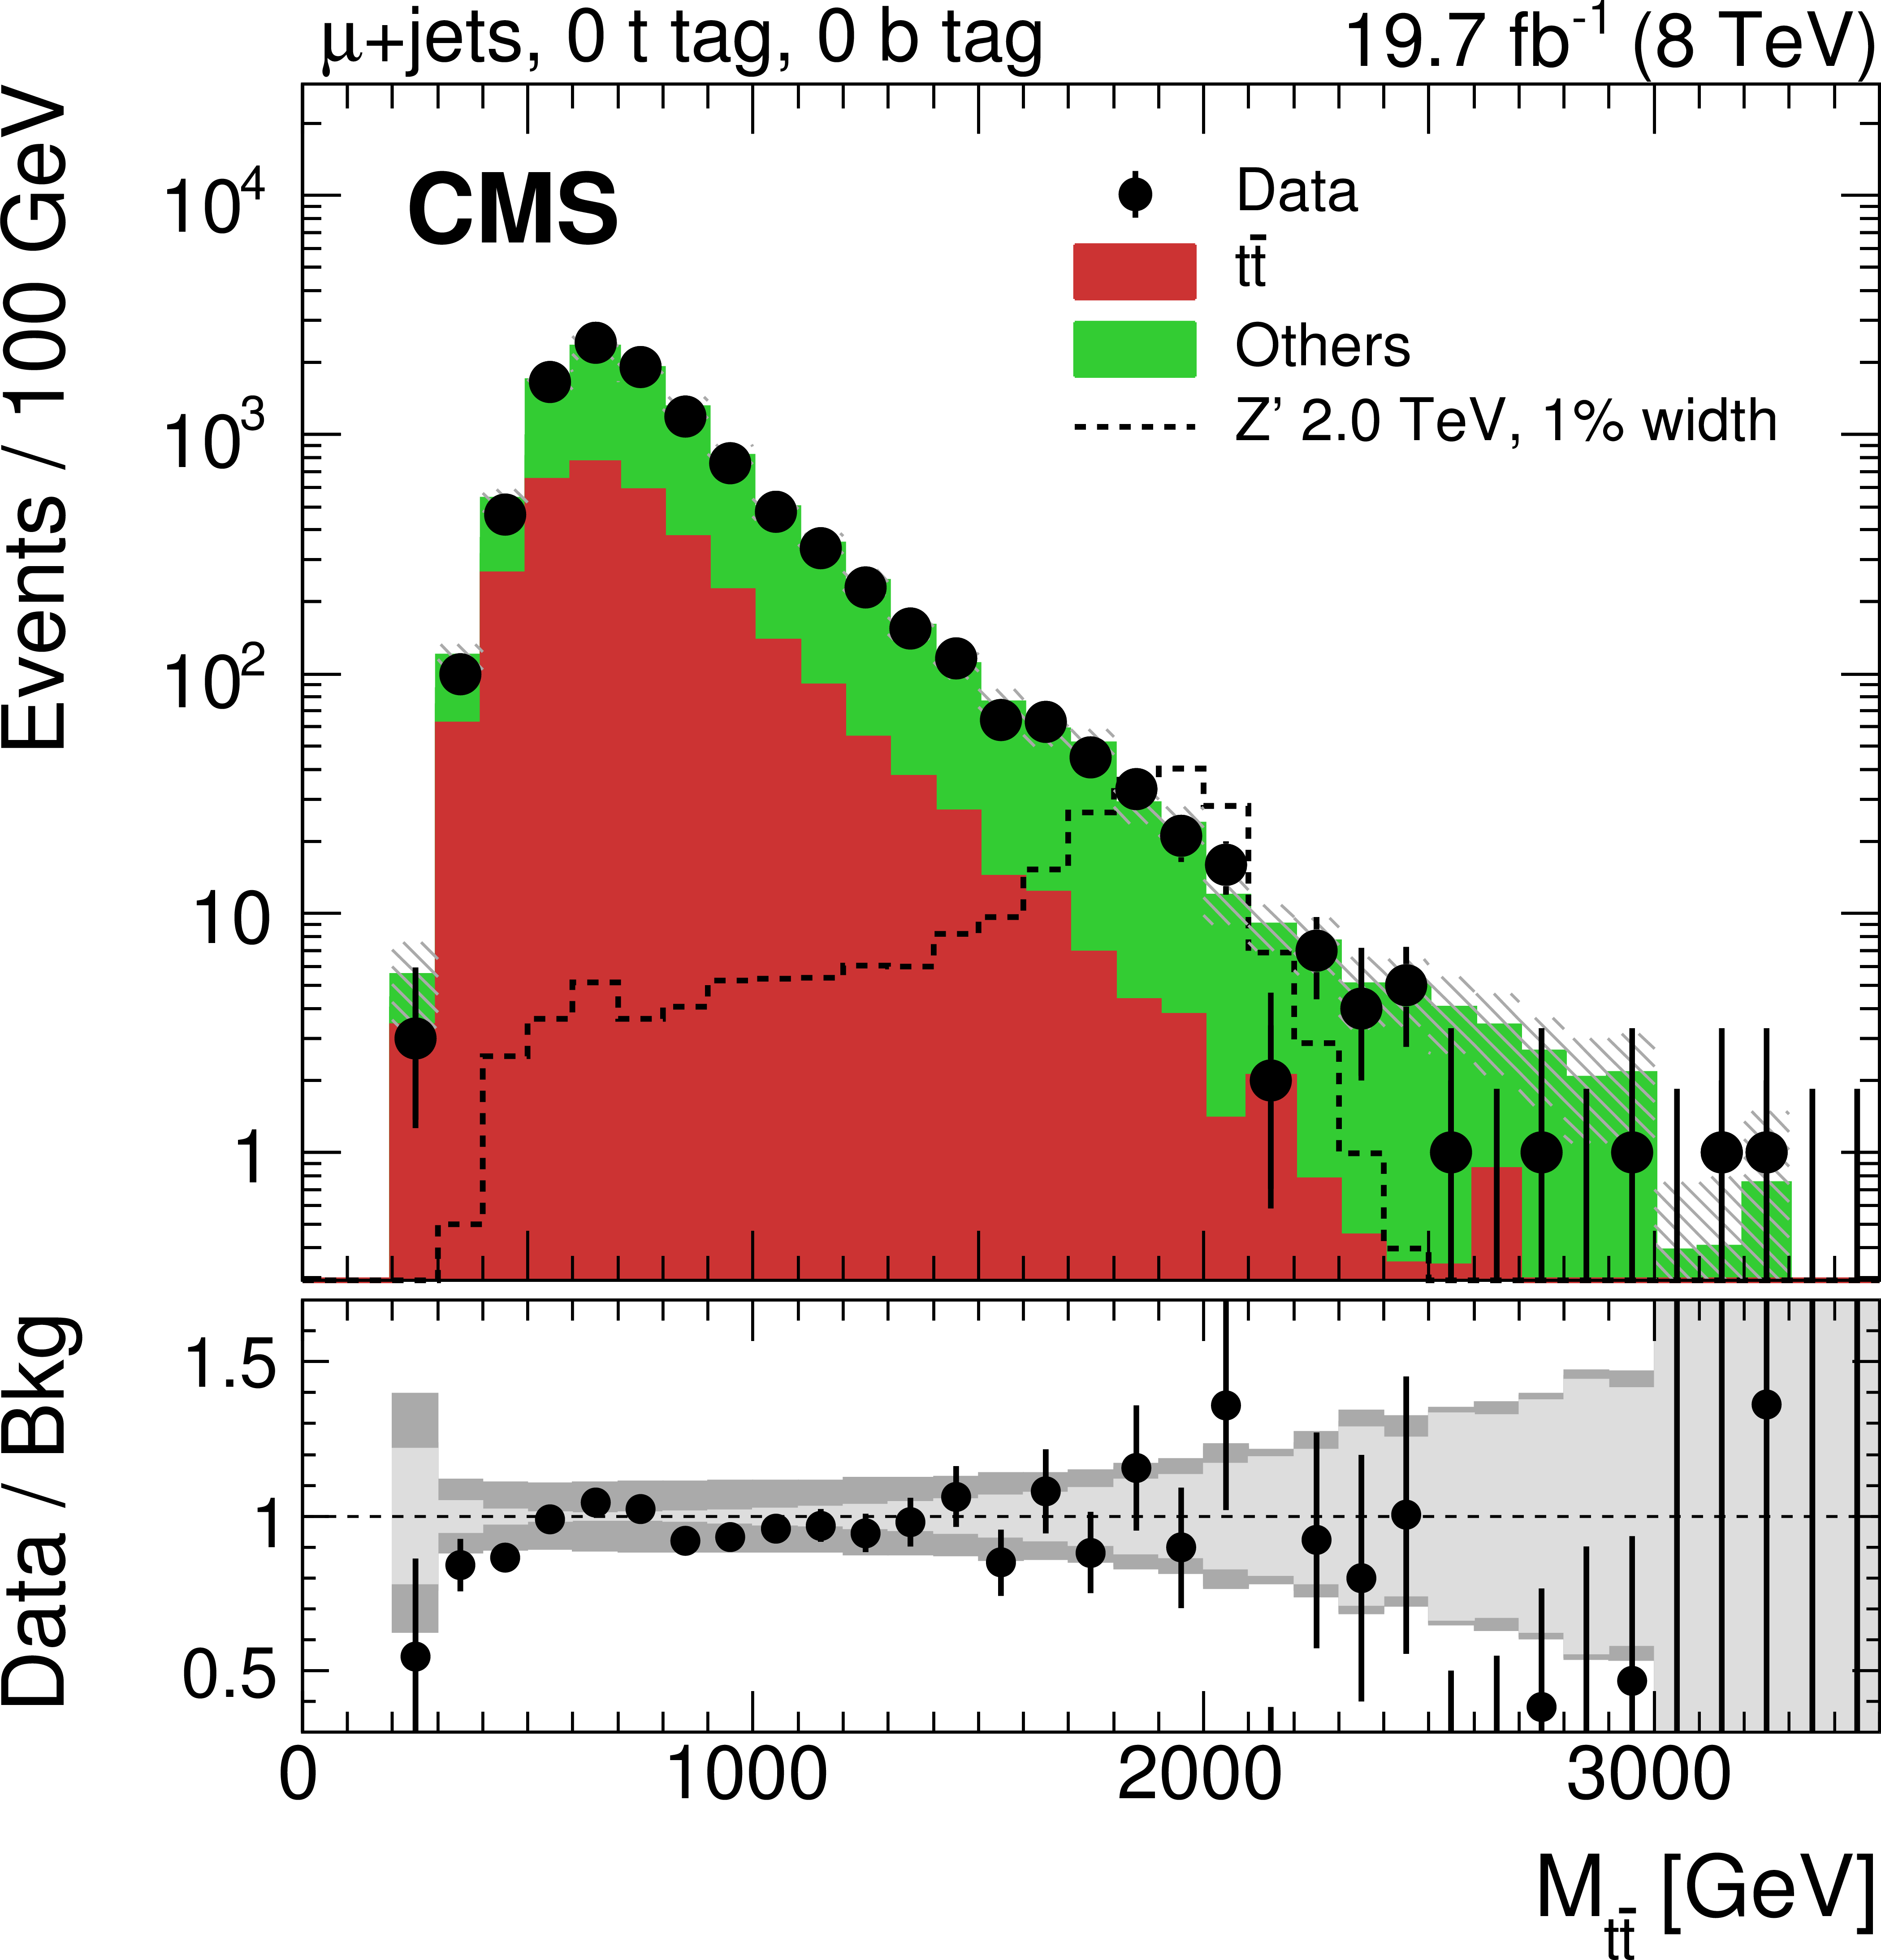
Figure 6-f:
Invariant mass of the reconstructed $ {\mathrm {t}\overline {\mathrm {t}}} $ pair in data and simulation in the electron+jets (a,c,e) and muon+jets (b,d,f) channels. Events are separated into three categories: one CA8 $ {\mathrm {t}}$-tagged jet (a,b), no CA8 $ {\mathrm {t}}$-tagged jet and at least one $ {\mathrm {b}}$ tag (c,d), and no CA8 $ {\mathrm {t}}$-tagged jet and no $ {\mathrm {b}}$ tag (e,f). Each background process is scaled by a factor derived from the maximum likelihood fit to data as explained in Section "Backgrounds". The expected distribution from a Z' signal with $ {M_{ {\mathrm {Z}^\prime } }} =$ 2 TeV and $ {\Gamma _{ {\mathrm {Z}^\prime } }/M_{ {\mathrm {Z}^\prime } }} =$ 0.01, normalized to a cross section of 1 pb, is also shown. The uncertainty associated with the background expectation includes all statistical and systematic uncertainties. The data-to-background ratio is shown in the bottom panel of each figure. For the ratio plot, the statistical uncertainty is shown in light gray, while the total uncertainty, which is the quadratic sum of the statistical and systematic uncertainties, is shown in dark gray. |
png pdf |
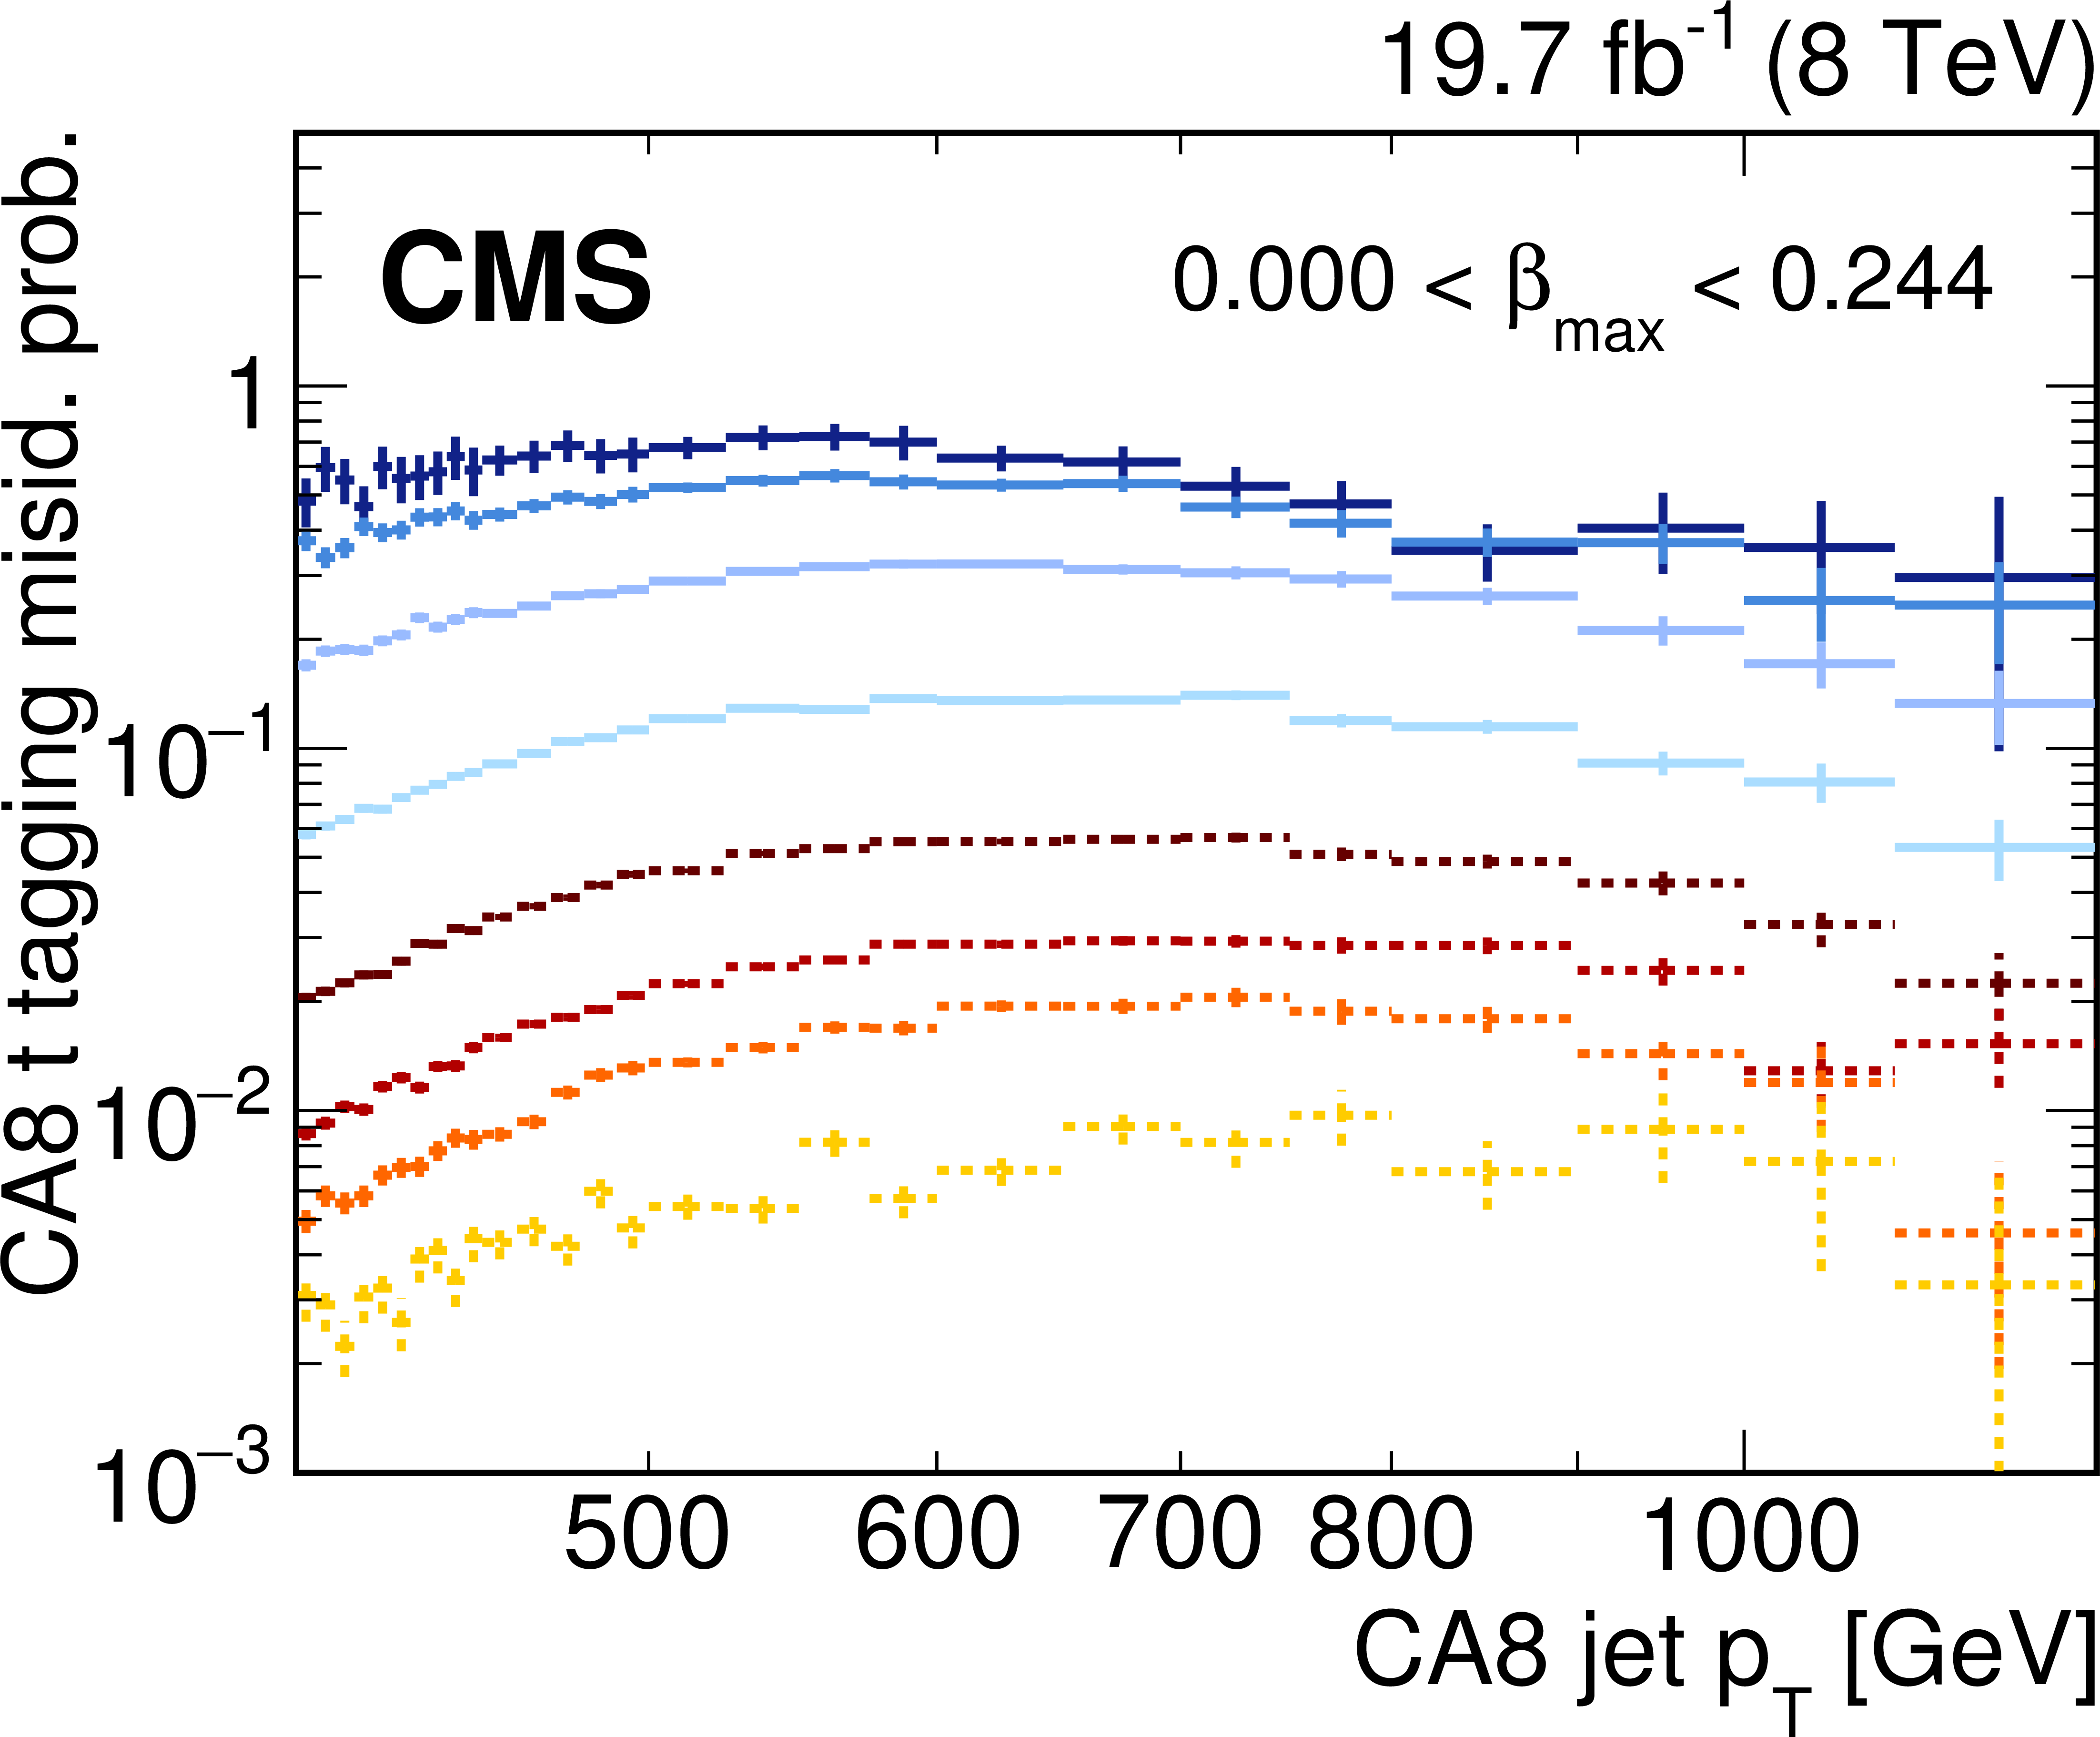
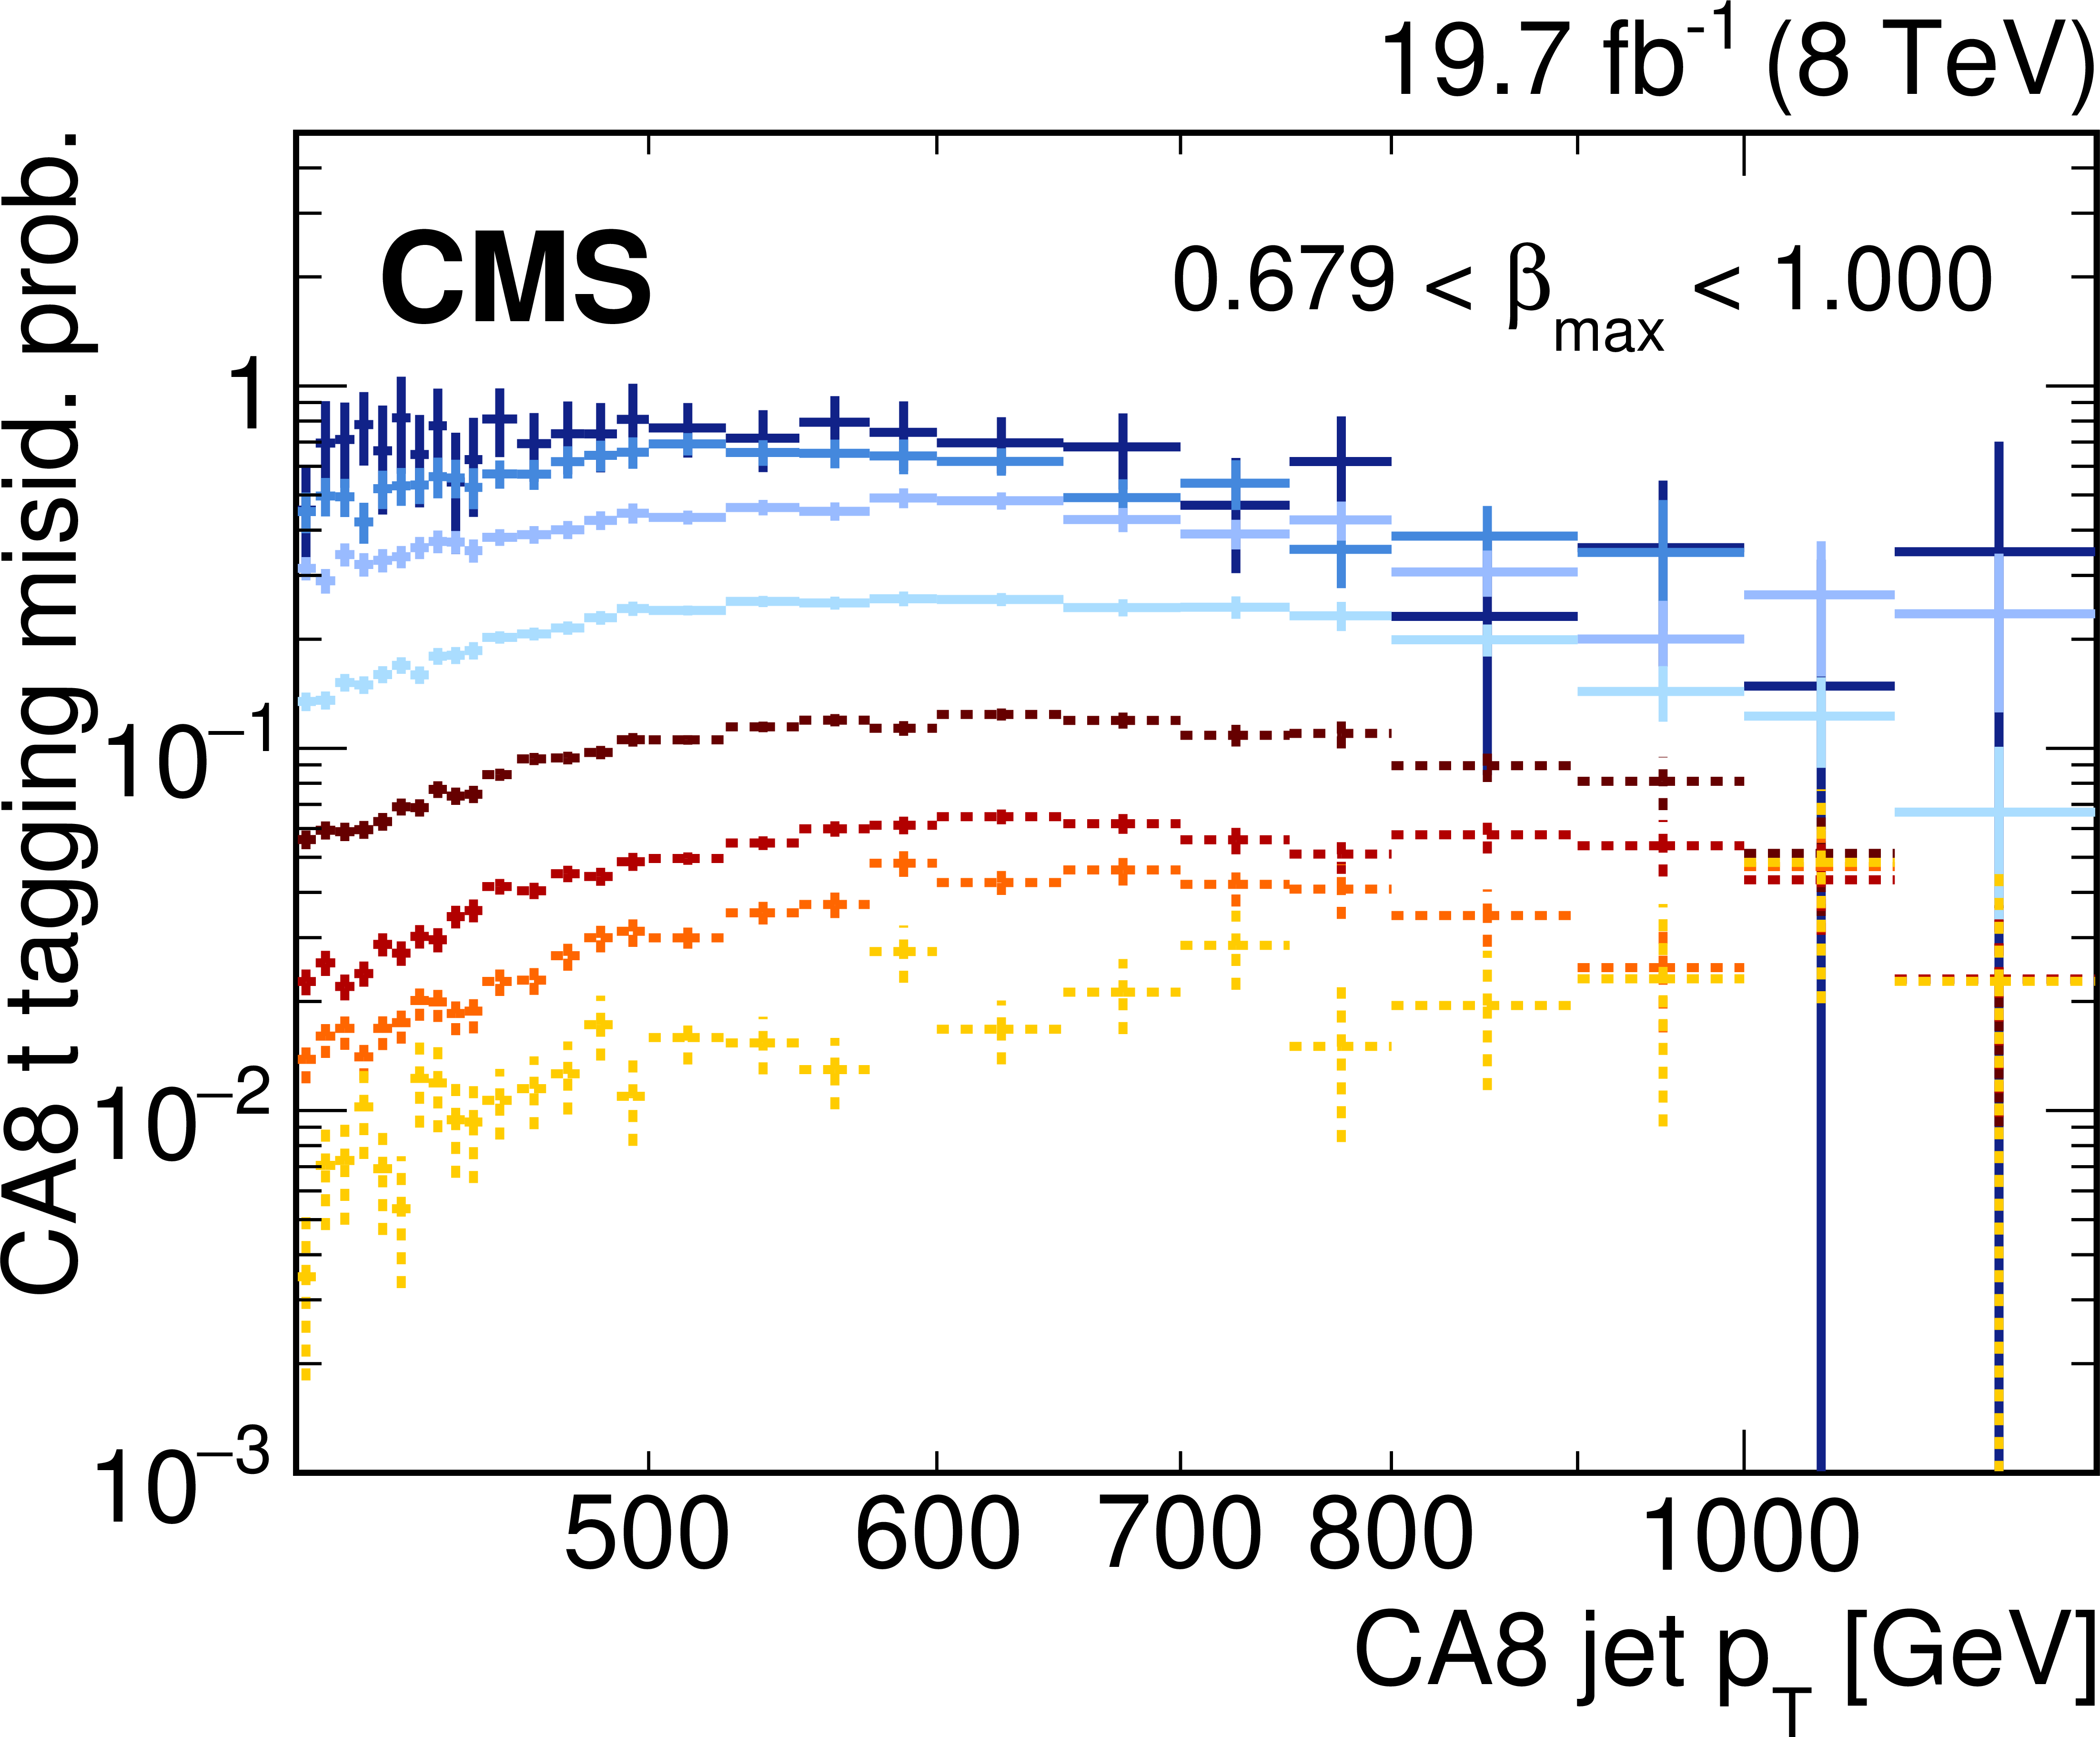
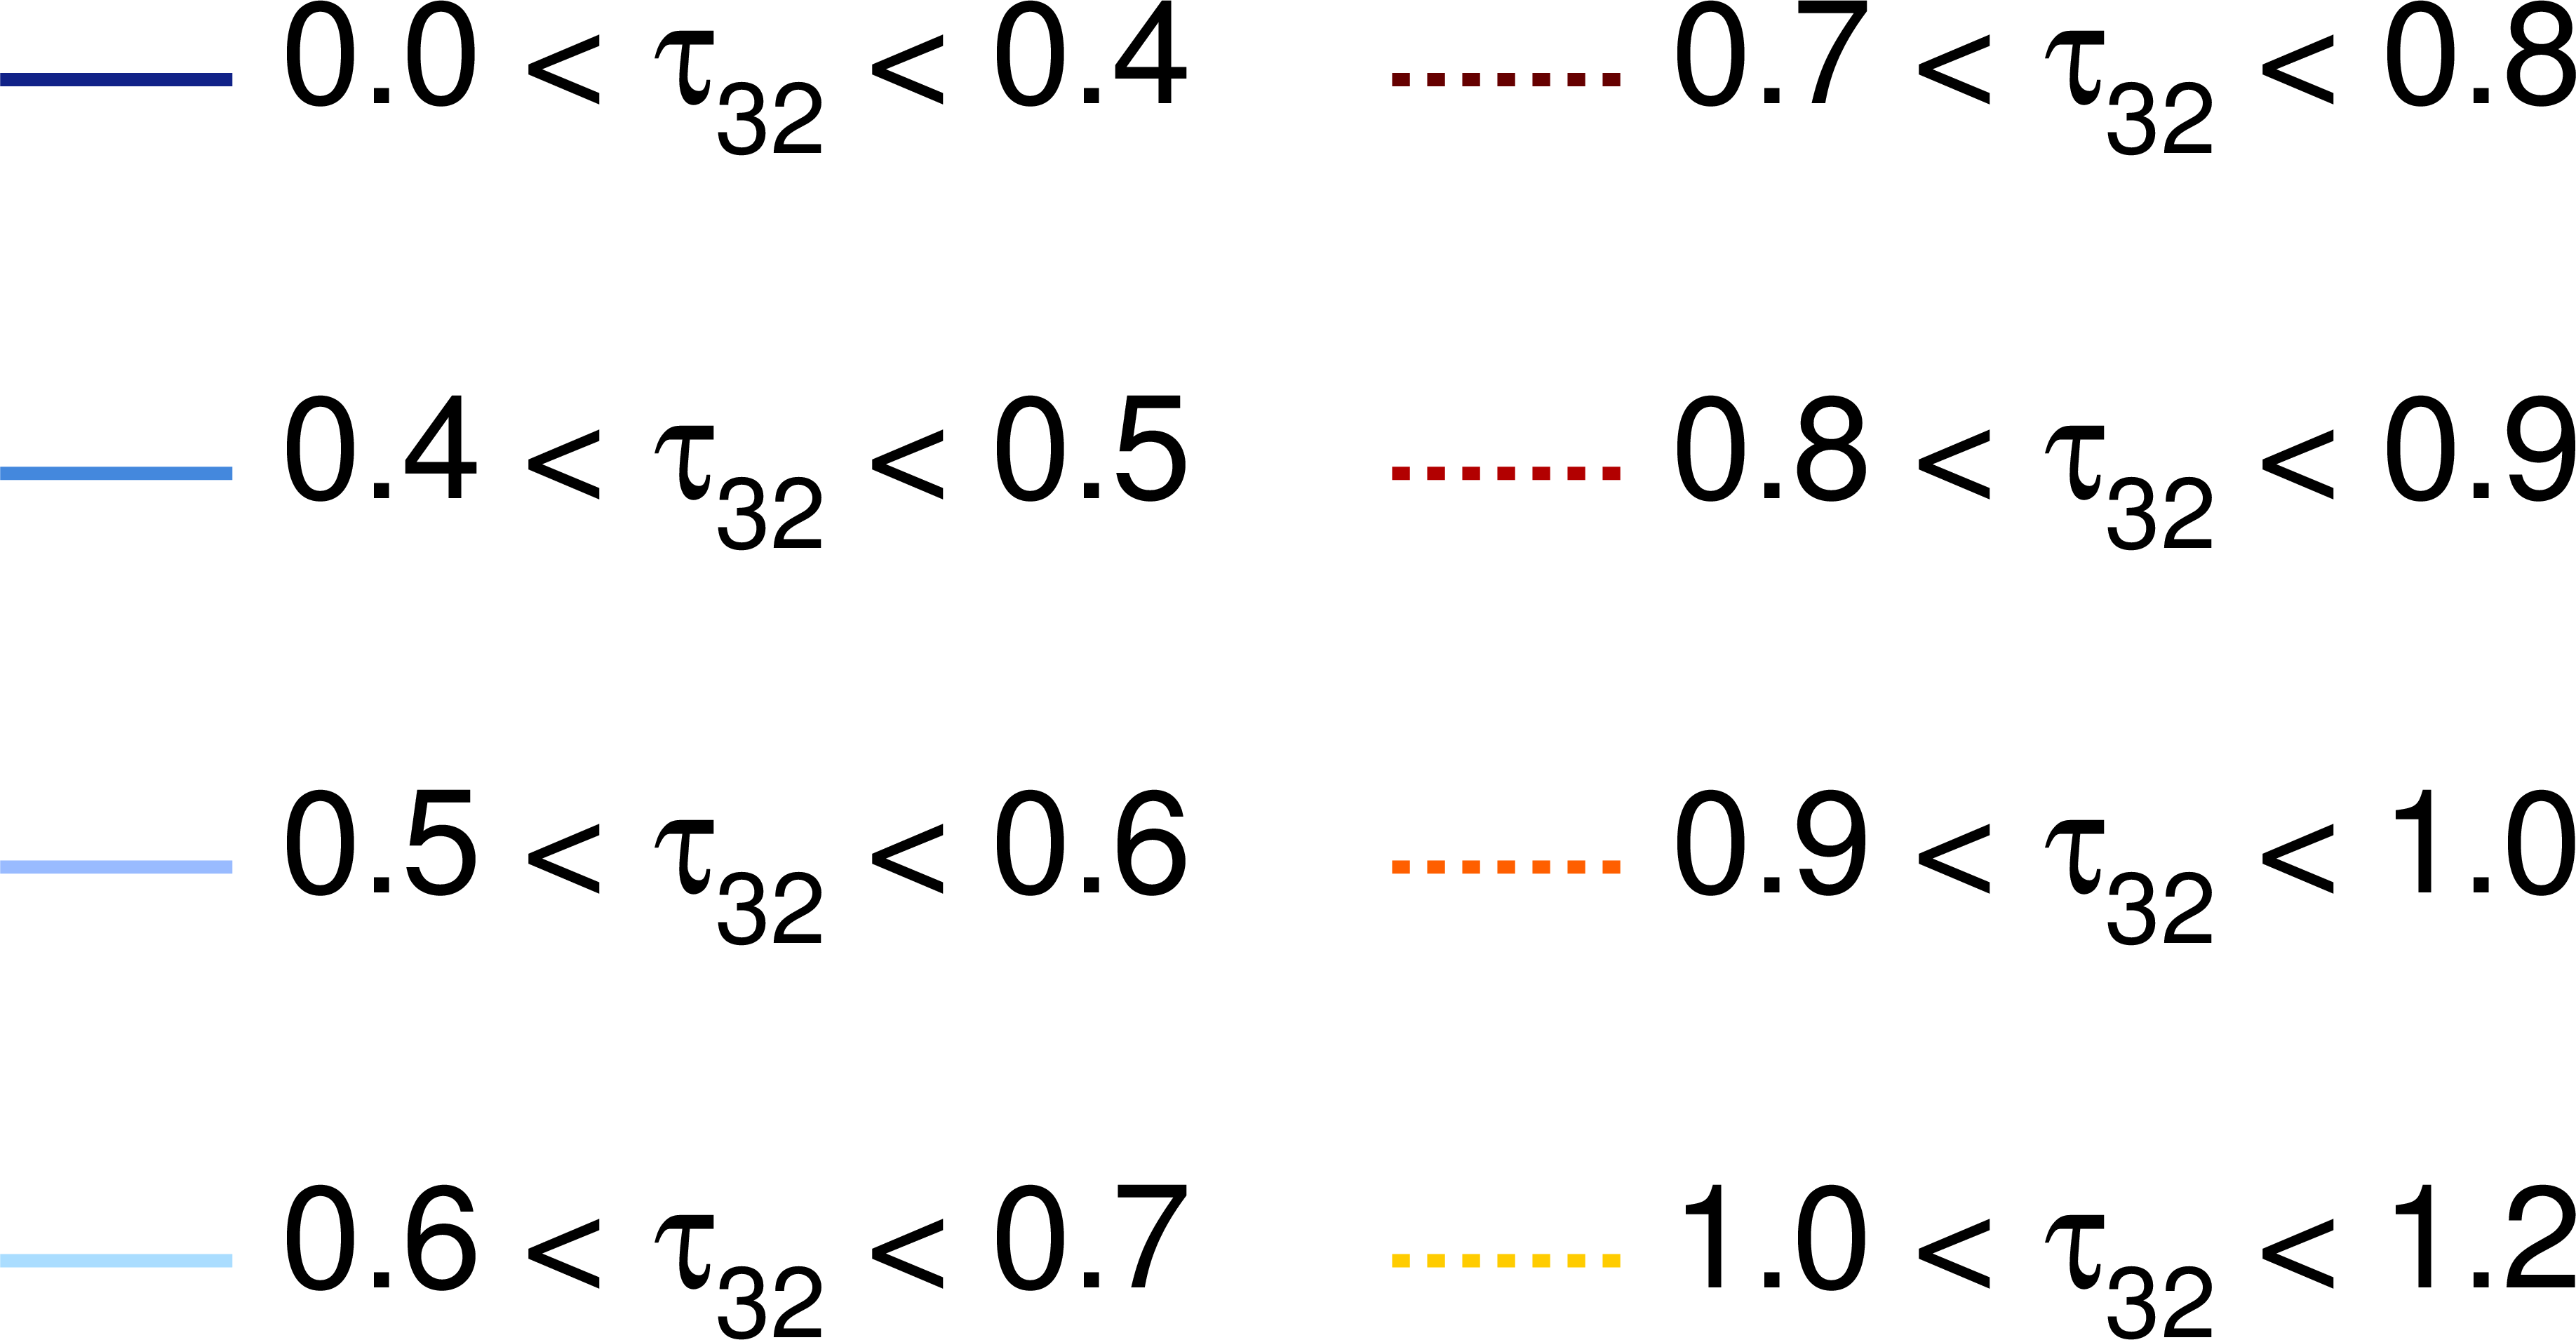
Figure 7-a:
Misidentification probability for CA8 jets to be tagged as top-quark jets for different $\beta $ ranges and for different $\tau _{32}$ values in the high-mass all-hadronic analysis. The horizontal error bars indicate the bin width. |
png pdf |
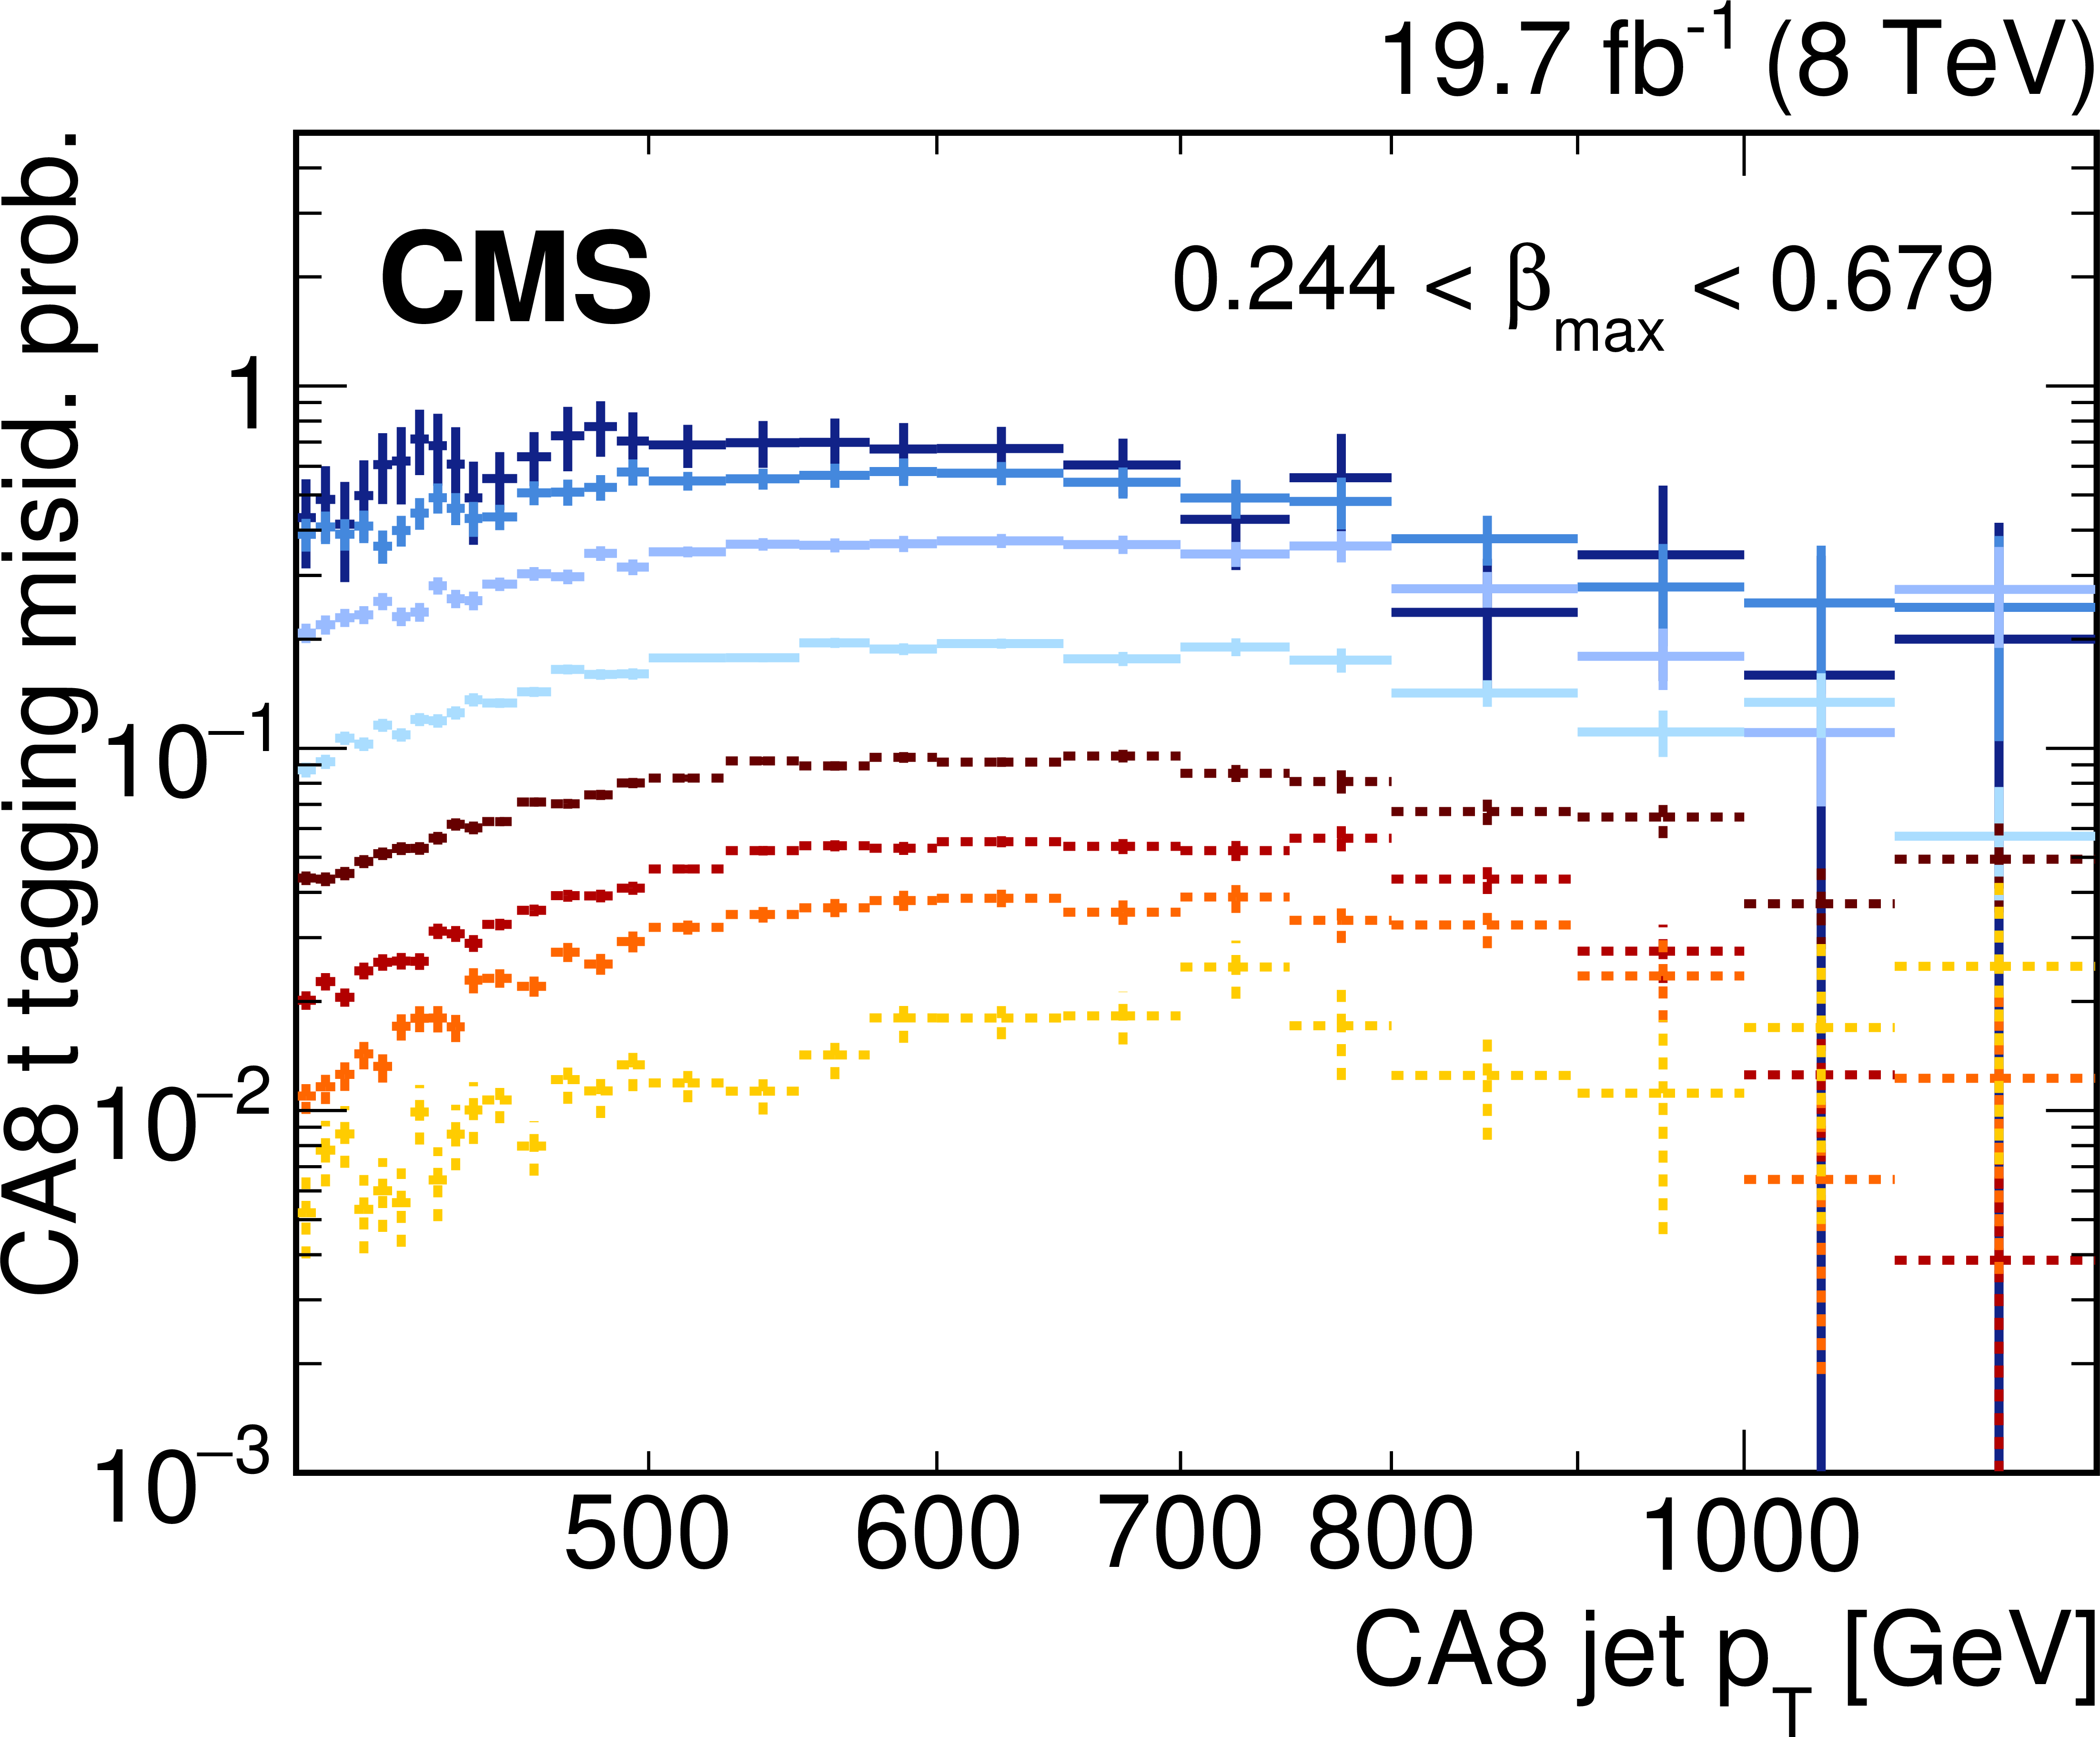
Figure 7-b:
Misidentification probability for CA8 jets to be tagged as top-quark jets for different $\beta $ ranges and for different $\tau _{32}$ values in the high-mass all-hadronic analysis. The horizontal error bars indicate the bin width. |
png pdf |
Figure 7-c:
Misidentification probability for CA8 jets to be tagged as top-quark jets for different $\beta $ ranges and for different $\tau _{32}$ values in the high-mass all-hadronic analysis. The horizontal error bars indicate the bin width. |
png pdf |
Figure 7-d:
Misidentification probability for CA8 jets to be tagged as top-quark jets for different $\beta $ ranges and for different $\tau _{32}$ values in the high-mass all-hadronic analysis. The horizontal error bars indicate the bin width. |
png pdf |
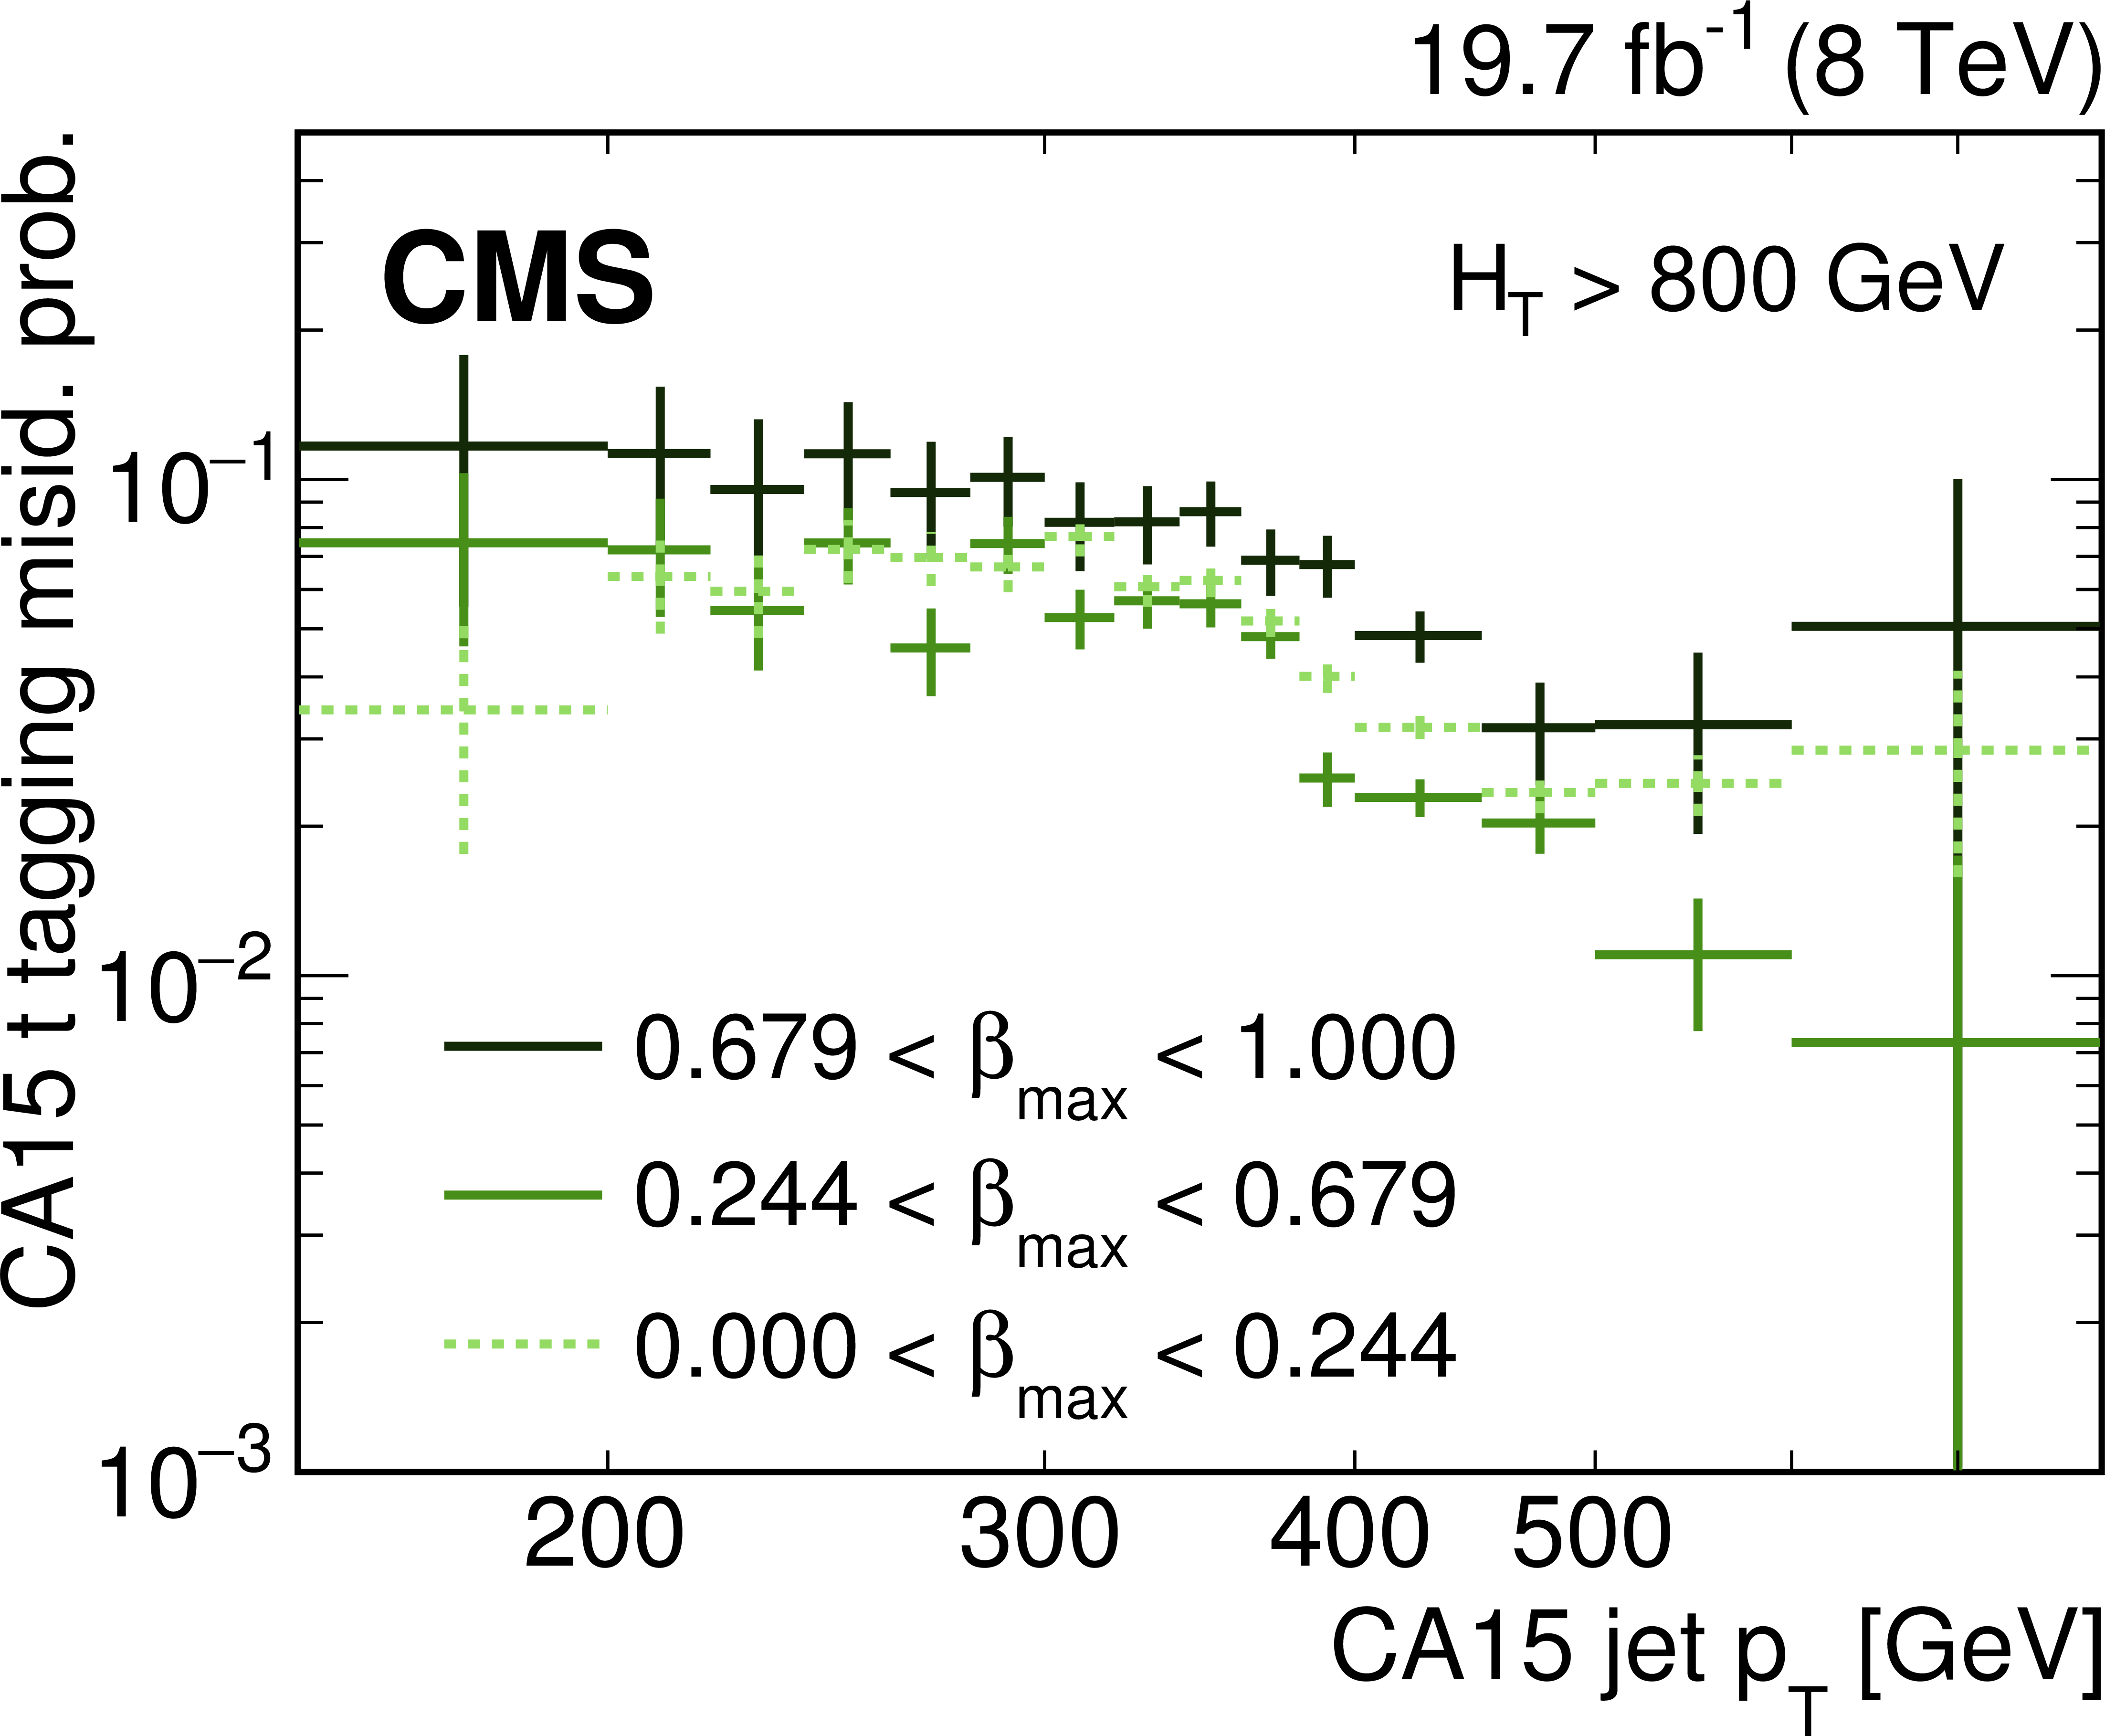
Figure 8-a:
Misidentification probability for CA15 jets to be tagged as top-quark jets for different $\beta $ values for $ {H_{\mathrm {T}}} > $ 800 GeV (a) and $ {H_{\mathrm {T}}} <$ 800 GeV (b) in the low-mass all-hadronic analysis. The horizontal error bars indicate the bin width. |
png pdf |
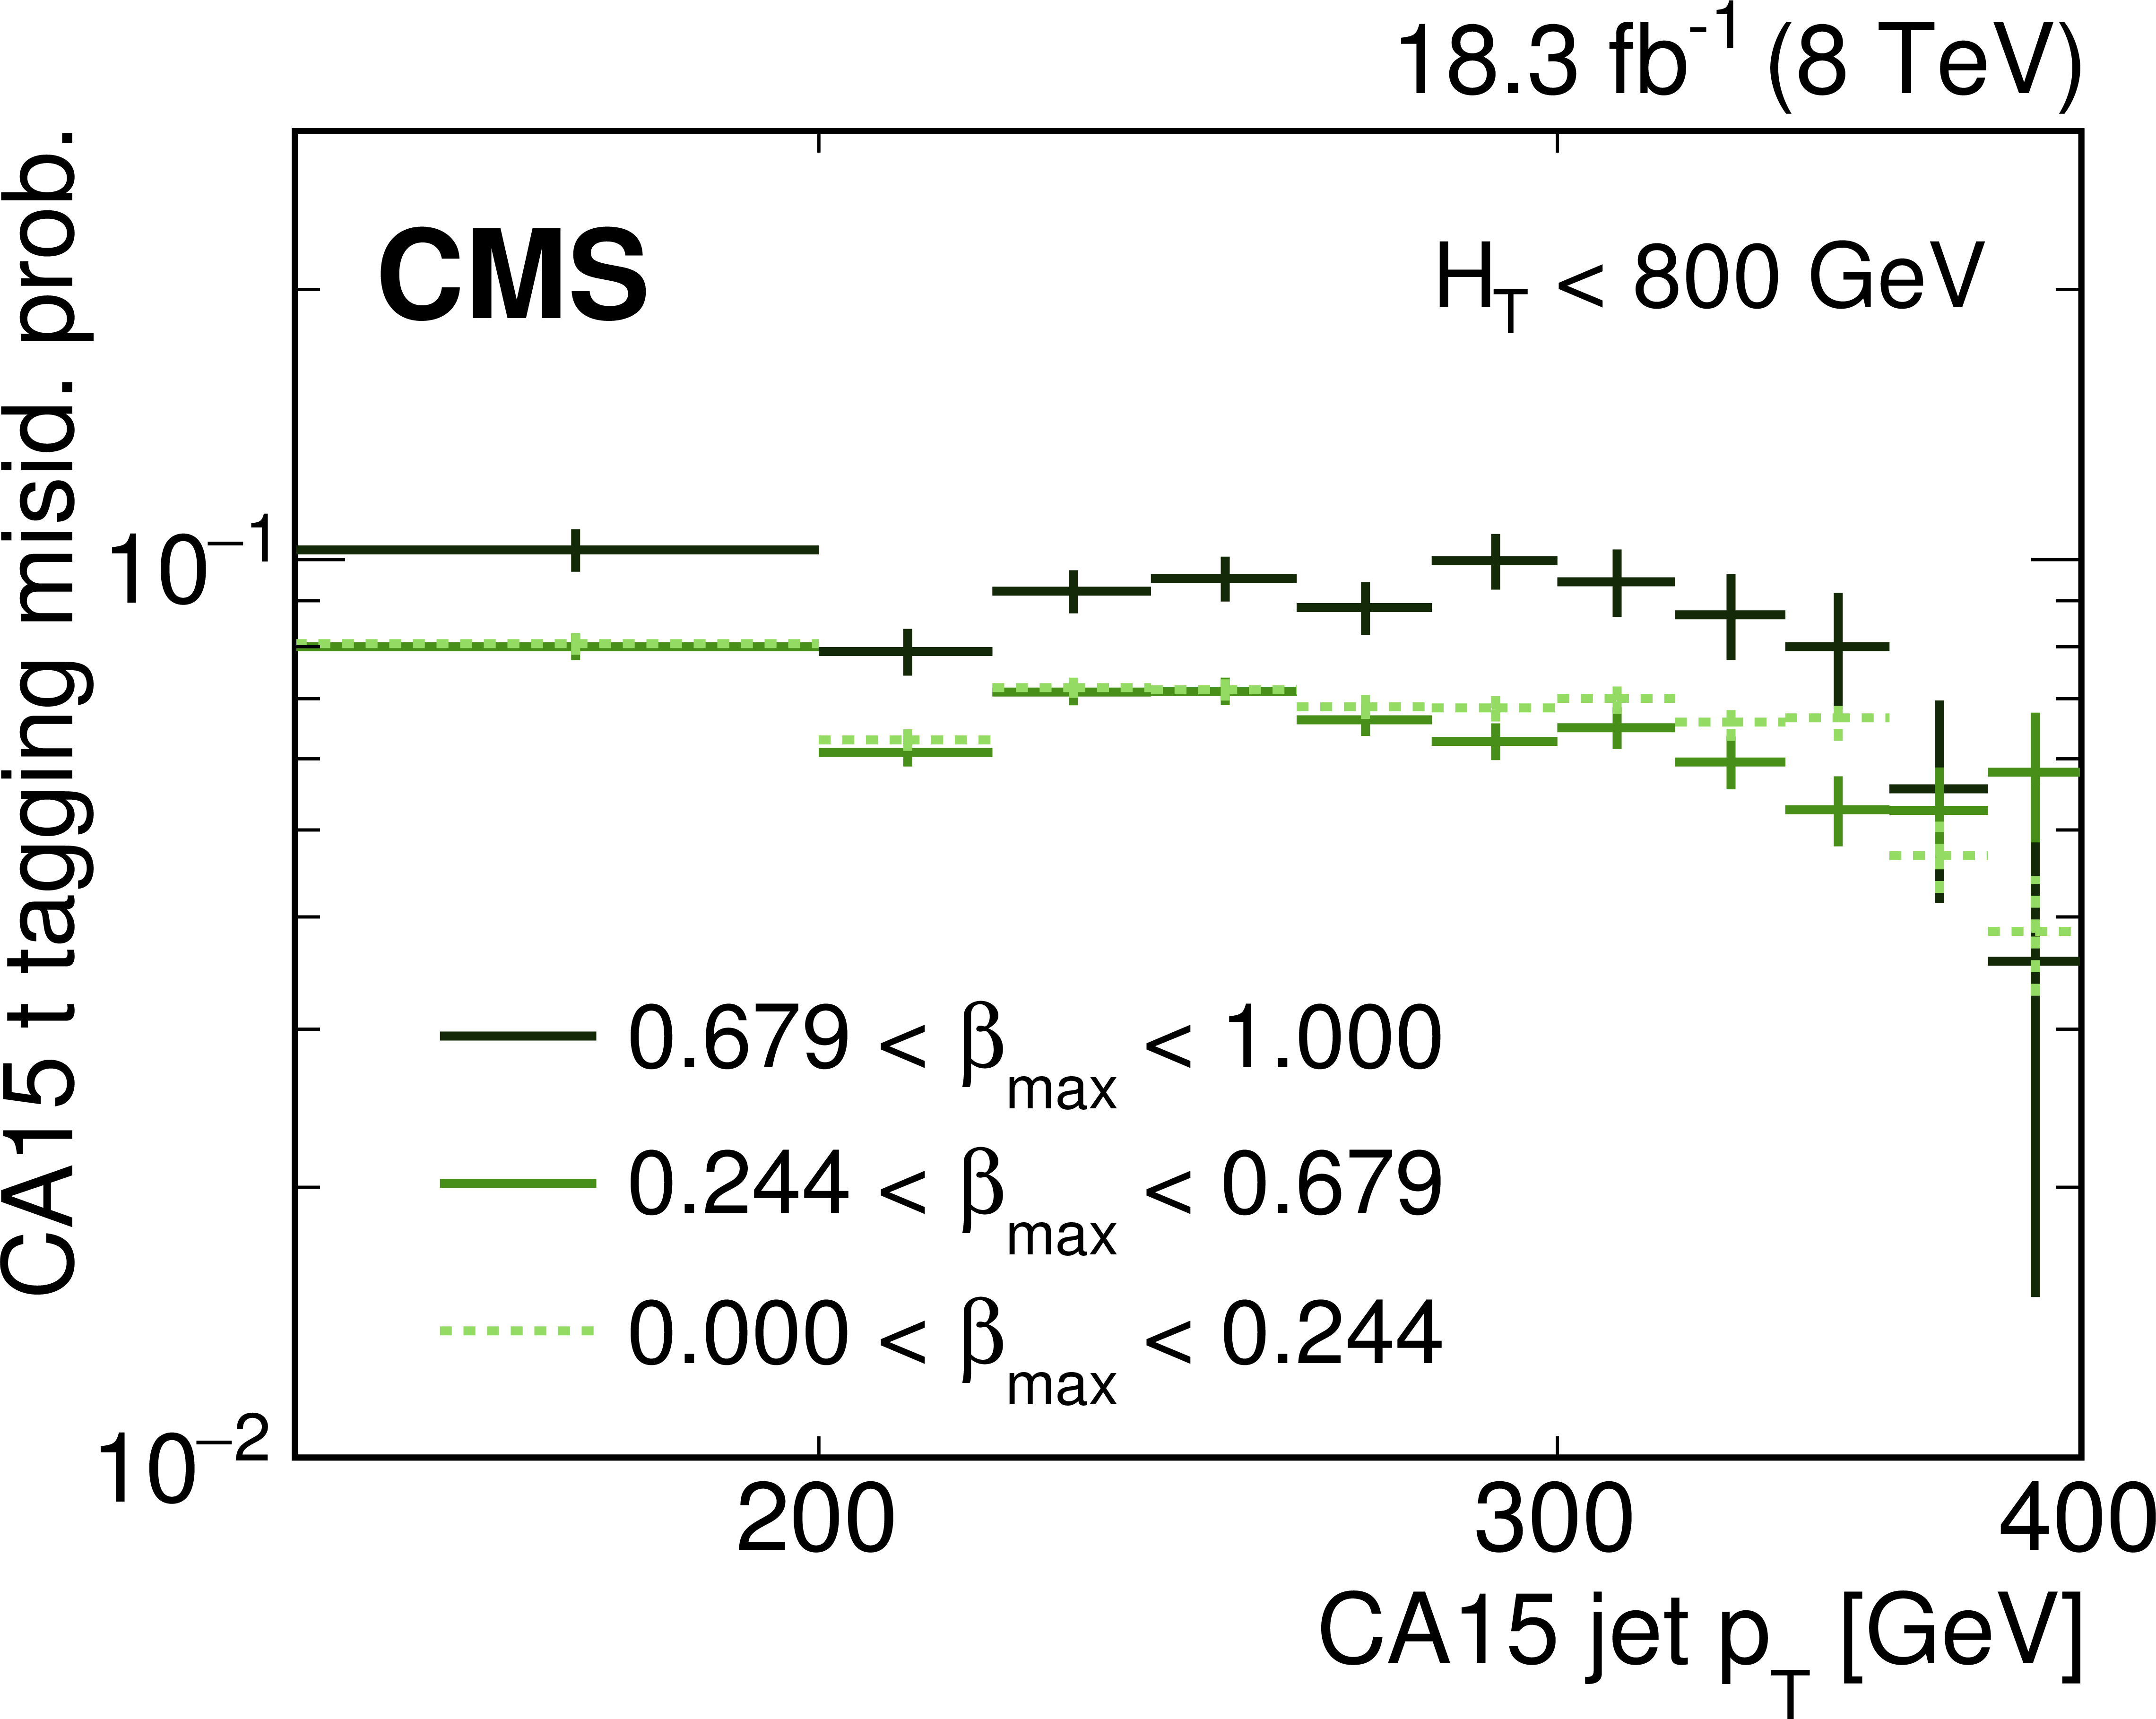
Figure 8-b:
Misidentification probability for CA15 jets to be tagged as top-quark jets for different $\beta $ values for $ {H_{\mathrm {T}}} > $ 800 GeV (a) and $ {H_{\mathrm {T}}} <$ 800 GeV (b) in the low-mass all-hadronic analysis. The horizontal error bars indicate the bin width. |
png pdf |
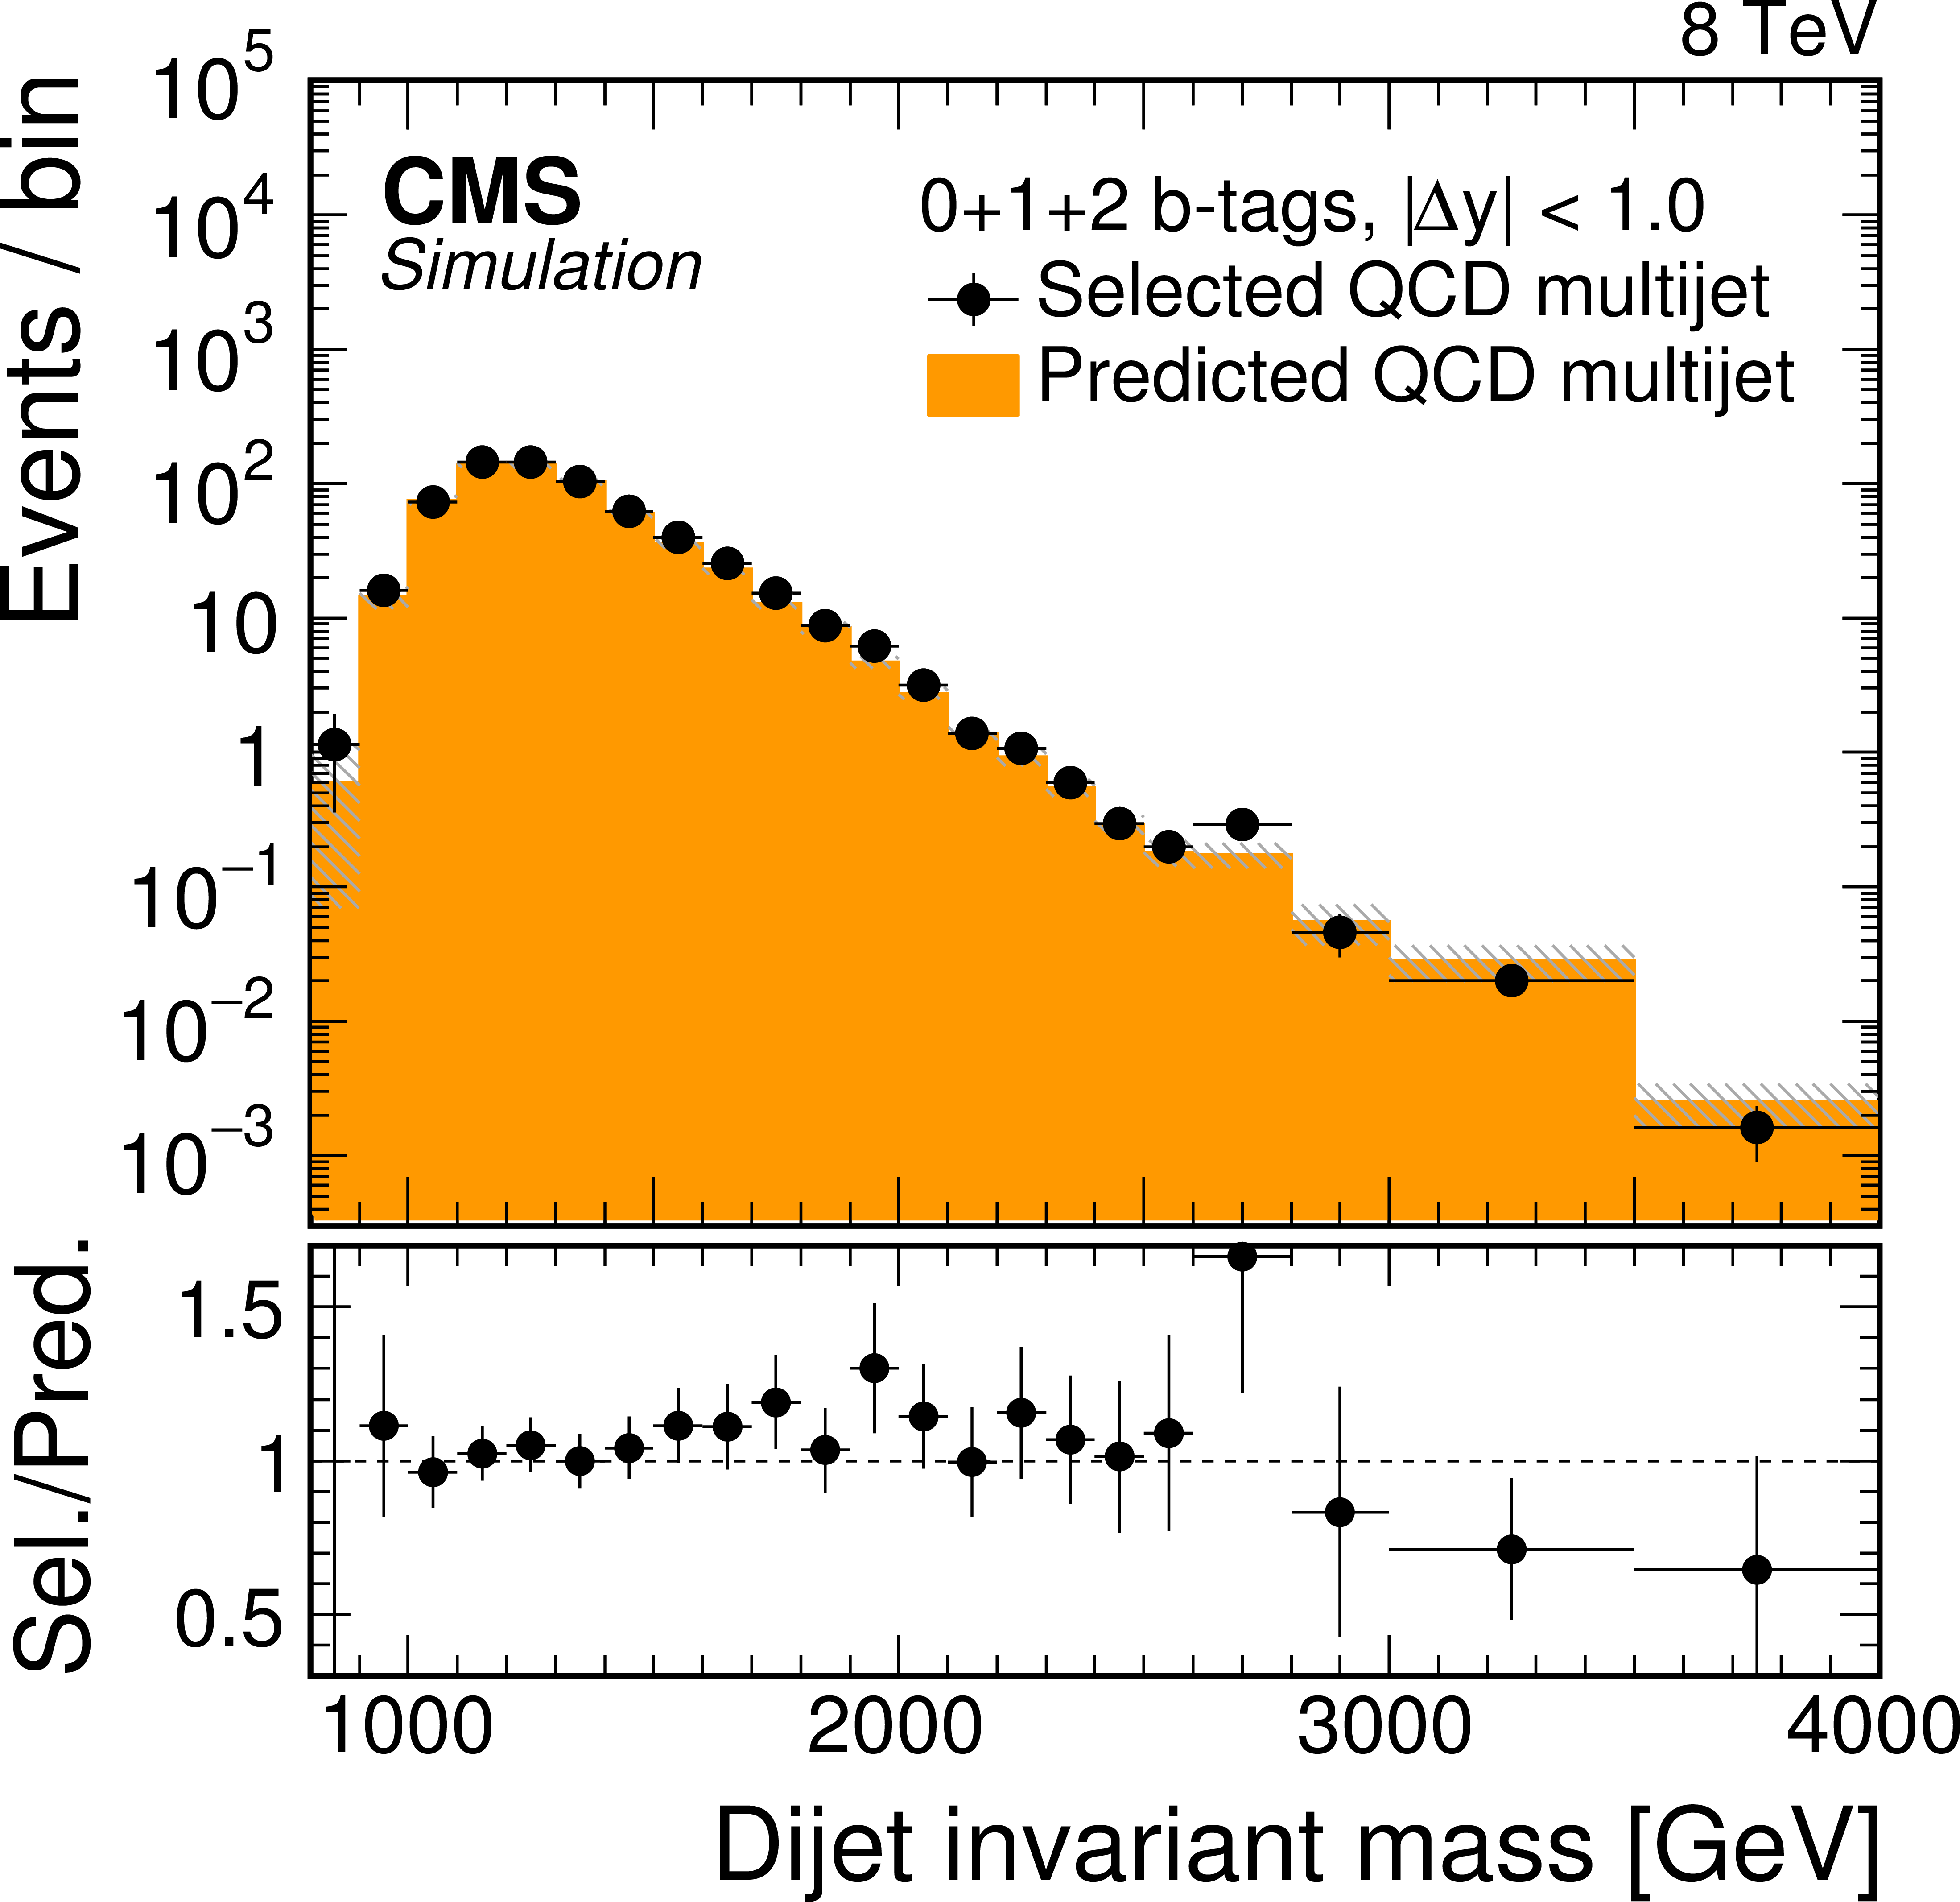
Figure 9-a:
Results of the validation test for the high-mass all-hadronic analysis, using simulated QCD multijet events, to validate the data-driven background method used to estimate the QCD multijet contribution. Events are shown without any selection or division applied based on the number of identified $ {\mathrm {b}}$-tagged jets for $ {| \Delta y | } < 1.0$ (a) and $ {| \Delta y | } > 1.0$ (b). The points show the selected QCD multijet events in the signal region, with the horizontal error bars indicating the bin width. The solid histogram shows the predicted number of QCD multijet events using the misidentification probability for CA8 $ {\mathrm {t}}$-tagged jets measured in a statistically independent sideband region. The statistical uncertainty is shown as a shaded region. The ratio of selected to predicted events is shown in the bottom panel of each figure. |
png pdf |
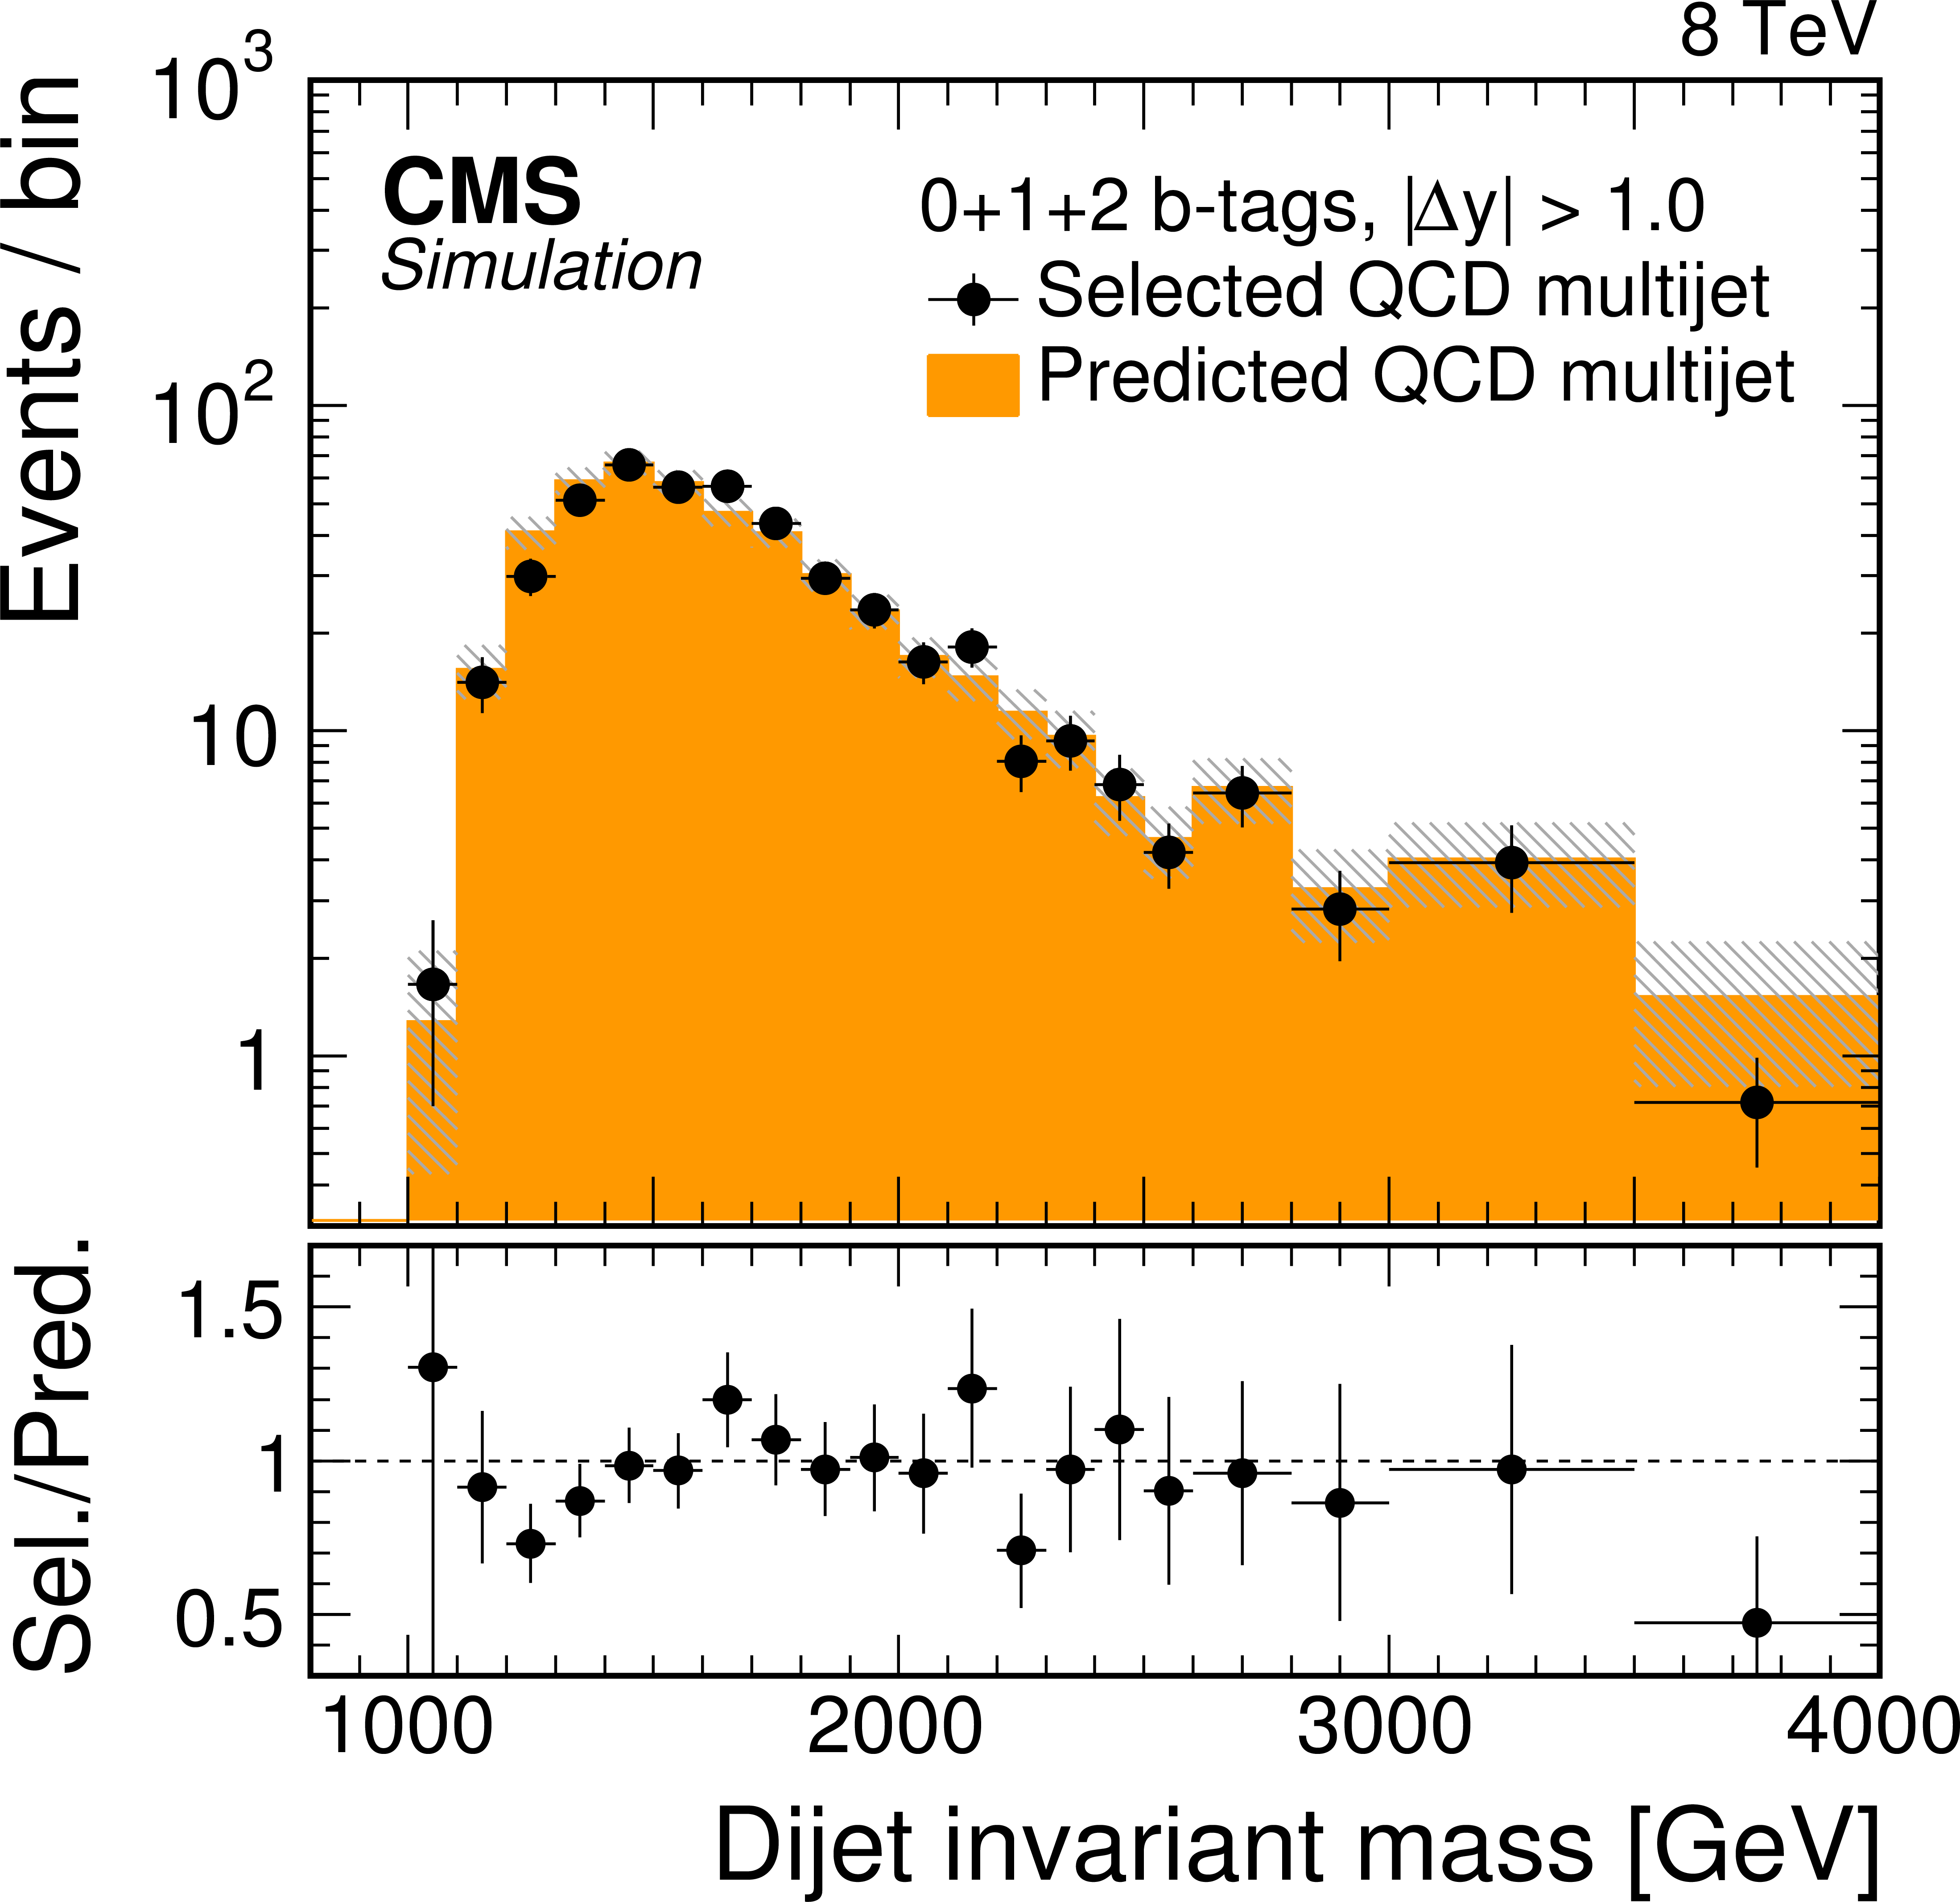
Figure 9-b:
Results of the validation test for the high-mass all-hadronic analysis, using simulated QCD multijet events, to validate the data-driven background method used to estimate the QCD multijet contribution. Events are shown without any selection or division applied based on the number of identified $ {\mathrm {b}}$-tagged jets for $ {| \Delta y | } < 1.0$ (a) and $ {| \Delta y | } > 1.0$ (b). The points show the selected QCD multijet events in the signal region, with the horizontal error bars indicating the bin width. The solid histogram shows the predicted number of QCD multijet events using the misidentification probability for CA8 $ {\mathrm {t}}$-tagged jets measured in a statistically independent sideband region. The statistical uncertainty is shown as a shaded region. The ratio of selected to predicted events is shown in the bottom panel of each figure. |
png pdf |
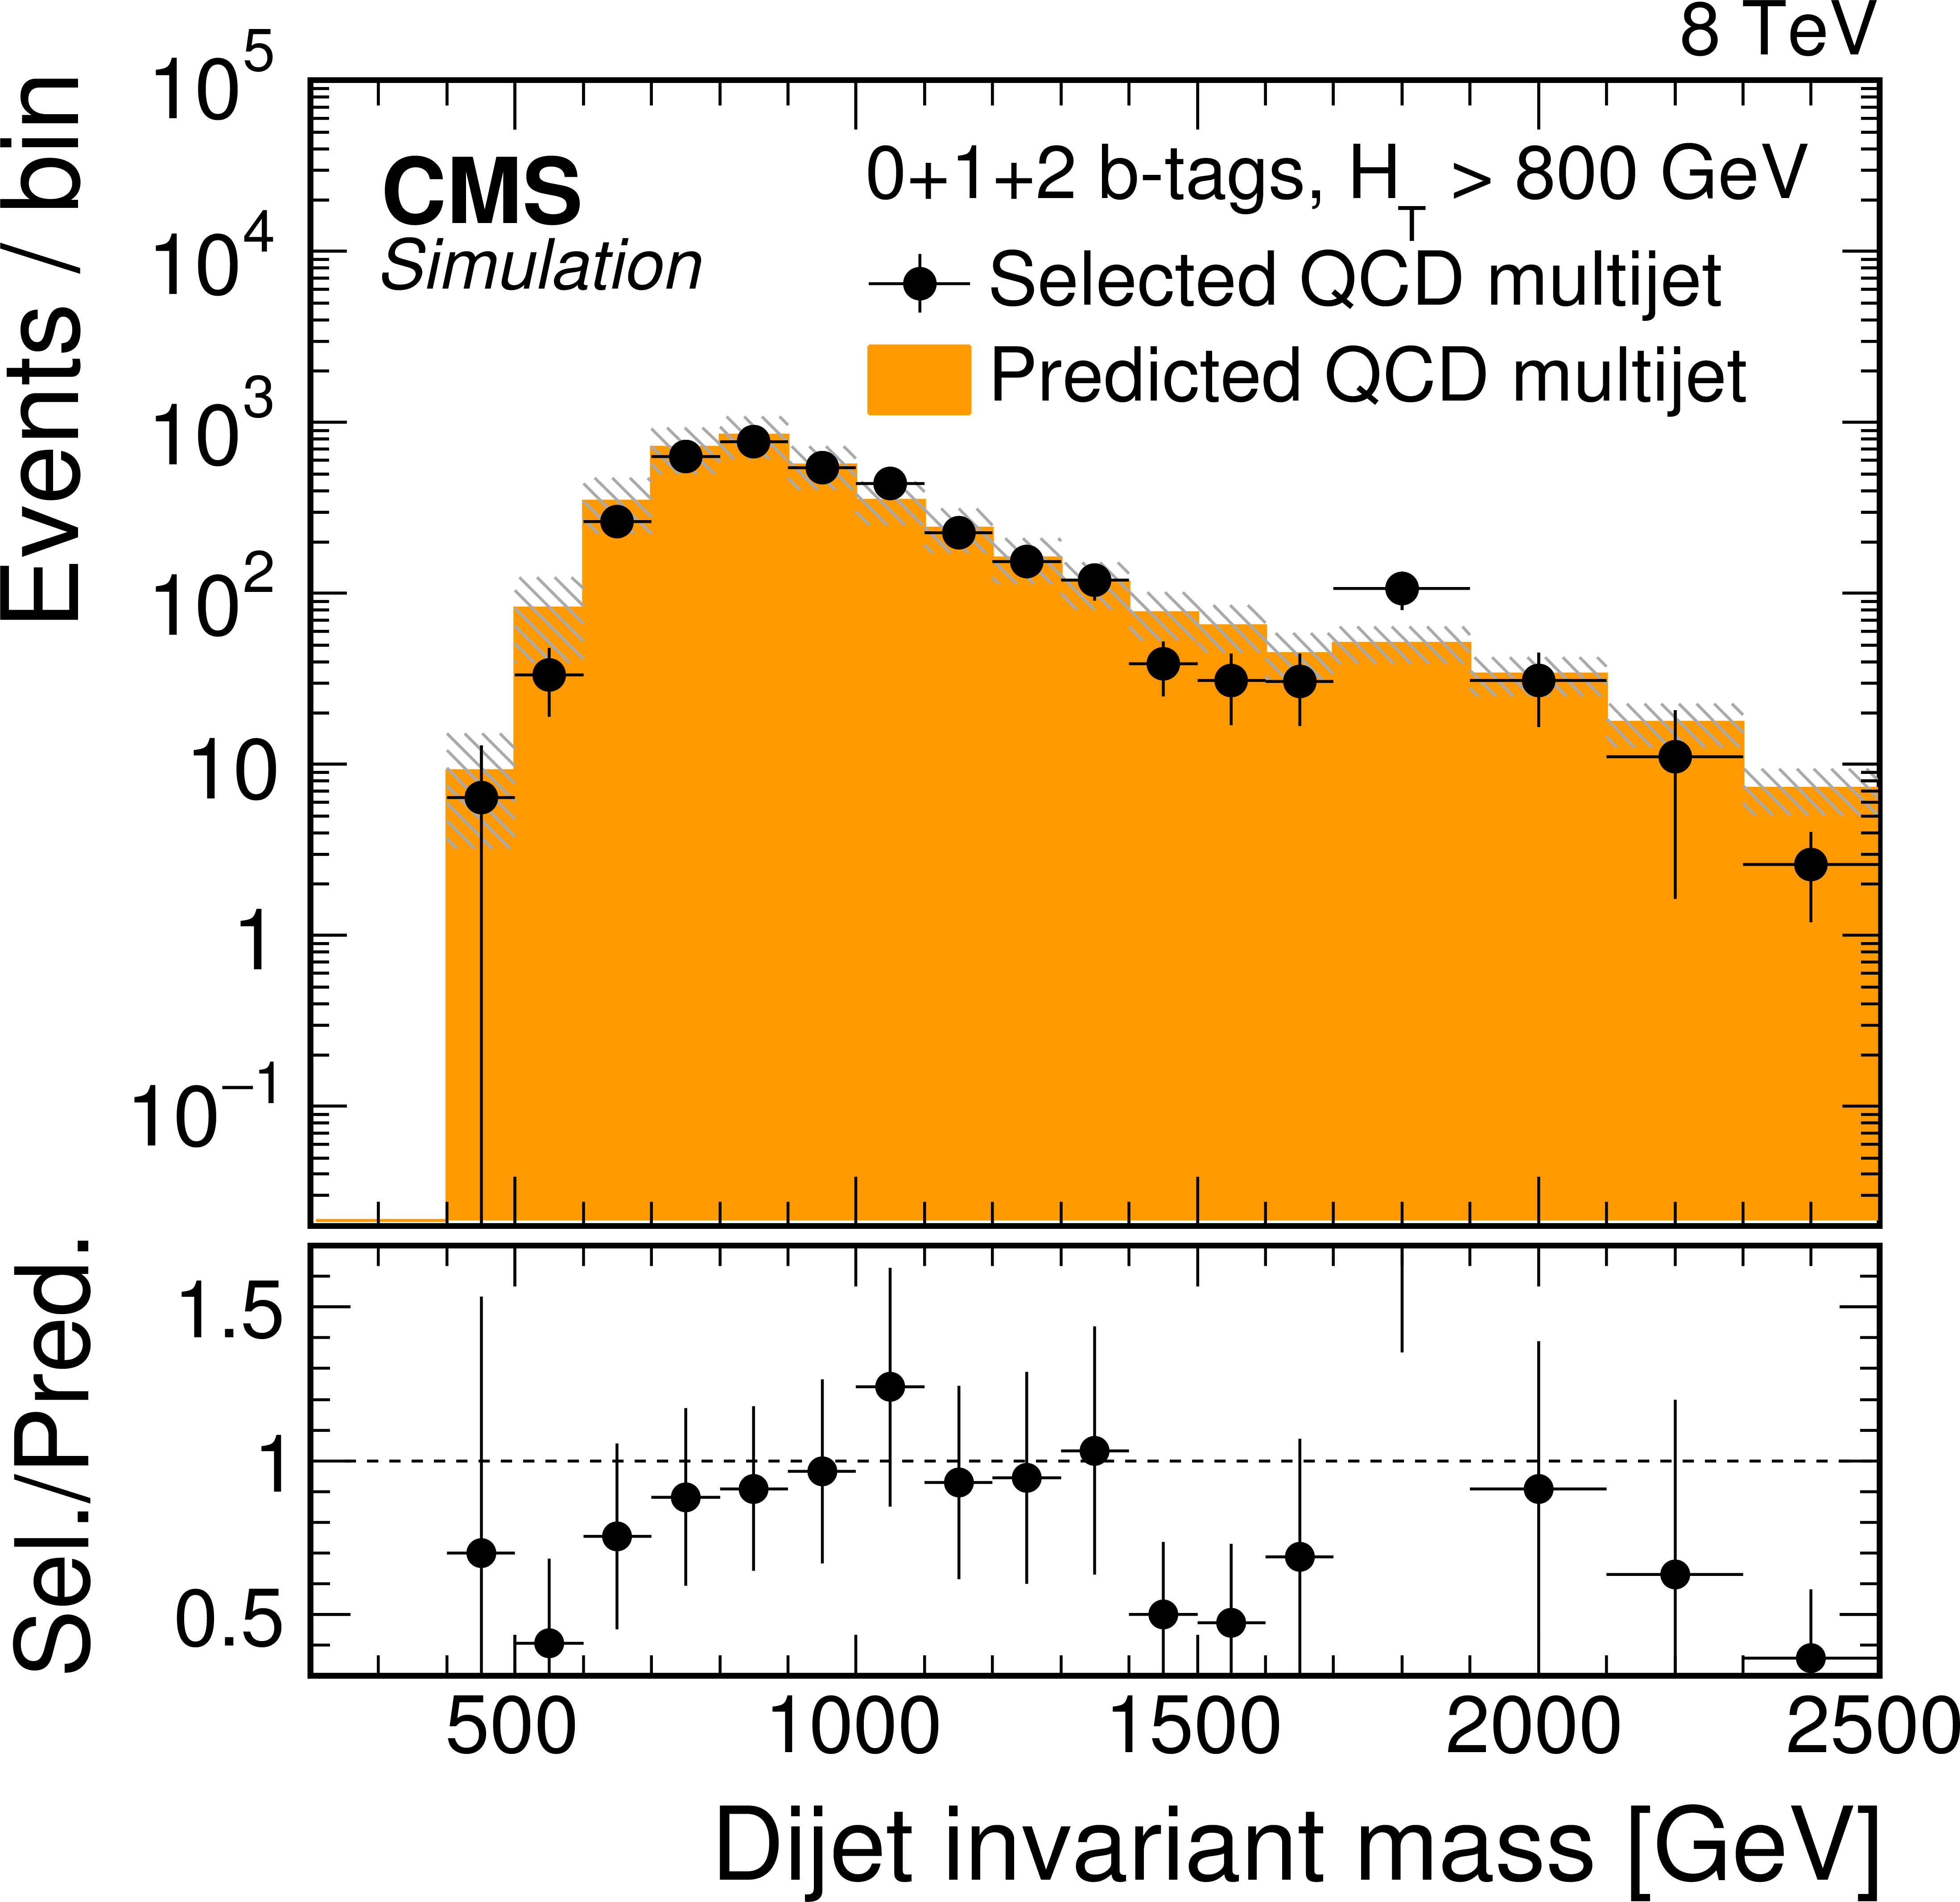
Figure 10-a:
Results of the validation test for the low-mass all-hadronic analysis, using simulated QCD multijet events, to validate the data-driven background method used to estimate the QCD multijet contribution for events with $ {H_{\mathrm {T}}} >$ 800 GeV (a), and events with $ {H_{\mathrm {T}}} <$ 800 GeV (b). The points show the selected QCD multijet events in the signal region, with the horizontal error bars indicating the bin width. The solid histogram shows the predicted number of QCD multijet events using the misidentification probability for CA15 $ {\mathrm {t}}$-tagged jets measured in a statistically independent sideband region. The statistical uncertainty is shown as a shaded region. The ratio of selected to predicted events is shown in the bottom panel of each figure. |
png pdf |
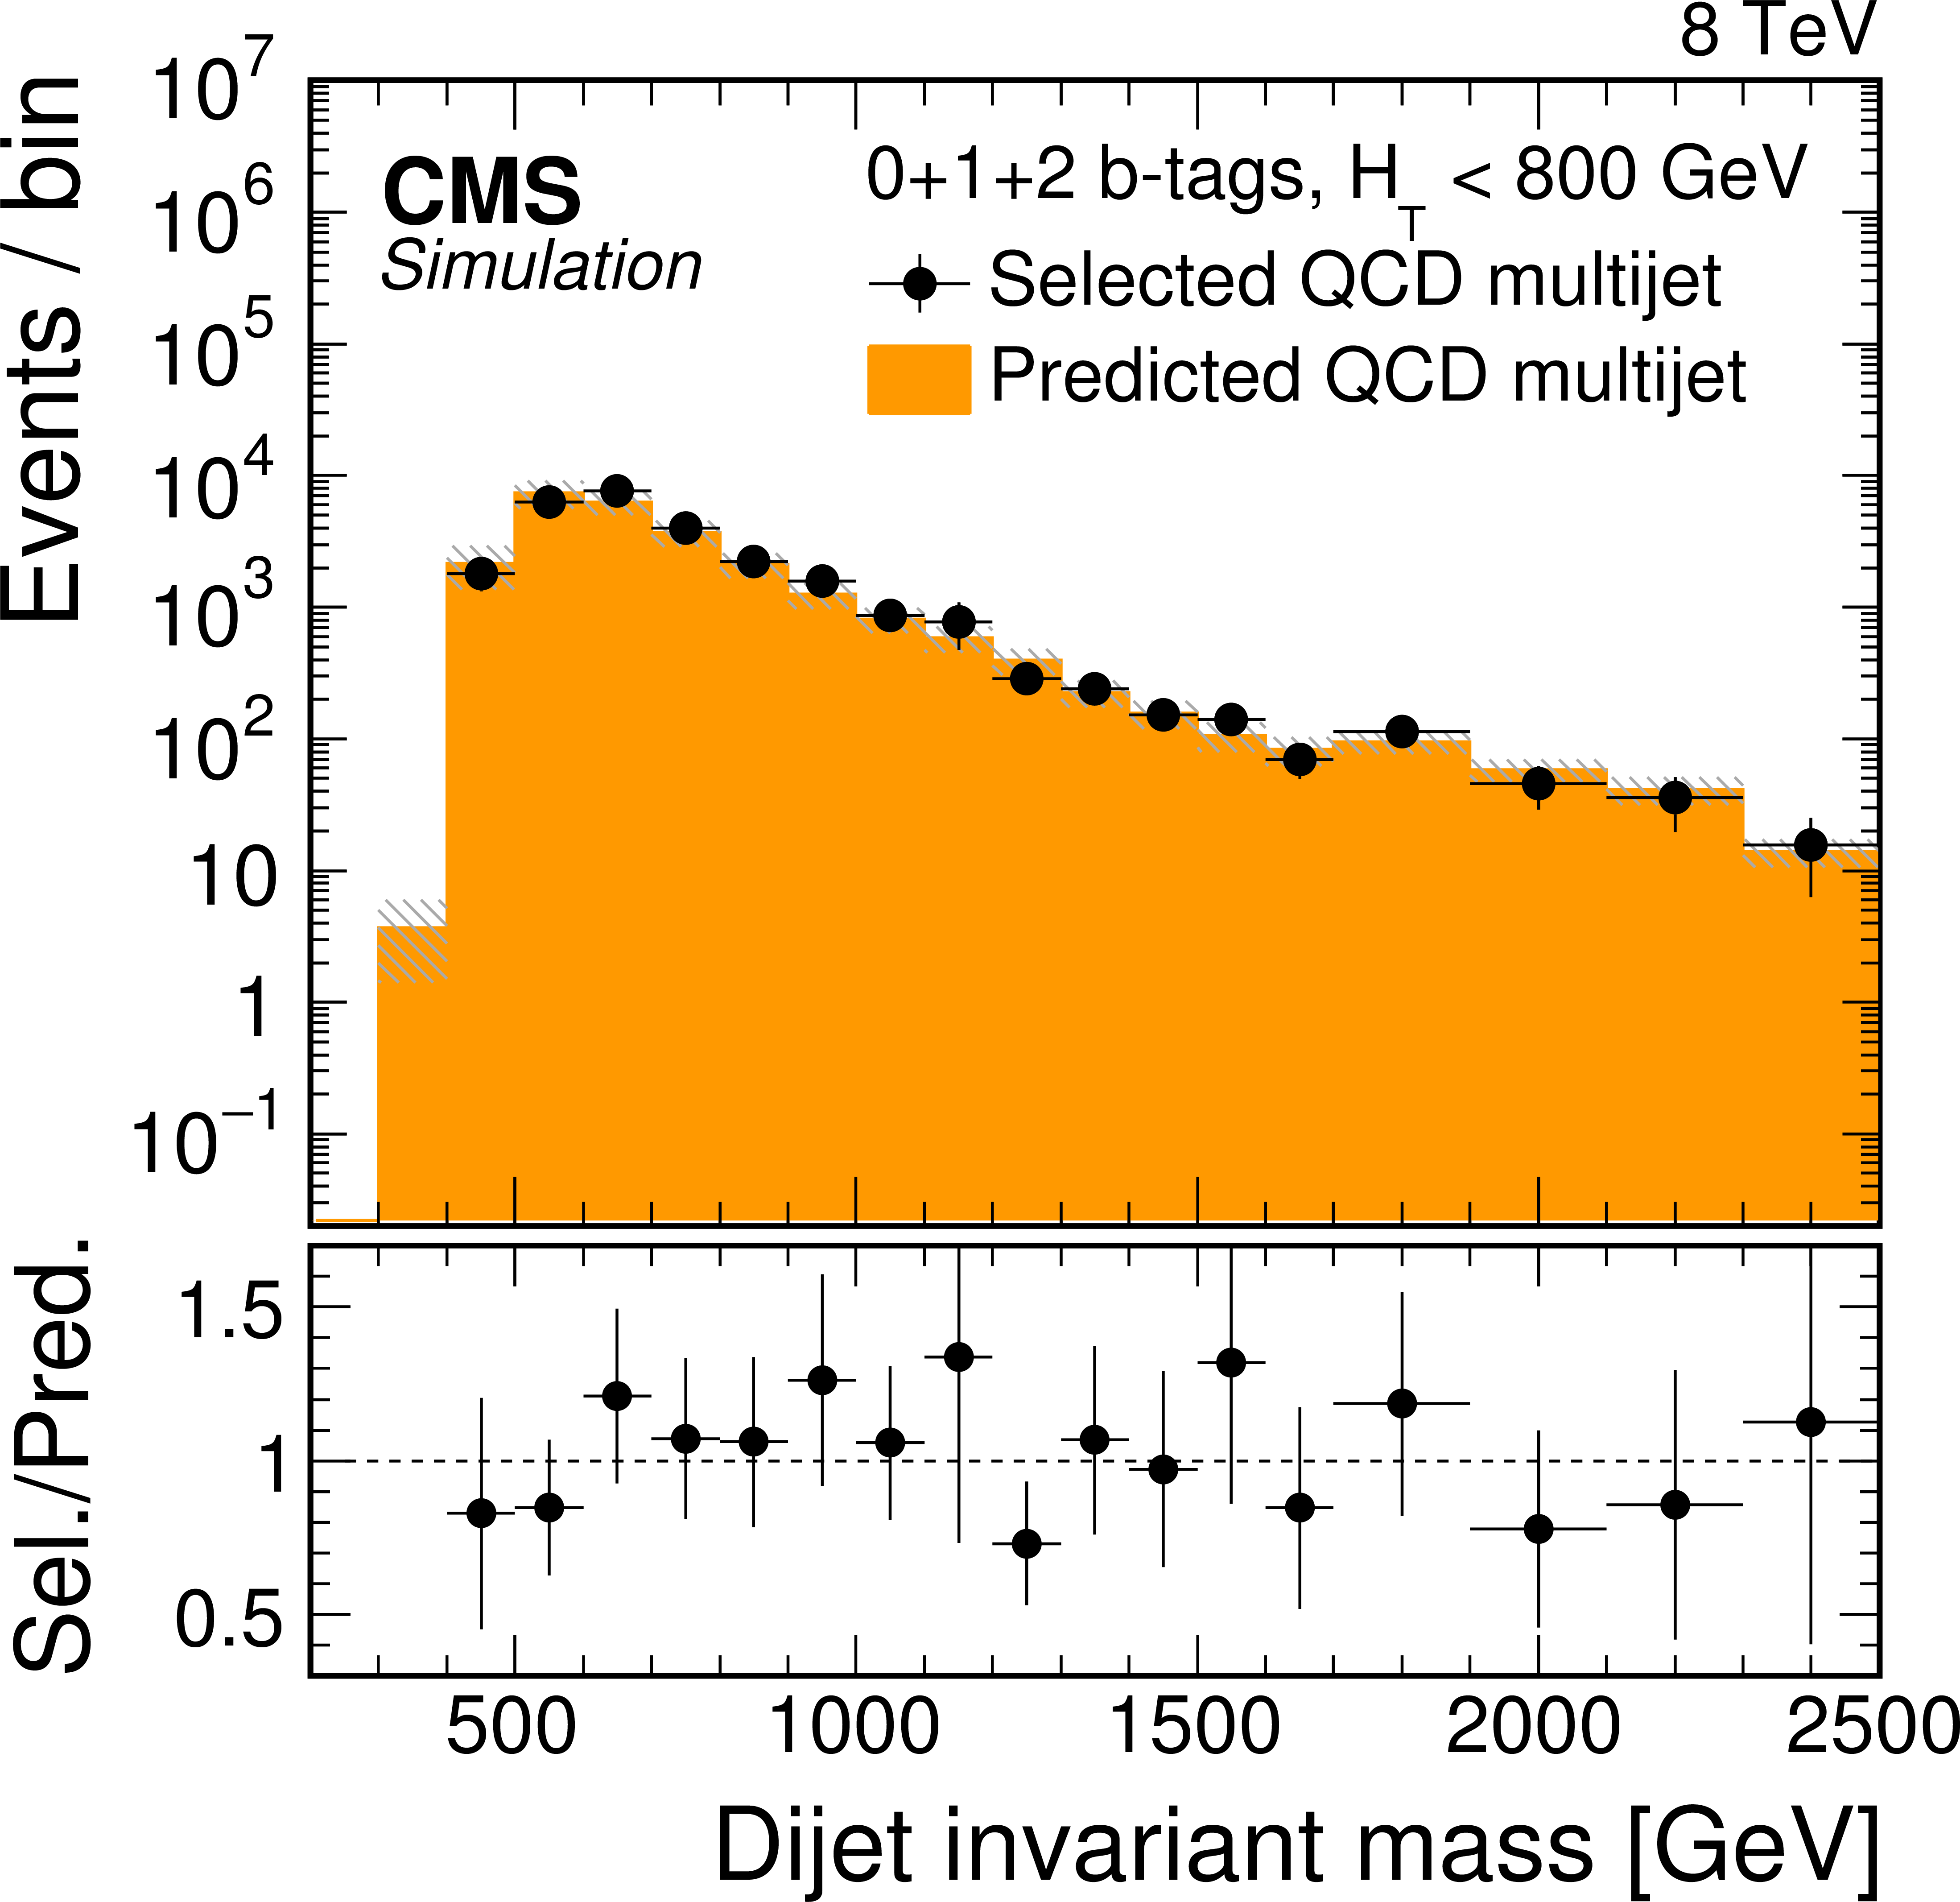
Figure 10-b:
Results of the validation test for the low-mass all-hadronic analysis, using simulated QCD multijet events, to validate the data-driven background method used to estimate the QCD multijet contribution for events with $ {H_{\mathrm {T}}} >$ 800 GeV (a), and events with $ {H_{\mathrm {T}}} <$ 800 GeV (b). The points show the selected QCD multijet events in the signal region, with the horizontal error bars indicating the bin width. The solid histogram shows the predicted number of QCD multijet events using the misidentification probability for CA15 $ {\mathrm {t}}$-tagged jets measured in a statistically independent sideband region. The statistical uncertainty is shown as a shaded region. The ratio of selected to predicted events is shown in the bottom panel of each figure. |
png pdf |
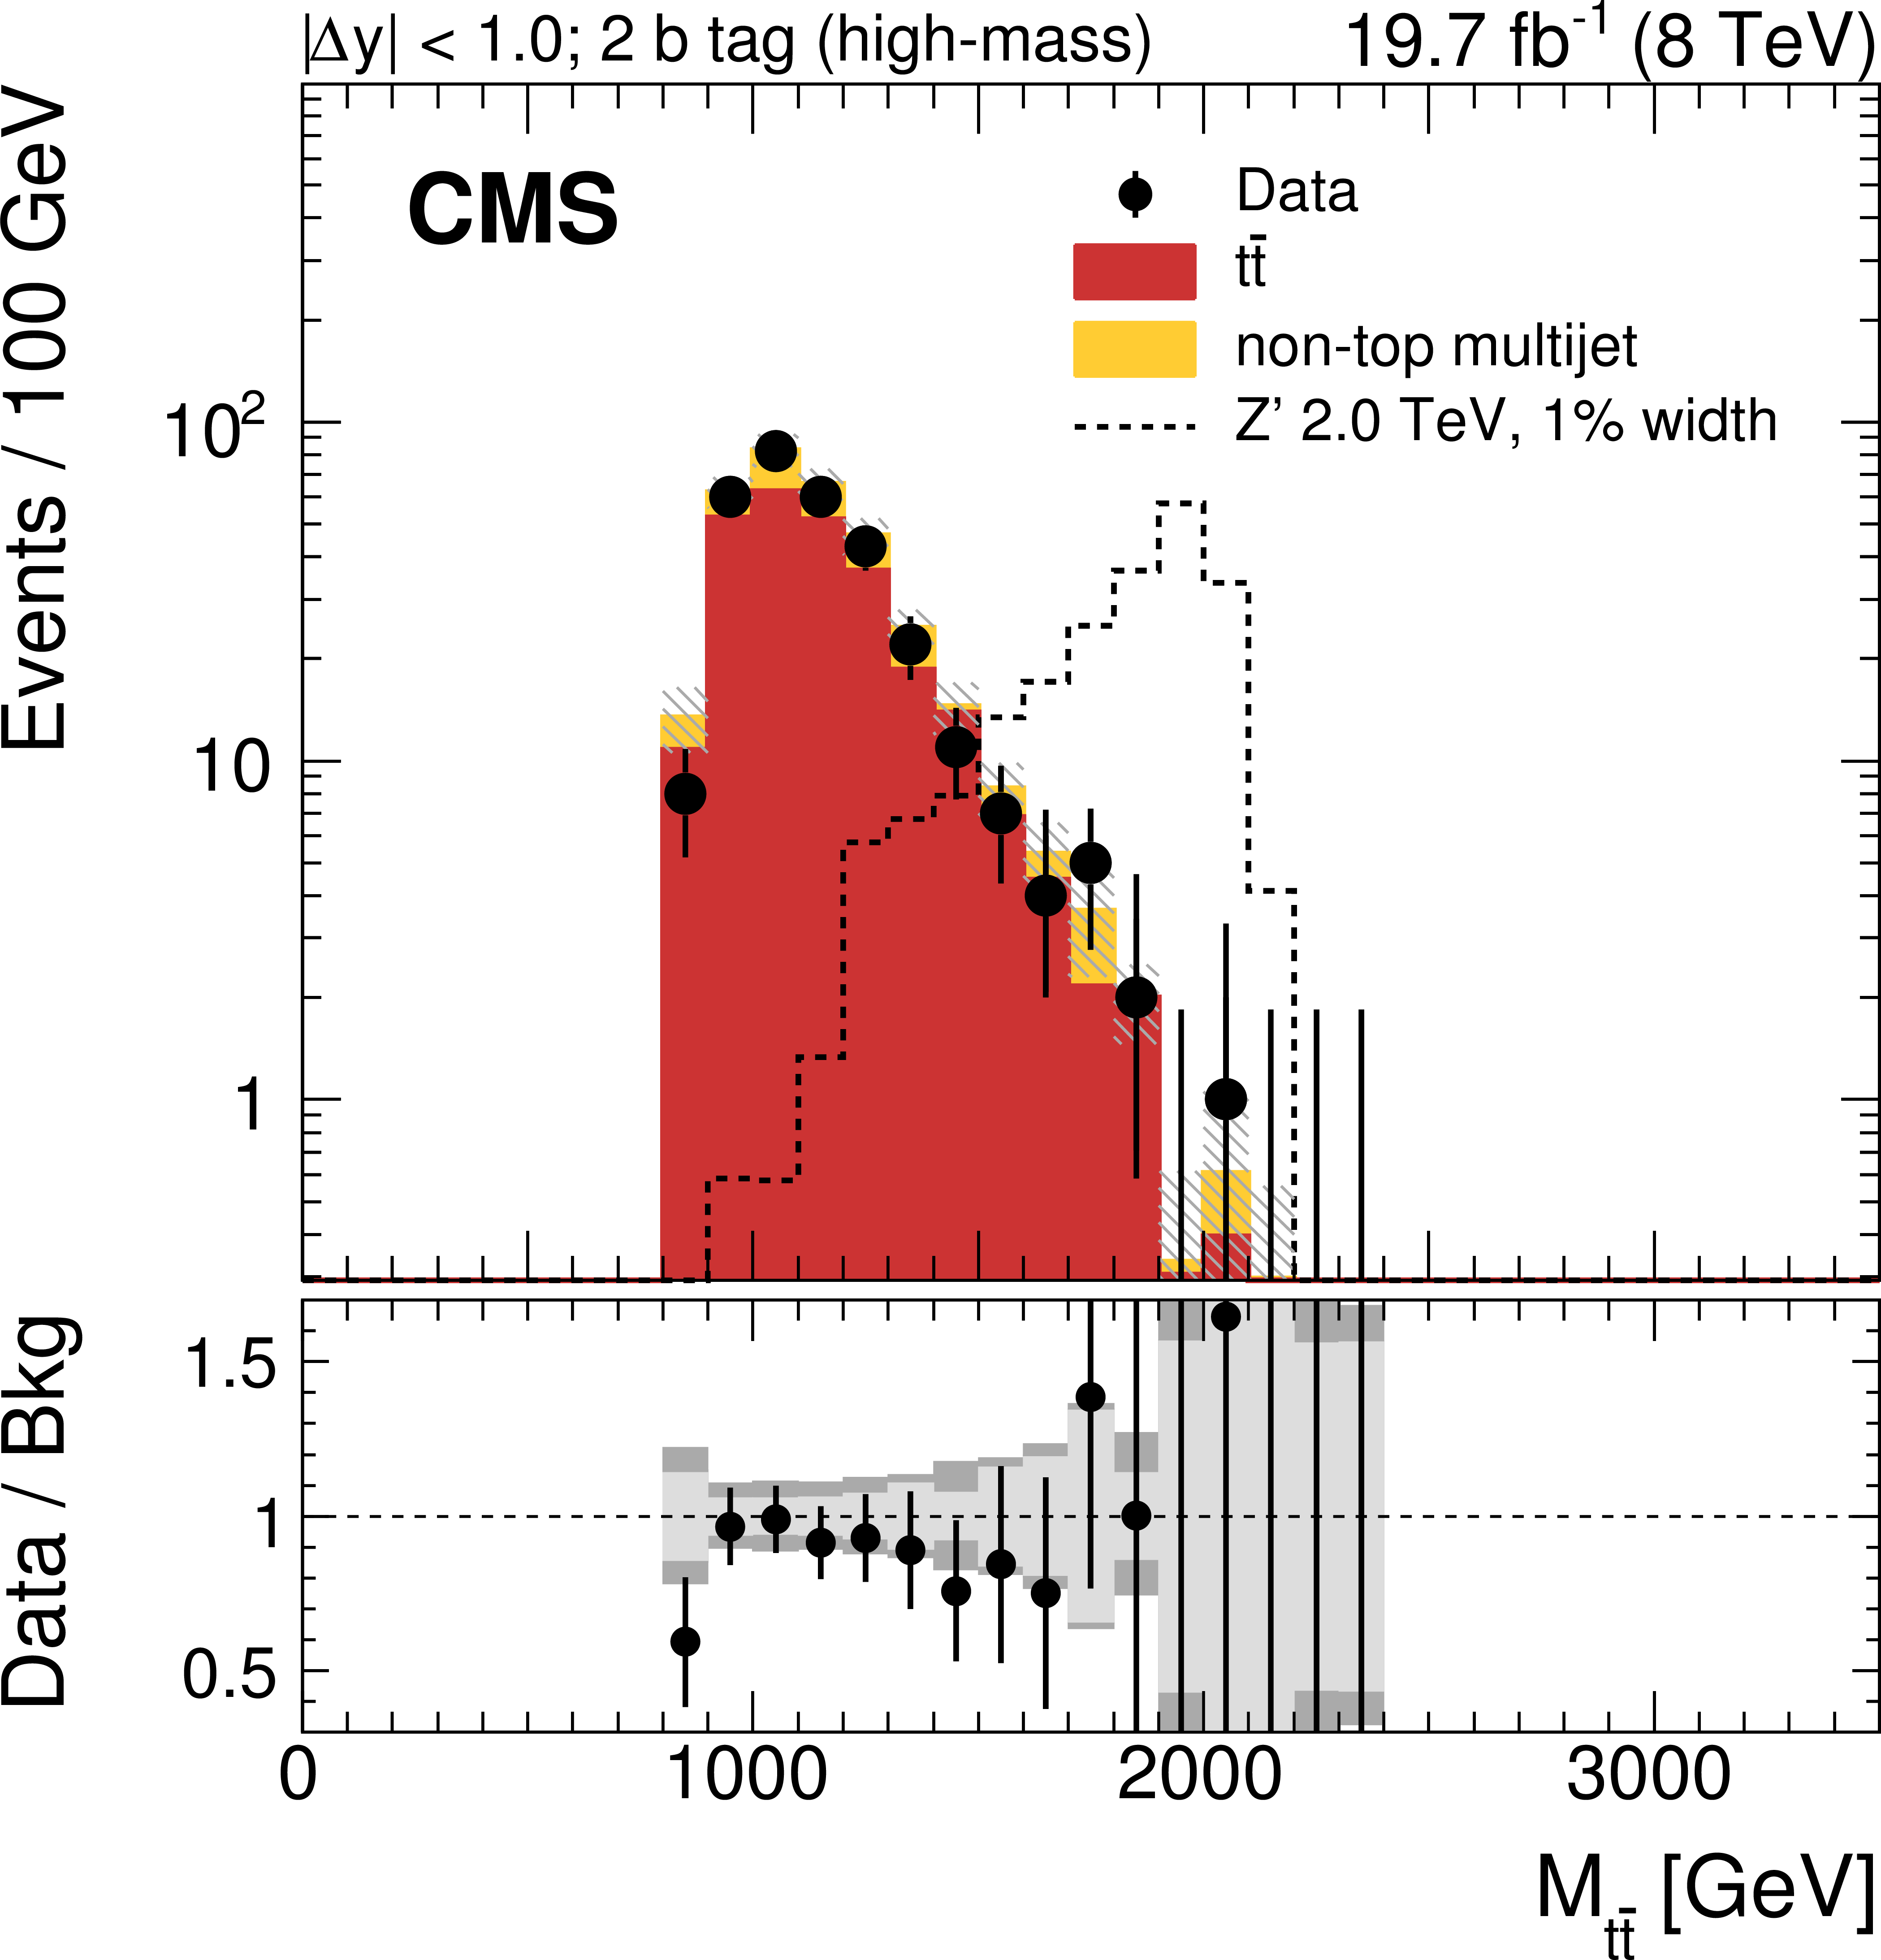
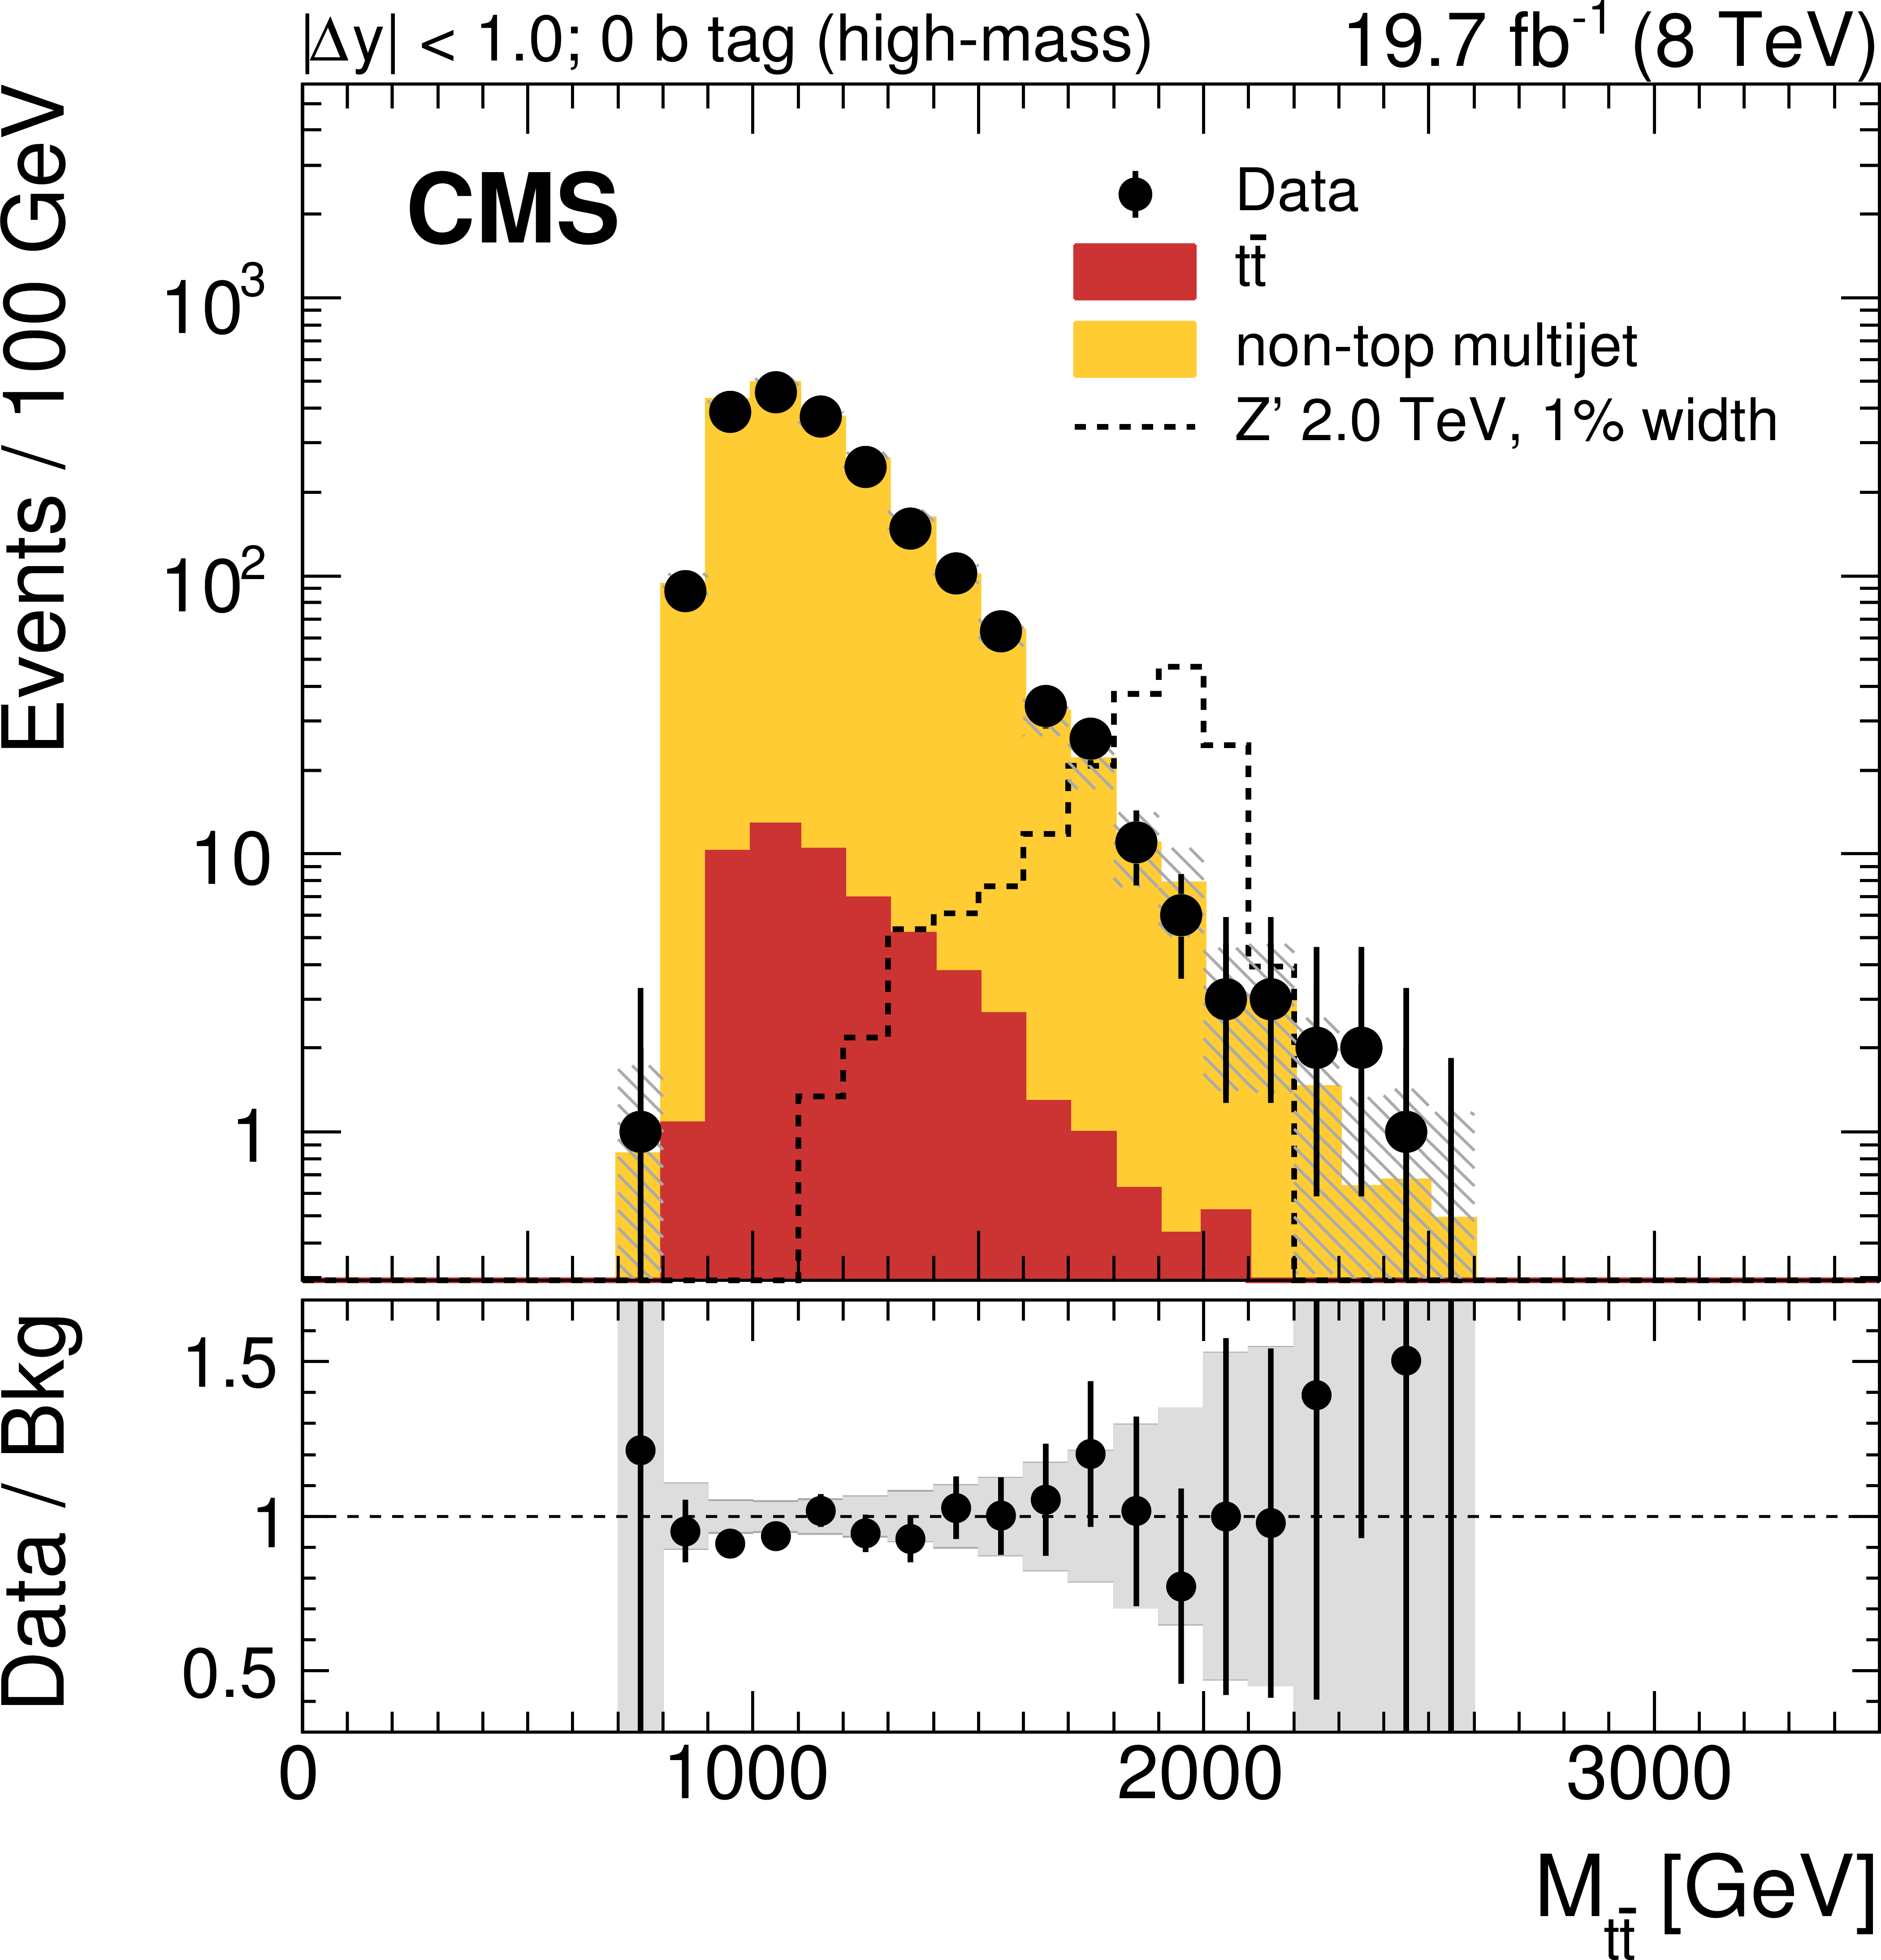
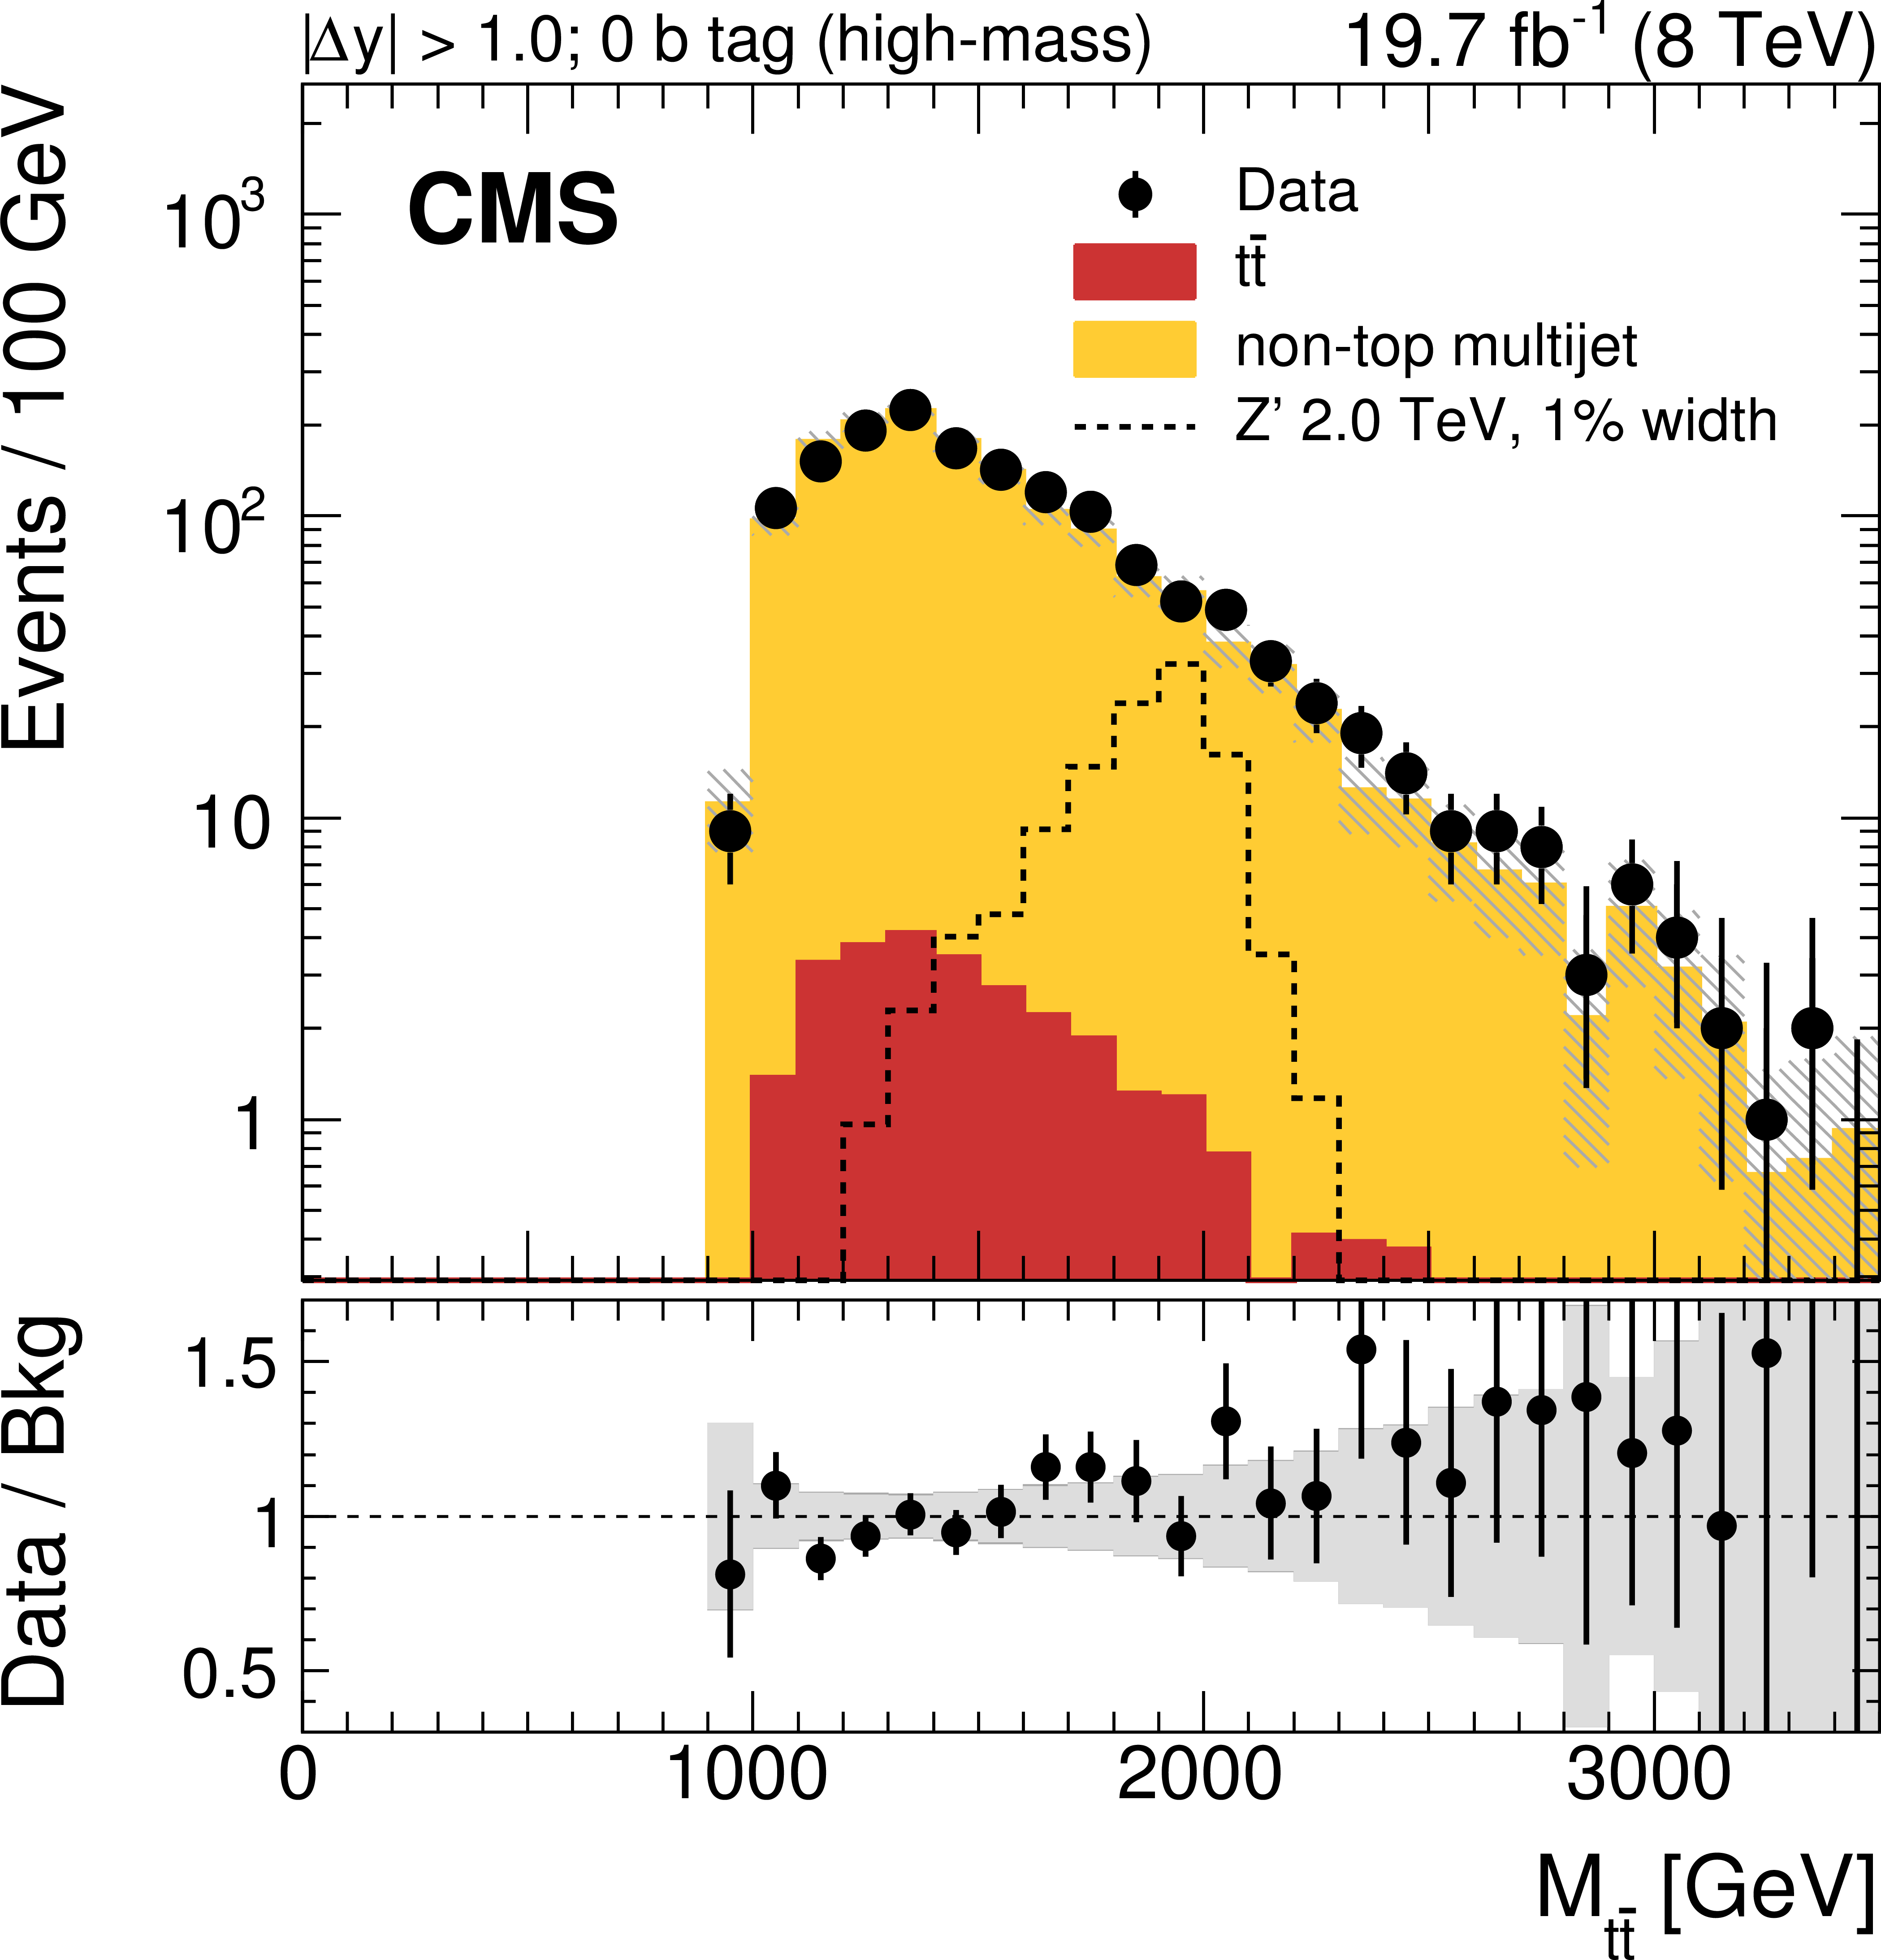
Figure 11-a:
Reconstructed invariant mass of the $ {\mathrm {t}\overline {\mathrm {t}}} $ pair in the all-hadronic channel for data and simulated events passing the high-mass selection. Events are divided into six categories: events with two subjet $ {\mathrm {b}}$-tags and $ {| \Delta y | } < 1.0$ (a), one subjet $ {\mathrm {b}}$ tag and $ {| \Delta y | } < 1.0$ (c), no subjet $ {\mathrm {b}}$ tag and $ {| \Delta y | } < 1.0$ (e), two subjet $ {\mathrm {b}}$ tags and $ {| \Delta y | } > 1.0$ (b), one subjet $ {\mathrm {b}}$ tag and $ {| \Delta y | } > 1.0$ (d), no subjet ${\mathrm {b}}$ tag and $ {| \Delta y | } > 1.0$ (f). The uncertainty associated with the background expectation includes all the statistical and systematic uncertainties. The data-to-background ratio is shown in the bottom panel of each figure. For the ratio plot, the statistical uncertainty is shown in light gray, while the total uncertainty, which is the quadratic sum of the statistical and systematic uncertainties, is shown in dark gray. The expected distribution from a Z' signal with $ {M_{ {\mathrm {Z}^\prime } }} =$ 2 TeV and $ {\Gamma _{ {\mathrm {Z}^\prime } }/M_{ {\mathrm {Z}^\prime } }} =$ 0.01 is also shown, normalized to a cross section of 1 pb. |
png pdf |
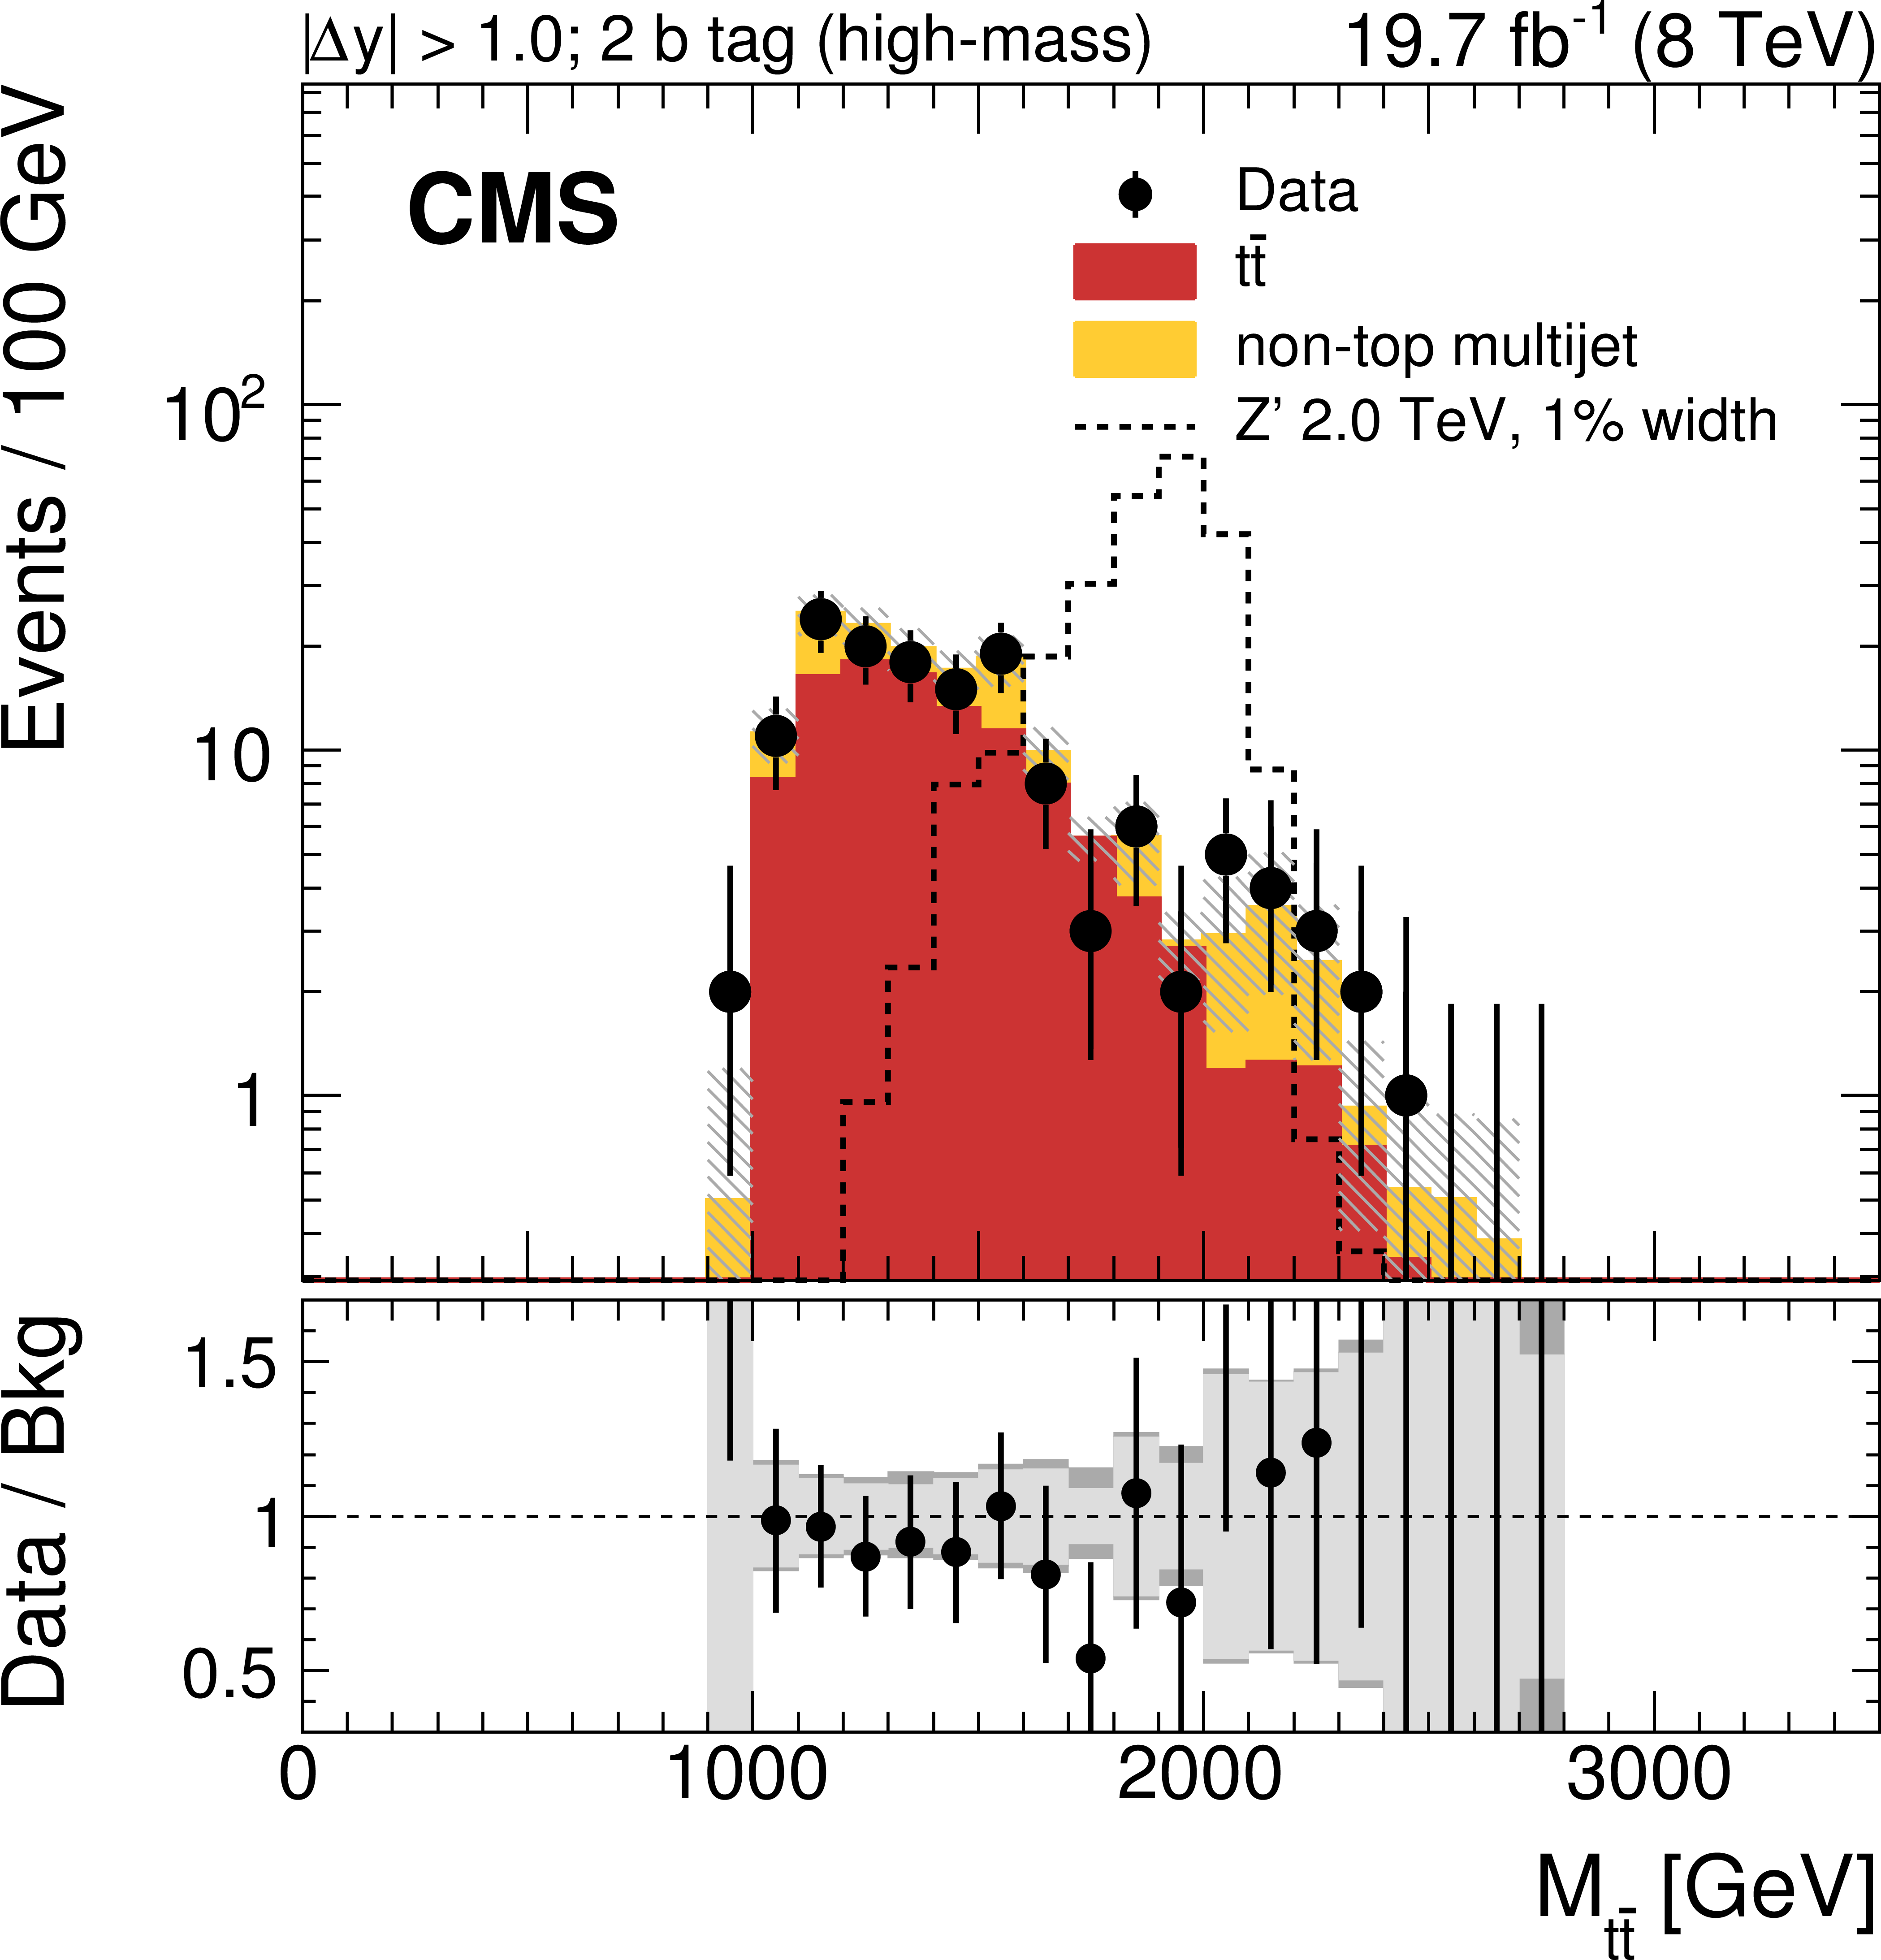
Figure 11-b:
Reconstructed invariant mass of the $ {\mathrm {t}\overline {\mathrm {t}}} $ pair in the all-hadronic channel for data and simulated events passing the high-mass selection. Events are divided into six categories: events with two subjet $ {\mathrm {b}}$-tags and $ {| \Delta y | } < 1.0$ (a), one subjet $ {\mathrm {b}}$ tag and $ {| \Delta y | } < 1.0$ (c), no subjet $ {\mathrm {b}}$ tag and $ {| \Delta y | } < 1.0$ (e), two subjet $ {\mathrm {b}}$ tags and $ {| \Delta y | } > 1.0$ (b), one subjet $ {\mathrm {b}}$ tag and $ {| \Delta y | } > 1.0$ (d), no subjet ${\mathrm {b}}$ tag and $ {| \Delta y | } > 1.0$ (f). The uncertainty associated with the background expectation includes all the statistical and systematic uncertainties. The data-to-background ratio is shown in the bottom panel of each figure. For the ratio plot, the statistical uncertainty is shown in light gray, while the total uncertainty, which is the quadratic sum of the statistical and systematic uncertainties, is shown in dark gray. The expected distribution from a Z' signal with $ {M_{ {\mathrm {Z}^\prime } }} =$ 2 TeV and $ {\Gamma _{ {\mathrm {Z}^\prime } }/M_{ {\mathrm {Z}^\prime } }} =$ 0.01 is also shown, normalized to a cross section of 1 pb. |
png pdf |
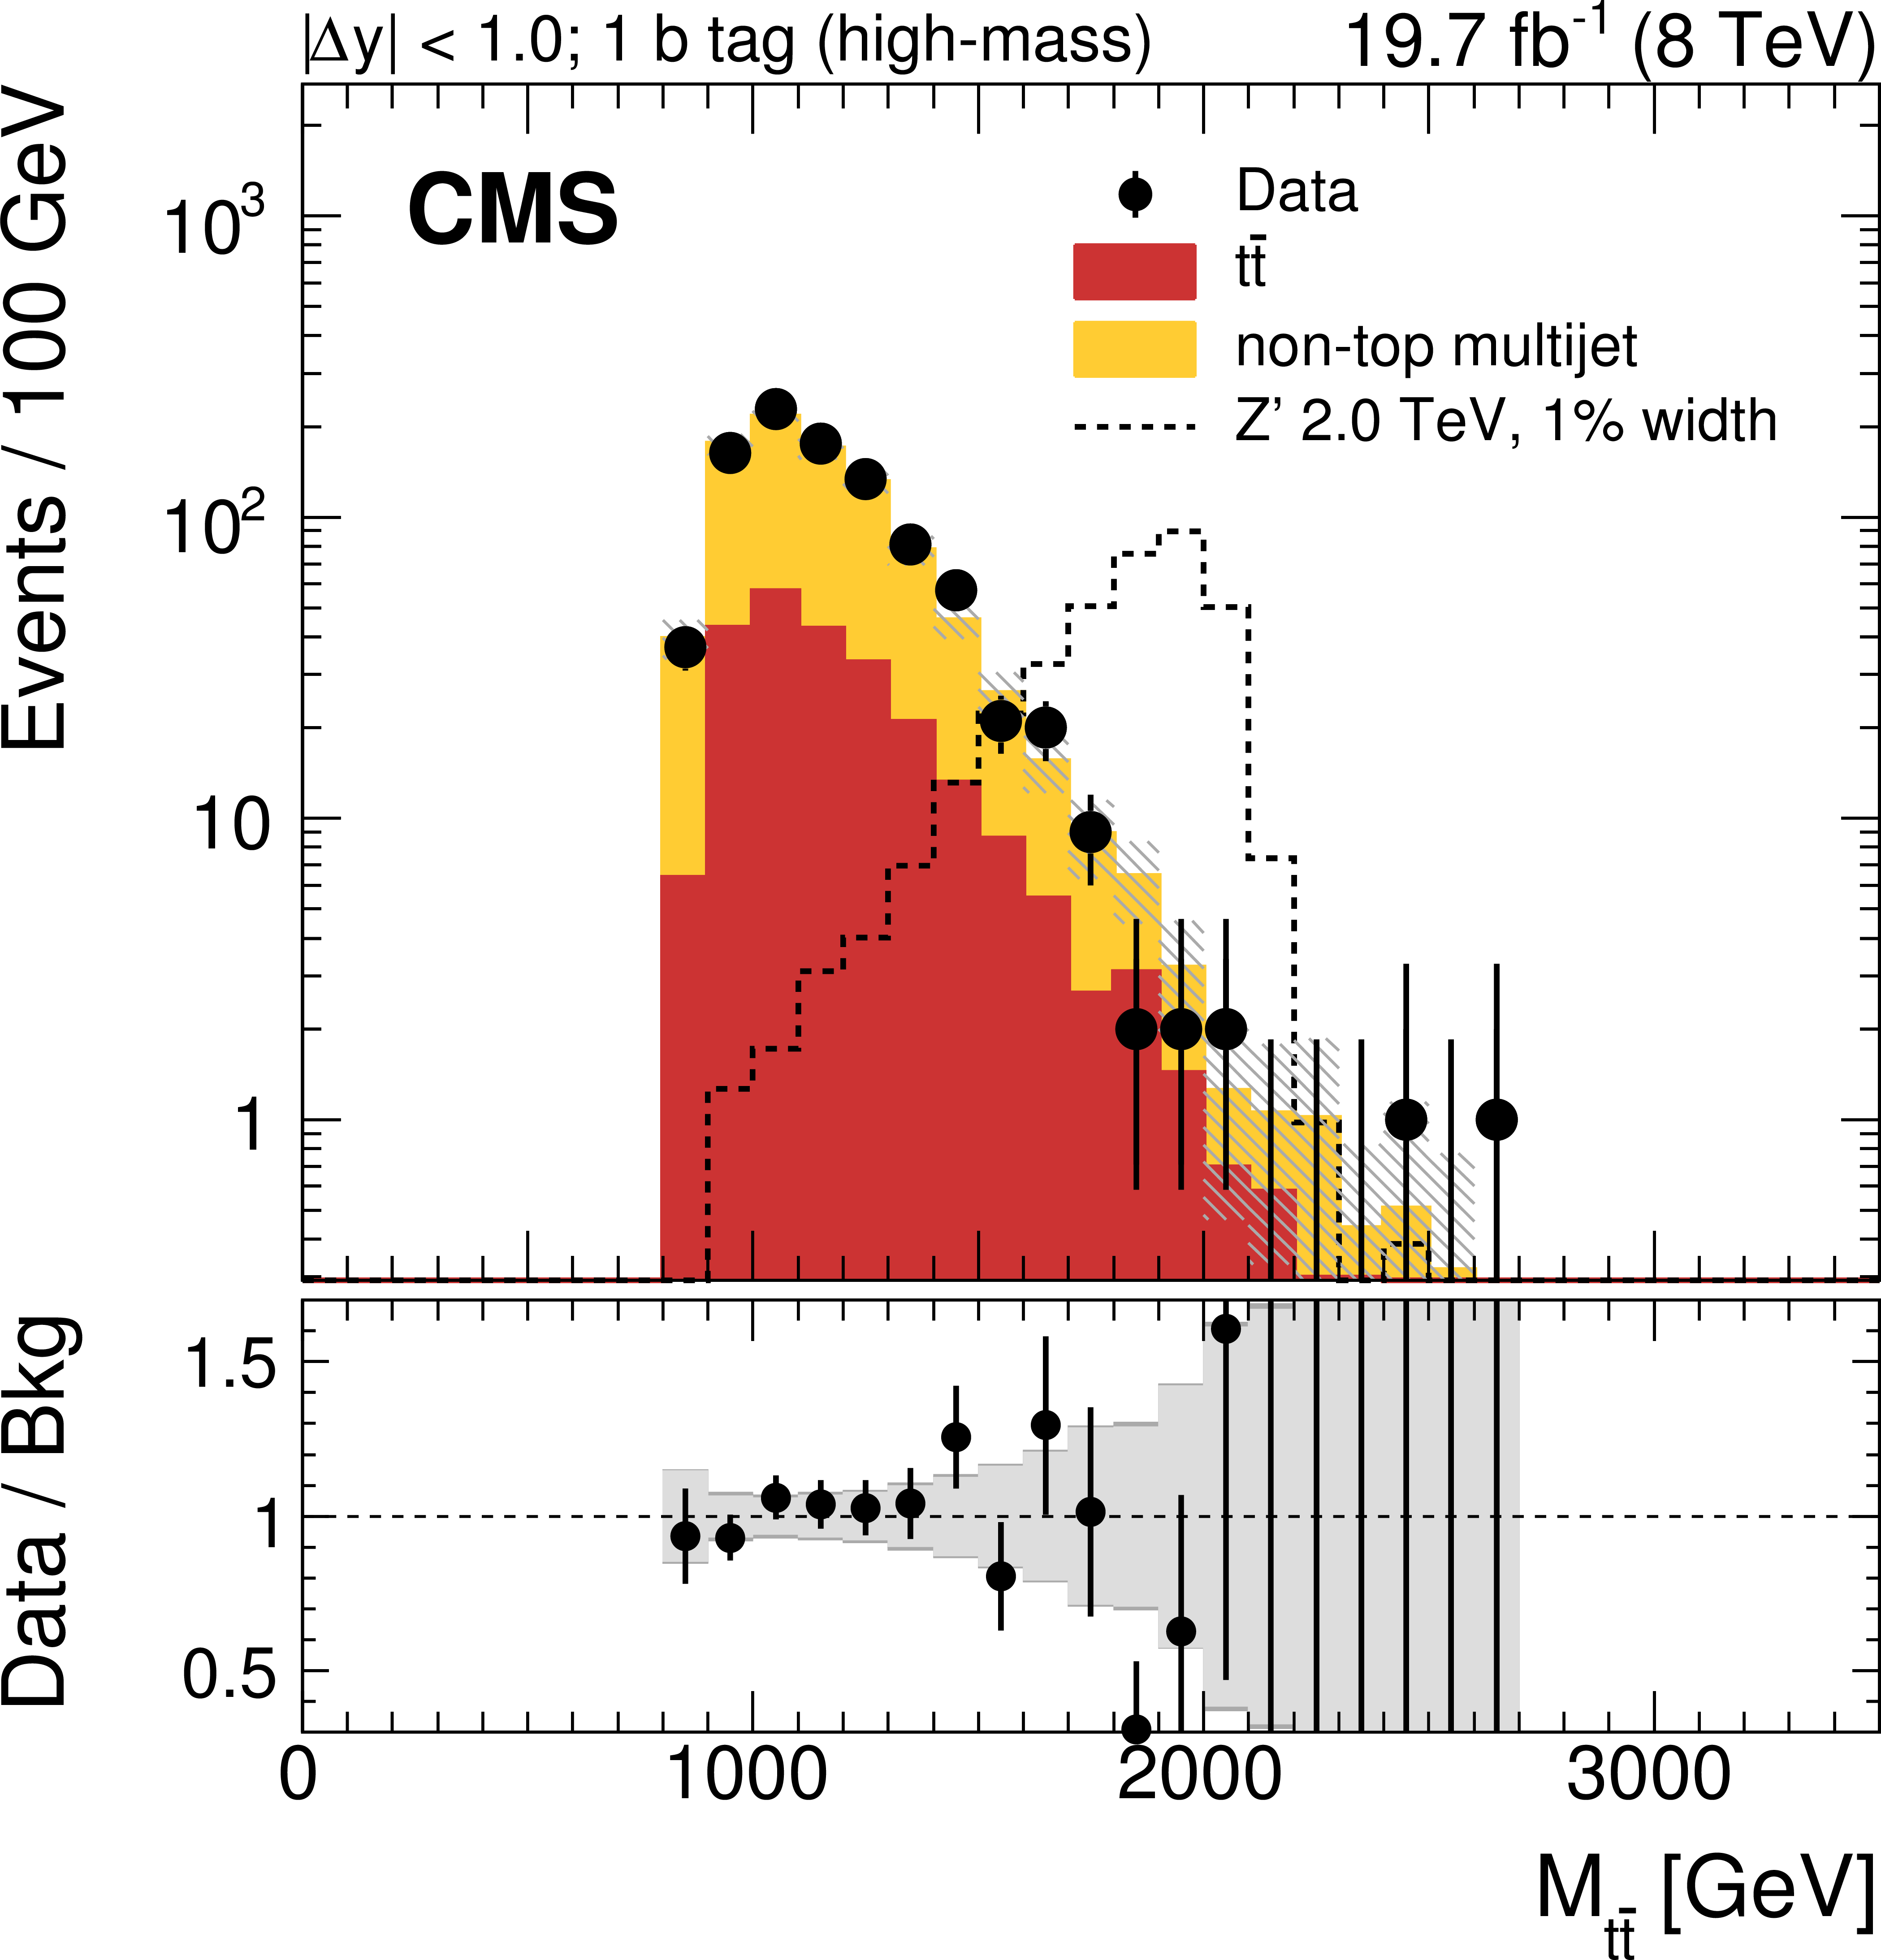
Figure 11-c:
Reconstructed invariant mass of the $ {\mathrm {t}\overline {\mathrm {t}}} $ pair in the all-hadronic channel for data and simulated events passing the high-mass selection. Events are divided into six categories: events with two subjet $ {\mathrm {b}}$-tags and $ {| \Delta y | } < 1.0$ (a), one subjet $ {\mathrm {b}}$ tag and $ {| \Delta y | } < 1.0$ (c), no subjet $ {\mathrm {b}}$ tag and $ {| \Delta y | } < 1.0$ (e), two subjet $ {\mathrm {b}}$ tags and $ {| \Delta y | } > 1.0$ (b), one subjet $ {\mathrm {b}}$ tag and $ {| \Delta y | } > 1.0$ (d), no subjet ${\mathrm {b}}$ tag and $ {| \Delta y | } > 1.0$ (f). The uncertainty associated with the background expectation includes all the statistical and systematic uncertainties. The data-to-background ratio is shown in the bottom panel of each figure. For the ratio plot, the statistical uncertainty is shown in light gray, while the total uncertainty, which is the quadratic sum of the statistical and systematic uncertainties, is shown in dark gray. The expected distribution from a Z' signal with $ {M_{ {\mathrm {Z}^\prime } }} =$ 2 TeV and $ {\Gamma _{ {\mathrm {Z}^\prime } }/M_{ {\mathrm {Z}^\prime } }} =$ 0.01 is also shown, normalized to a cross section of 1 pb. |
png pdf |
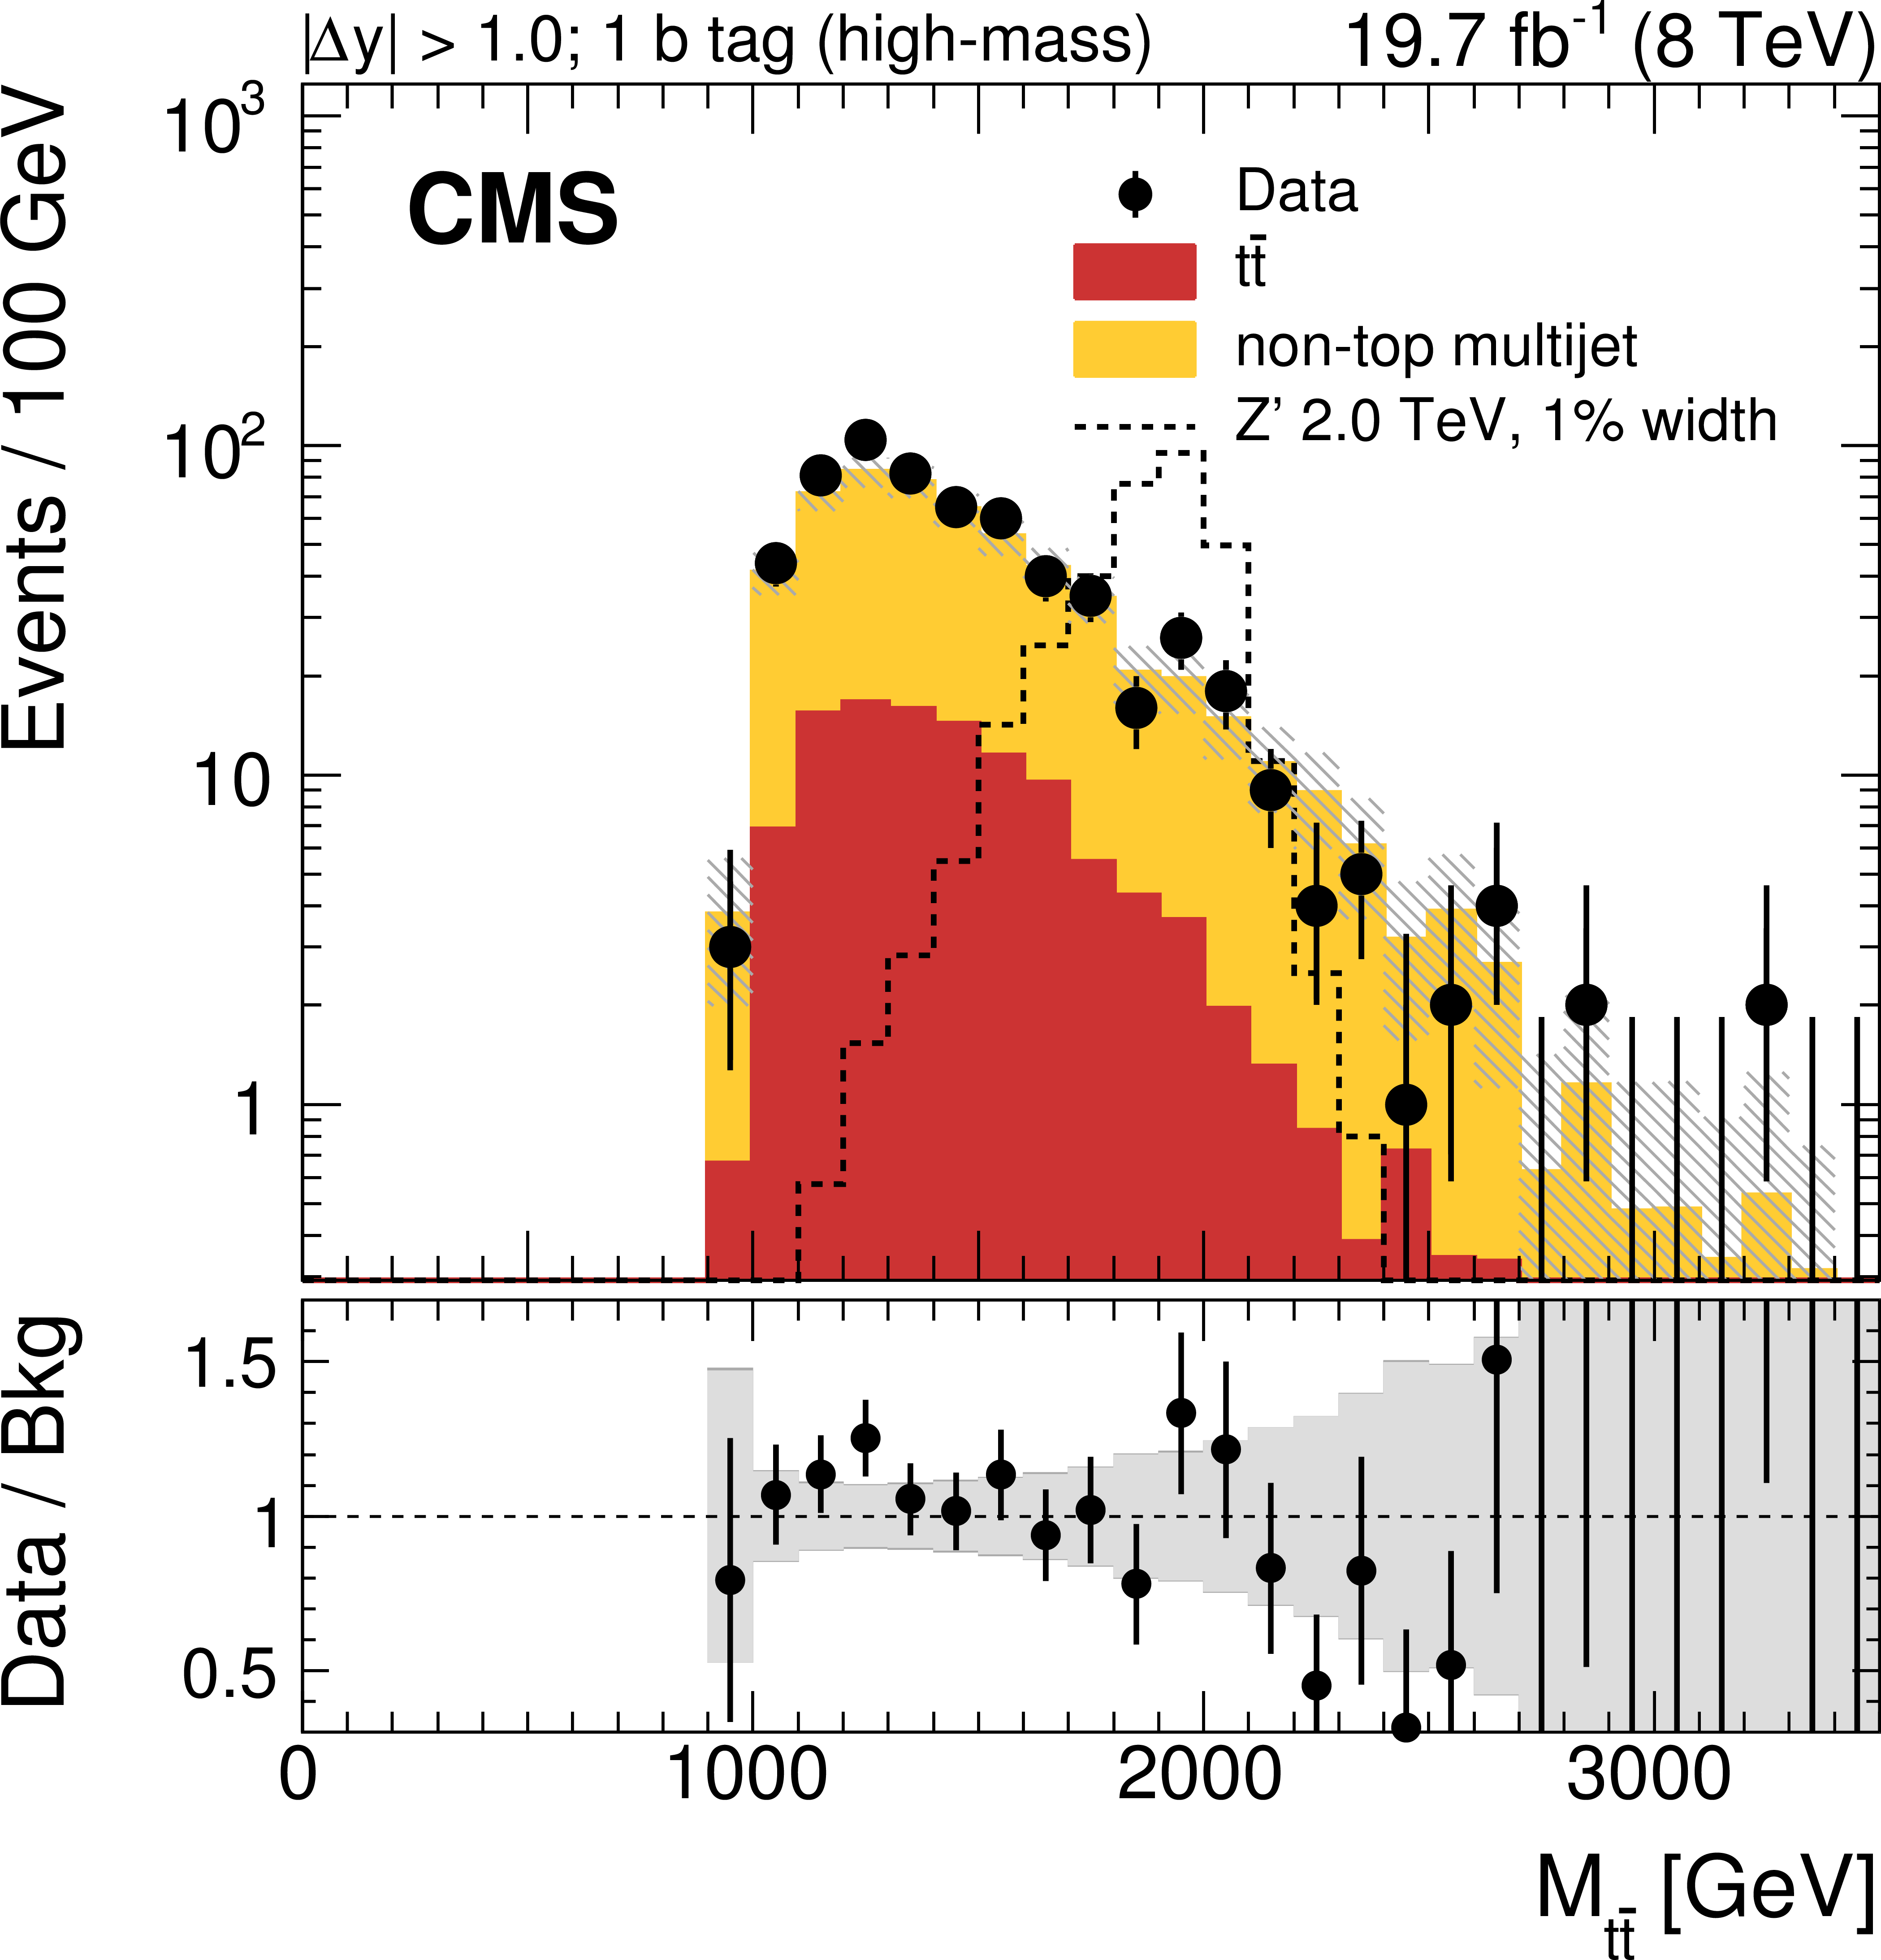
Figure 11-d:
Reconstructed invariant mass of the $ {\mathrm {t}\overline {\mathrm {t}}} $ pair in the all-hadronic channel for data and simulated events passing the high-mass selection. Events are divided into six categories: events with two subjet $ {\mathrm {b}}$-tags and $ {| \Delta y | } < 1.0$ (a), one subjet $ {\mathrm {b}}$ tag and $ {| \Delta y | } < 1.0$ (c), no subjet $ {\mathrm {b}}$ tag and $ {| \Delta y | } < 1.0$ (e), two subjet $ {\mathrm {b}}$ tags and $ {| \Delta y | } > 1.0$ (b), one subjet $ {\mathrm {b}}$ tag and $ {| \Delta y | } > 1.0$ (d), no subjet ${\mathrm {b}}$ tag and $ {| \Delta y | } > 1.0$ (f). The uncertainty associated with the background expectation includes all the statistical and systematic uncertainties. The data-to-background ratio is shown in the bottom panel of each figure. For the ratio plot, the statistical uncertainty is shown in light gray, while the total uncertainty, which is the quadratic sum of the statistical and systematic uncertainties, is shown in dark gray. The expected distribution from a Z' signal with $ {M_{ {\mathrm {Z}^\prime } }} =$ 2 TeV and $ {\Gamma _{ {\mathrm {Z}^\prime } }/M_{ {\mathrm {Z}^\prime } }} =$ 0.01 is also shown, normalized to a cross section of 1 pb. |
png pdf |
Figure 11-e:
Reconstructed invariant mass of the $ {\mathrm {t}\overline {\mathrm {t}}} $ pair in the all-hadronic channel for data and simulated events passing the high-mass selection. Events are divided into six categories: events with two subjet $ {\mathrm {b}}$-tags and $ {| \Delta y | } < 1.0$ (a), one subjet $ {\mathrm {b}}$ tag and $ {| \Delta y | } < 1.0$ (c), no subjet $ {\mathrm {b}}$ tag and $ {| \Delta y | } < 1.0$ (e), two subjet $ {\mathrm {b}}$ tags and $ {| \Delta y | } > 1.0$ (b), one subjet $ {\mathrm {b}}$ tag and $ {| \Delta y | } > 1.0$ (d), no subjet ${\mathrm {b}}$ tag and $ {| \Delta y | } > 1.0$ (f). The uncertainty associated with the background expectation includes all the statistical and systematic uncertainties. The data-to-background ratio is shown in the bottom panel of each figure. For the ratio plot, the statistical uncertainty is shown in light gray, while the total uncertainty, which is the quadratic sum of the statistical and systematic uncertainties, is shown in dark gray. The expected distribution from a Z' signal with $ {M_{ {\mathrm {Z}^\prime } }} =$ 2 TeV and $ {\Gamma _{ {\mathrm {Z}^\prime } }/M_{ {\mathrm {Z}^\prime } }} =$ 0.01 is also shown, normalized to a cross section of 1 pb. |
png pdf |
Figure 11-f:
Reconstructed invariant mass of the $ {\mathrm {t}\overline {\mathrm {t}}} $ pair in the all-hadronic channel for data and simulated events passing the high-mass selection. Events are divided into six categories: events with two subjet $ {\mathrm {b}}$-tags and $ {| \Delta y | } < 1.0$ (a), one subjet $ {\mathrm {b}}$ tag and $ {| \Delta y | } < 1.0$ (c), no subjet $ {\mathrm {b}}$ tag and $ {| \Delta y | } < 1.0$ (e), two subjet $ {\mathrm {b}}$ tags and $ {| \Delta y | } > 1.0$ (b), one subjet $ {\mathrm {b}}$ tag and $ {| \Delta y | } > 1.0$ (d), no subjet ${\mathrm {b}}$ tag and $ {| \Delta y | } > 1.0$ (f). The uncertainty associated with the background expectation includes all the statistical and systematic uncertainties. The data-to-background ratio is shown in the bottom panel of each figure. For the ratio plot, the statistical uncertainty is shown in light gray, while the total uncertainty, which is the quadratic sum of the statistical and systematic uncertainties, is shown in dark gray. The expected distribution from a Z' signal with $ {M_{ {\mathrm {Z}^\prime } }} =$ 2 TeV and $ {\Gamma _{ {\mathrm {Z}^\prime } }/M_{ {\mathrm {Z}^\prime } }} =$ 0.01 is also shown, normalized to a cross section of 1 pb. |
png pdf |
Figure 12-a:
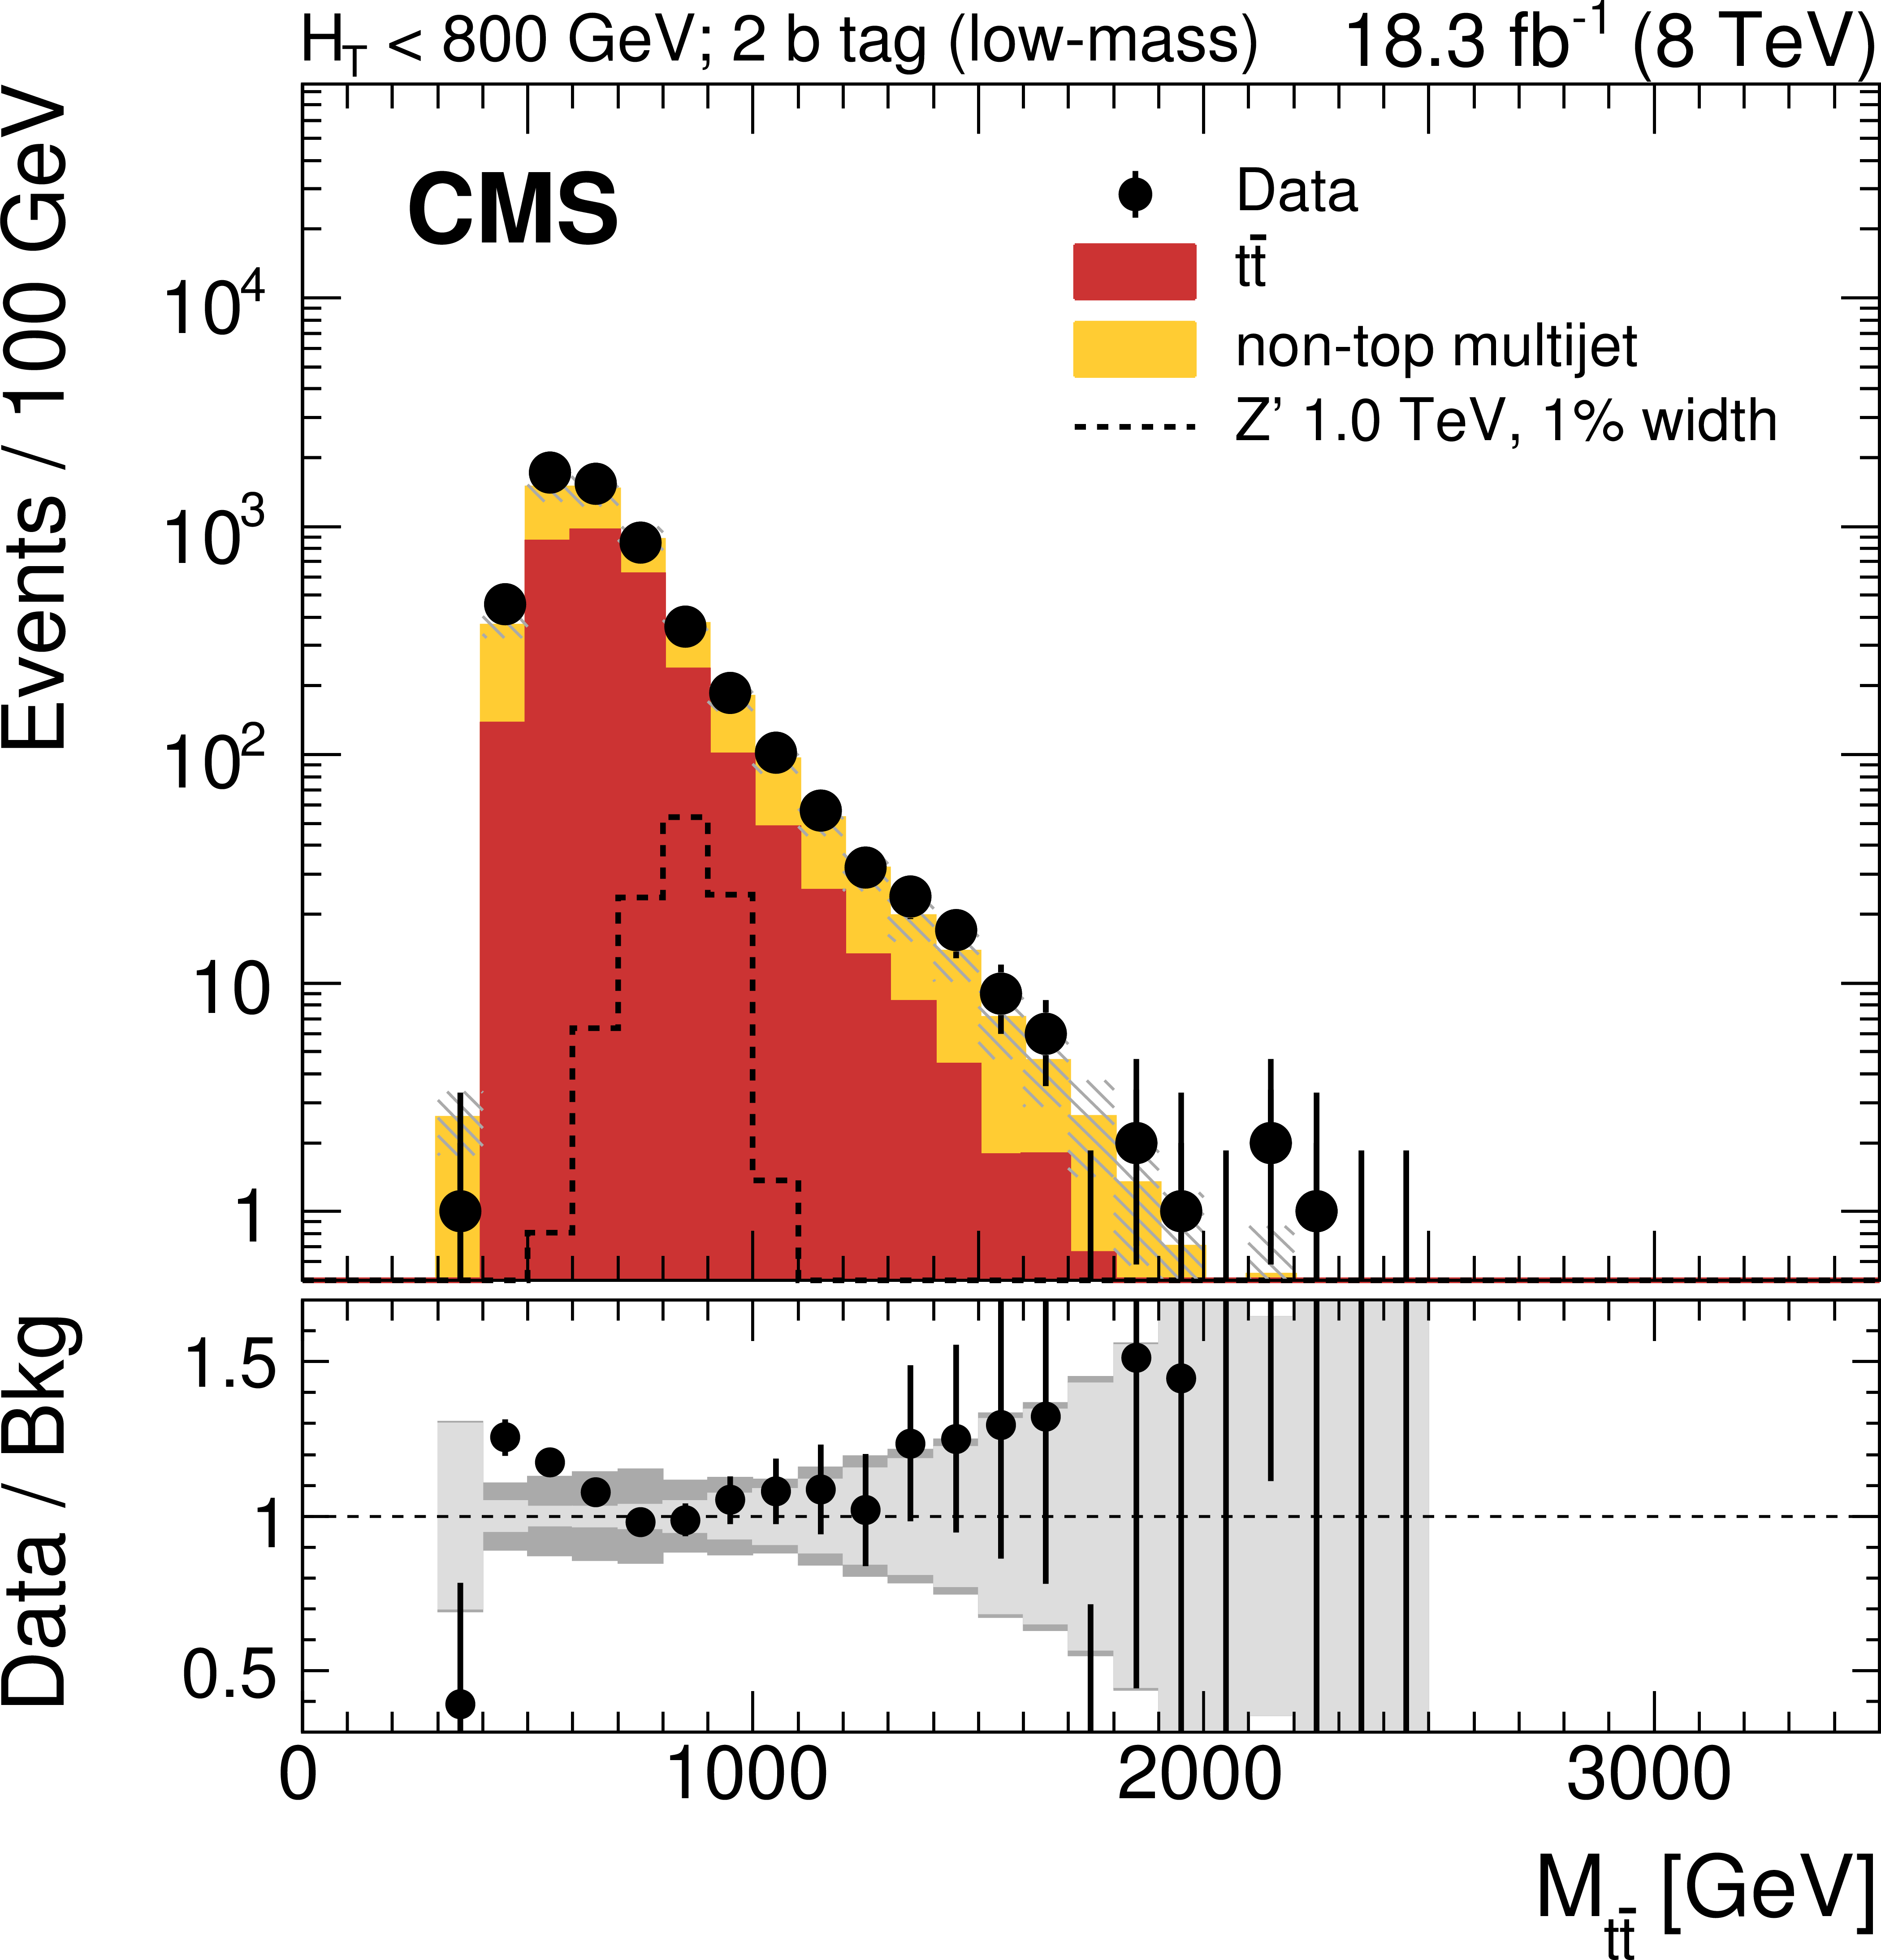
Reconstructed invariant mass of the $ {\mathrm {t}\overline {\mathrm {t}}} $ pair in the all-hadronic channel for data and simulated events passing the low-mass selection. Events with two subjet $ {\mathrm {b}}$ tags are shown, for $ {H_{\mathrm {T}}} <$ 800 GeV (left) and $ {H_{\mathrm {T}}} >$ 800 GeV (b). The signal is normalized to a cross section of 1 pb. The uncertainty associated with the background expectation includes all the statistical and systematic uncertainties. The data-to-background ratio is shown in the bottom panel of each figure. For the ratio plot, the statistical uncertainty is shown in light gray, while the total uncertainty, which is the quadratic sum of the statistical and systematic uncertainties, is shown in dark gray. The expected distribution from a Z' signal with $ {M_{ {\mathrm {Z}^\prime } }} =$ 1 TeV and $ {\Gamma _{ {\mathrm {Z}^\prime } }/M_{ {\mathrm {Z}^\prime } }} =$ 0.01 is also shown, normalized to a cross section of 1 pb. |
png pdf |
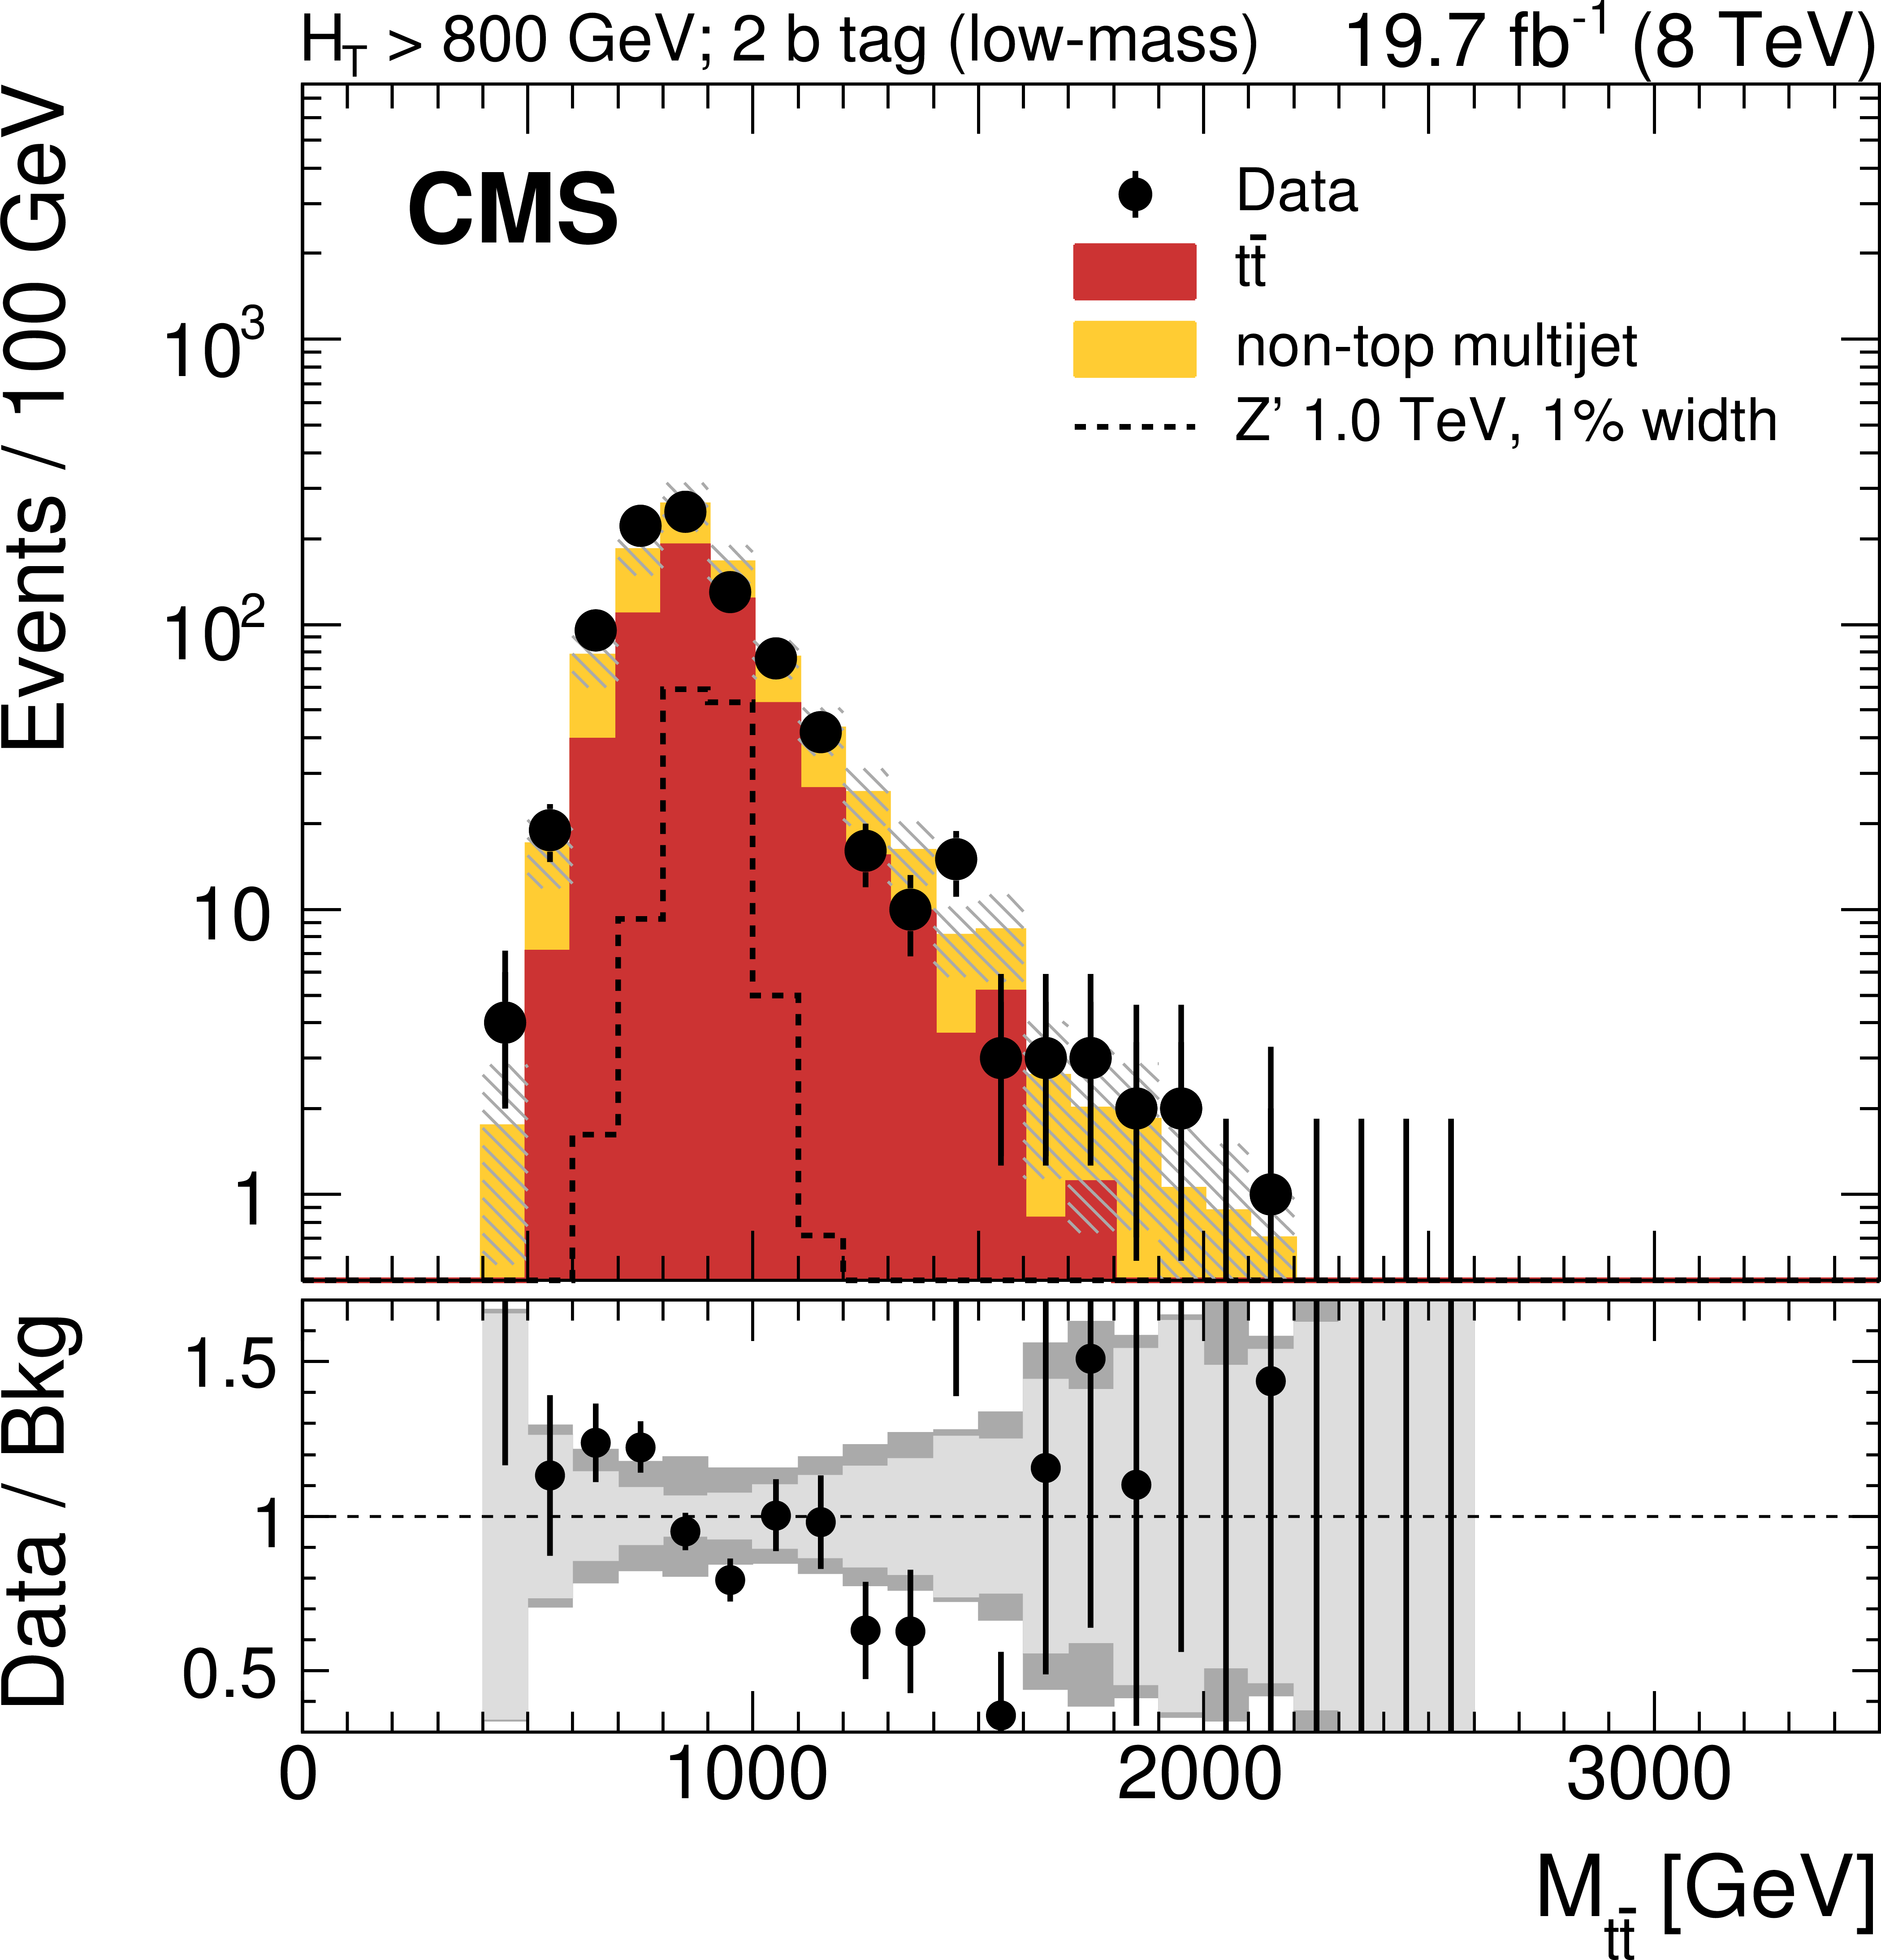
Figure 12-b:
Reconstructed invariant mass of the $ {\mathrm {t}\overline {\mathrm {t}}} $ pair in the all-hadronic channel for data and simulated events passing the low-mass selection. Events with two subjet $ {\mathrm {b}}$ tags are shown, for $ {H_{\mathrm {T}}} <$ 800 GeV (left) and $ {H_{\mathrm {T}}} >$ 800 GeV (b). The signal is normalized to a cross section of 1 pb. The uncertainty associated with the background expectation includes all the statistical and systematic uncertainties. The data-to-background ratio is shown in the bottom panel of each figure. For the ratio plot, the statistical uncertainty is shown in light gray, while the total uncertainty, which is the quadratic sum of the statistical and systematic uncertainties, is shown in dark gray. The expected distribution from a Z' signal with $ {M_{ {\mathrm {Z}^\prime } }} =$ 1 TeV and $ {\Gamma _{ {\mathrm {Z}^\prime } }/M_{ {\mathrm {Z}^\prime } }} =$ 0.01 is also shown, normalized to a cross section of 1 pb. |
png pdf |
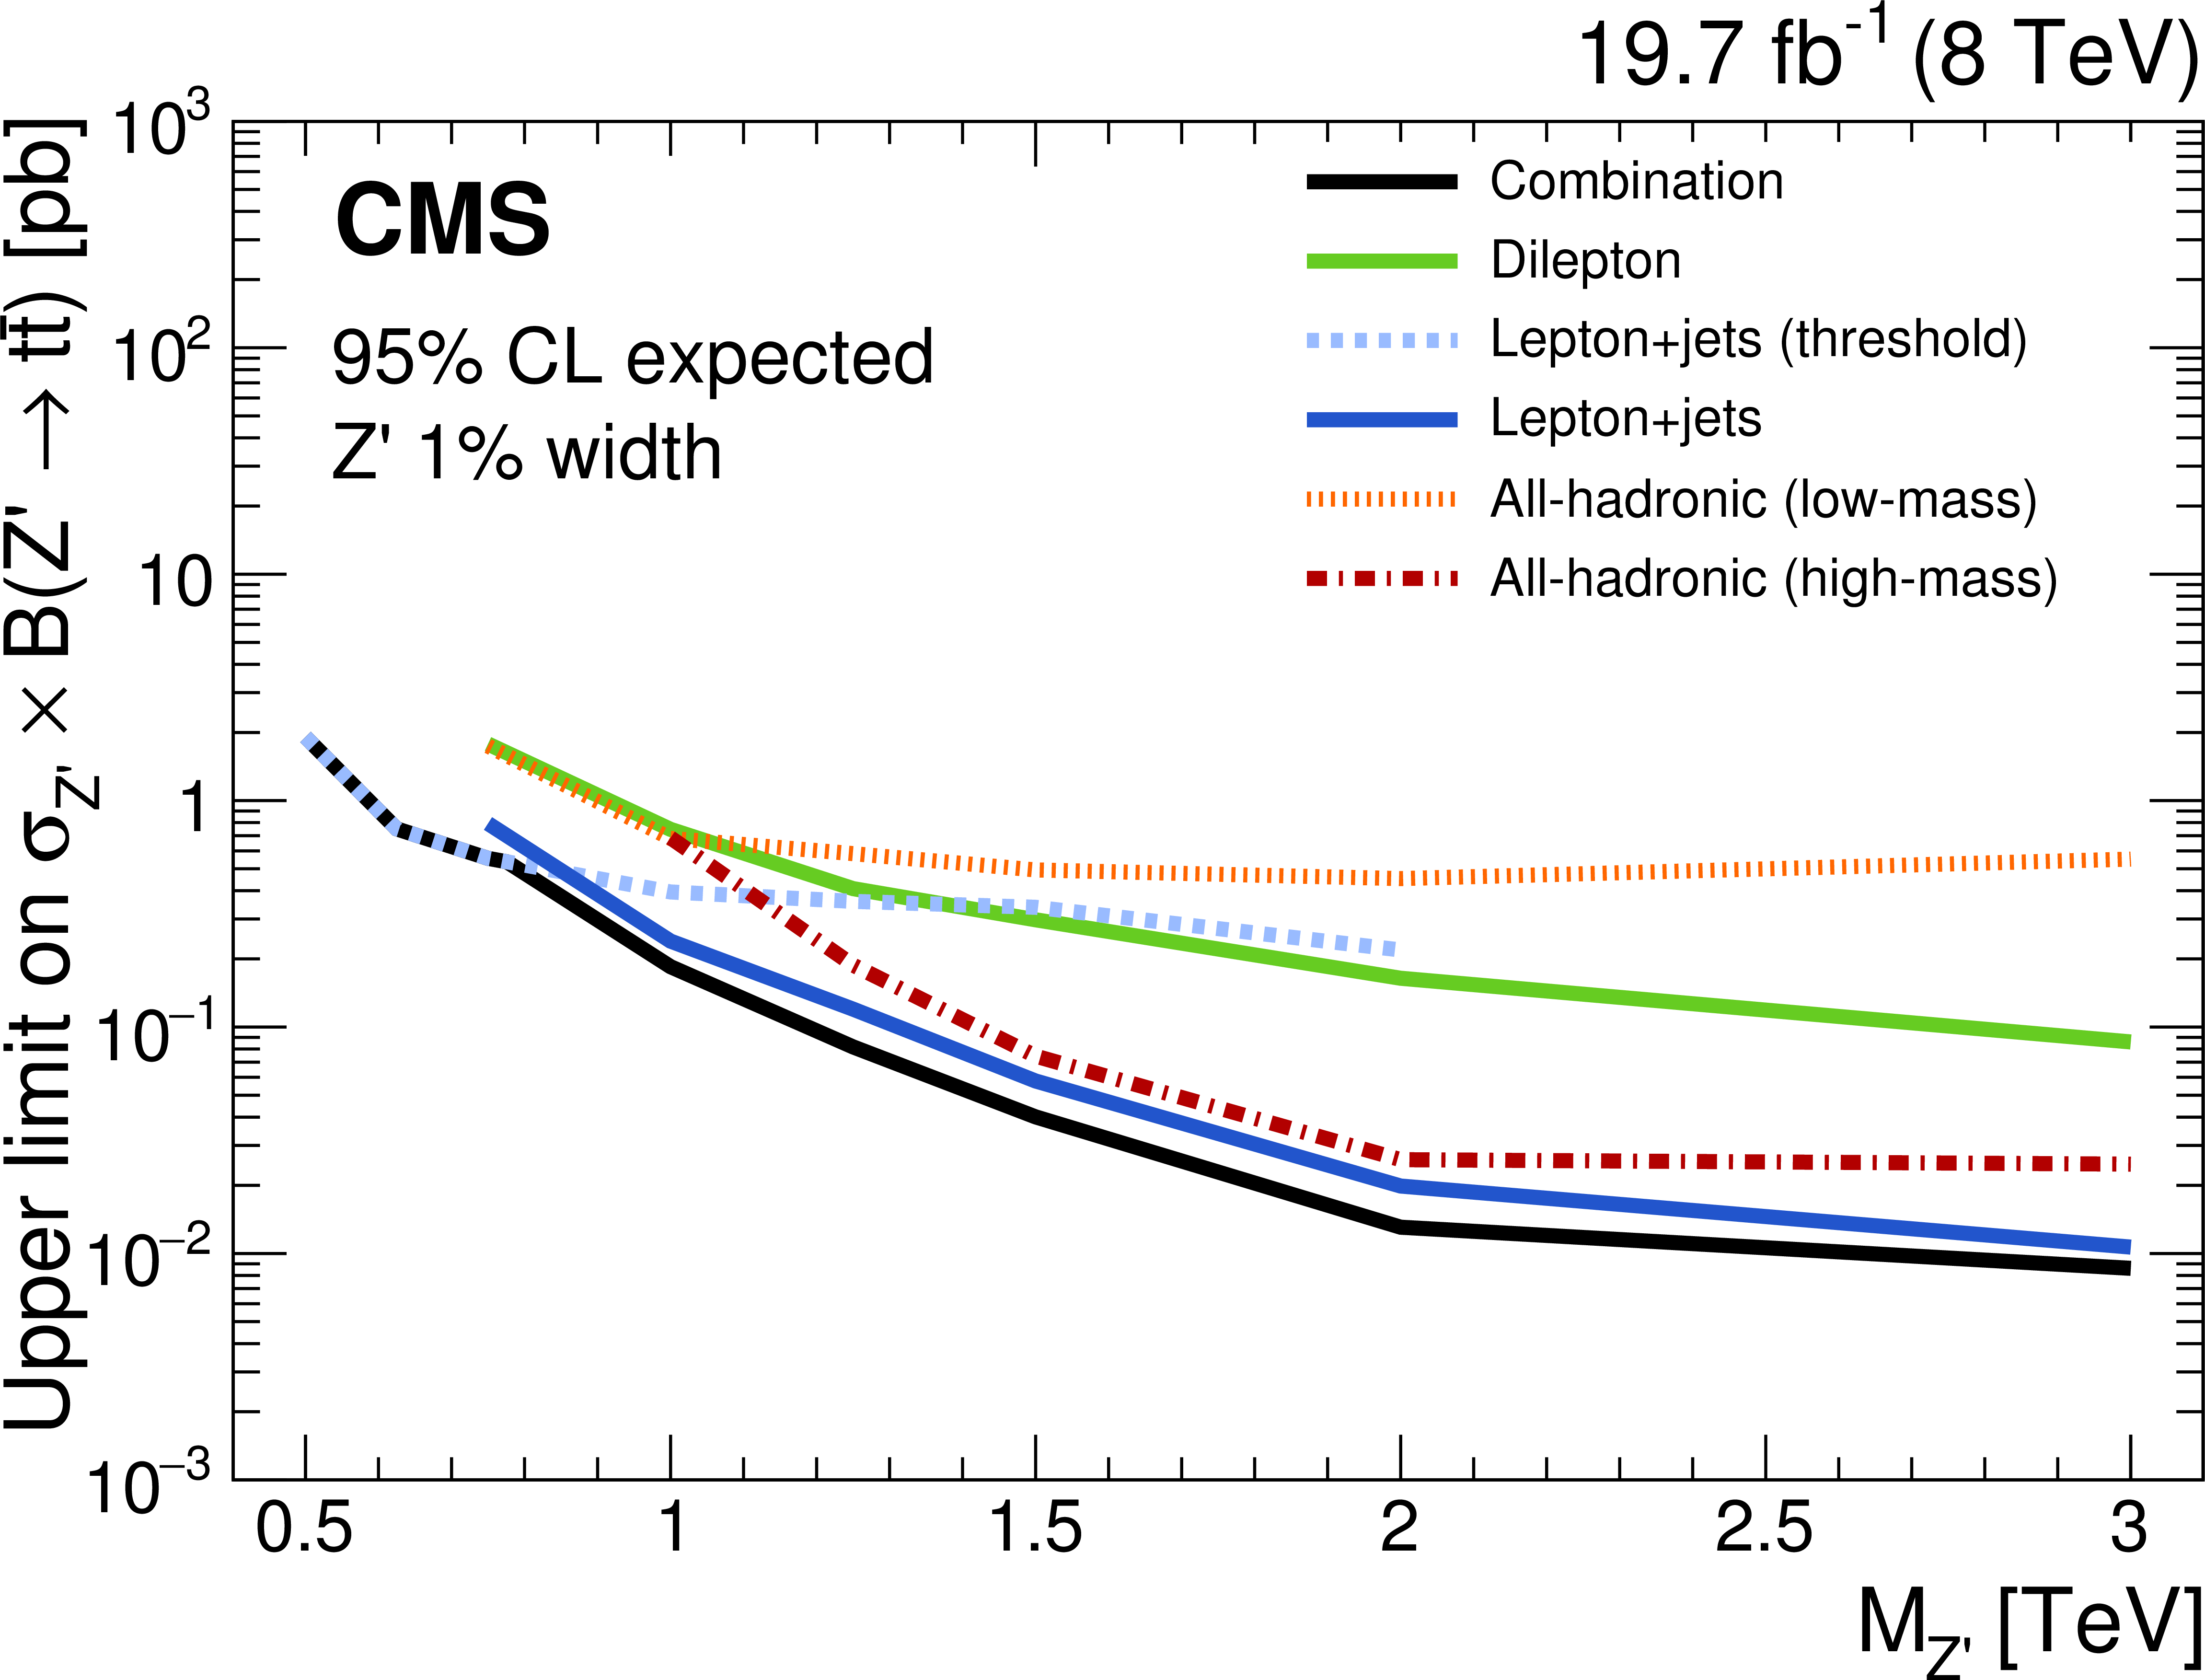
Figure 13-a:
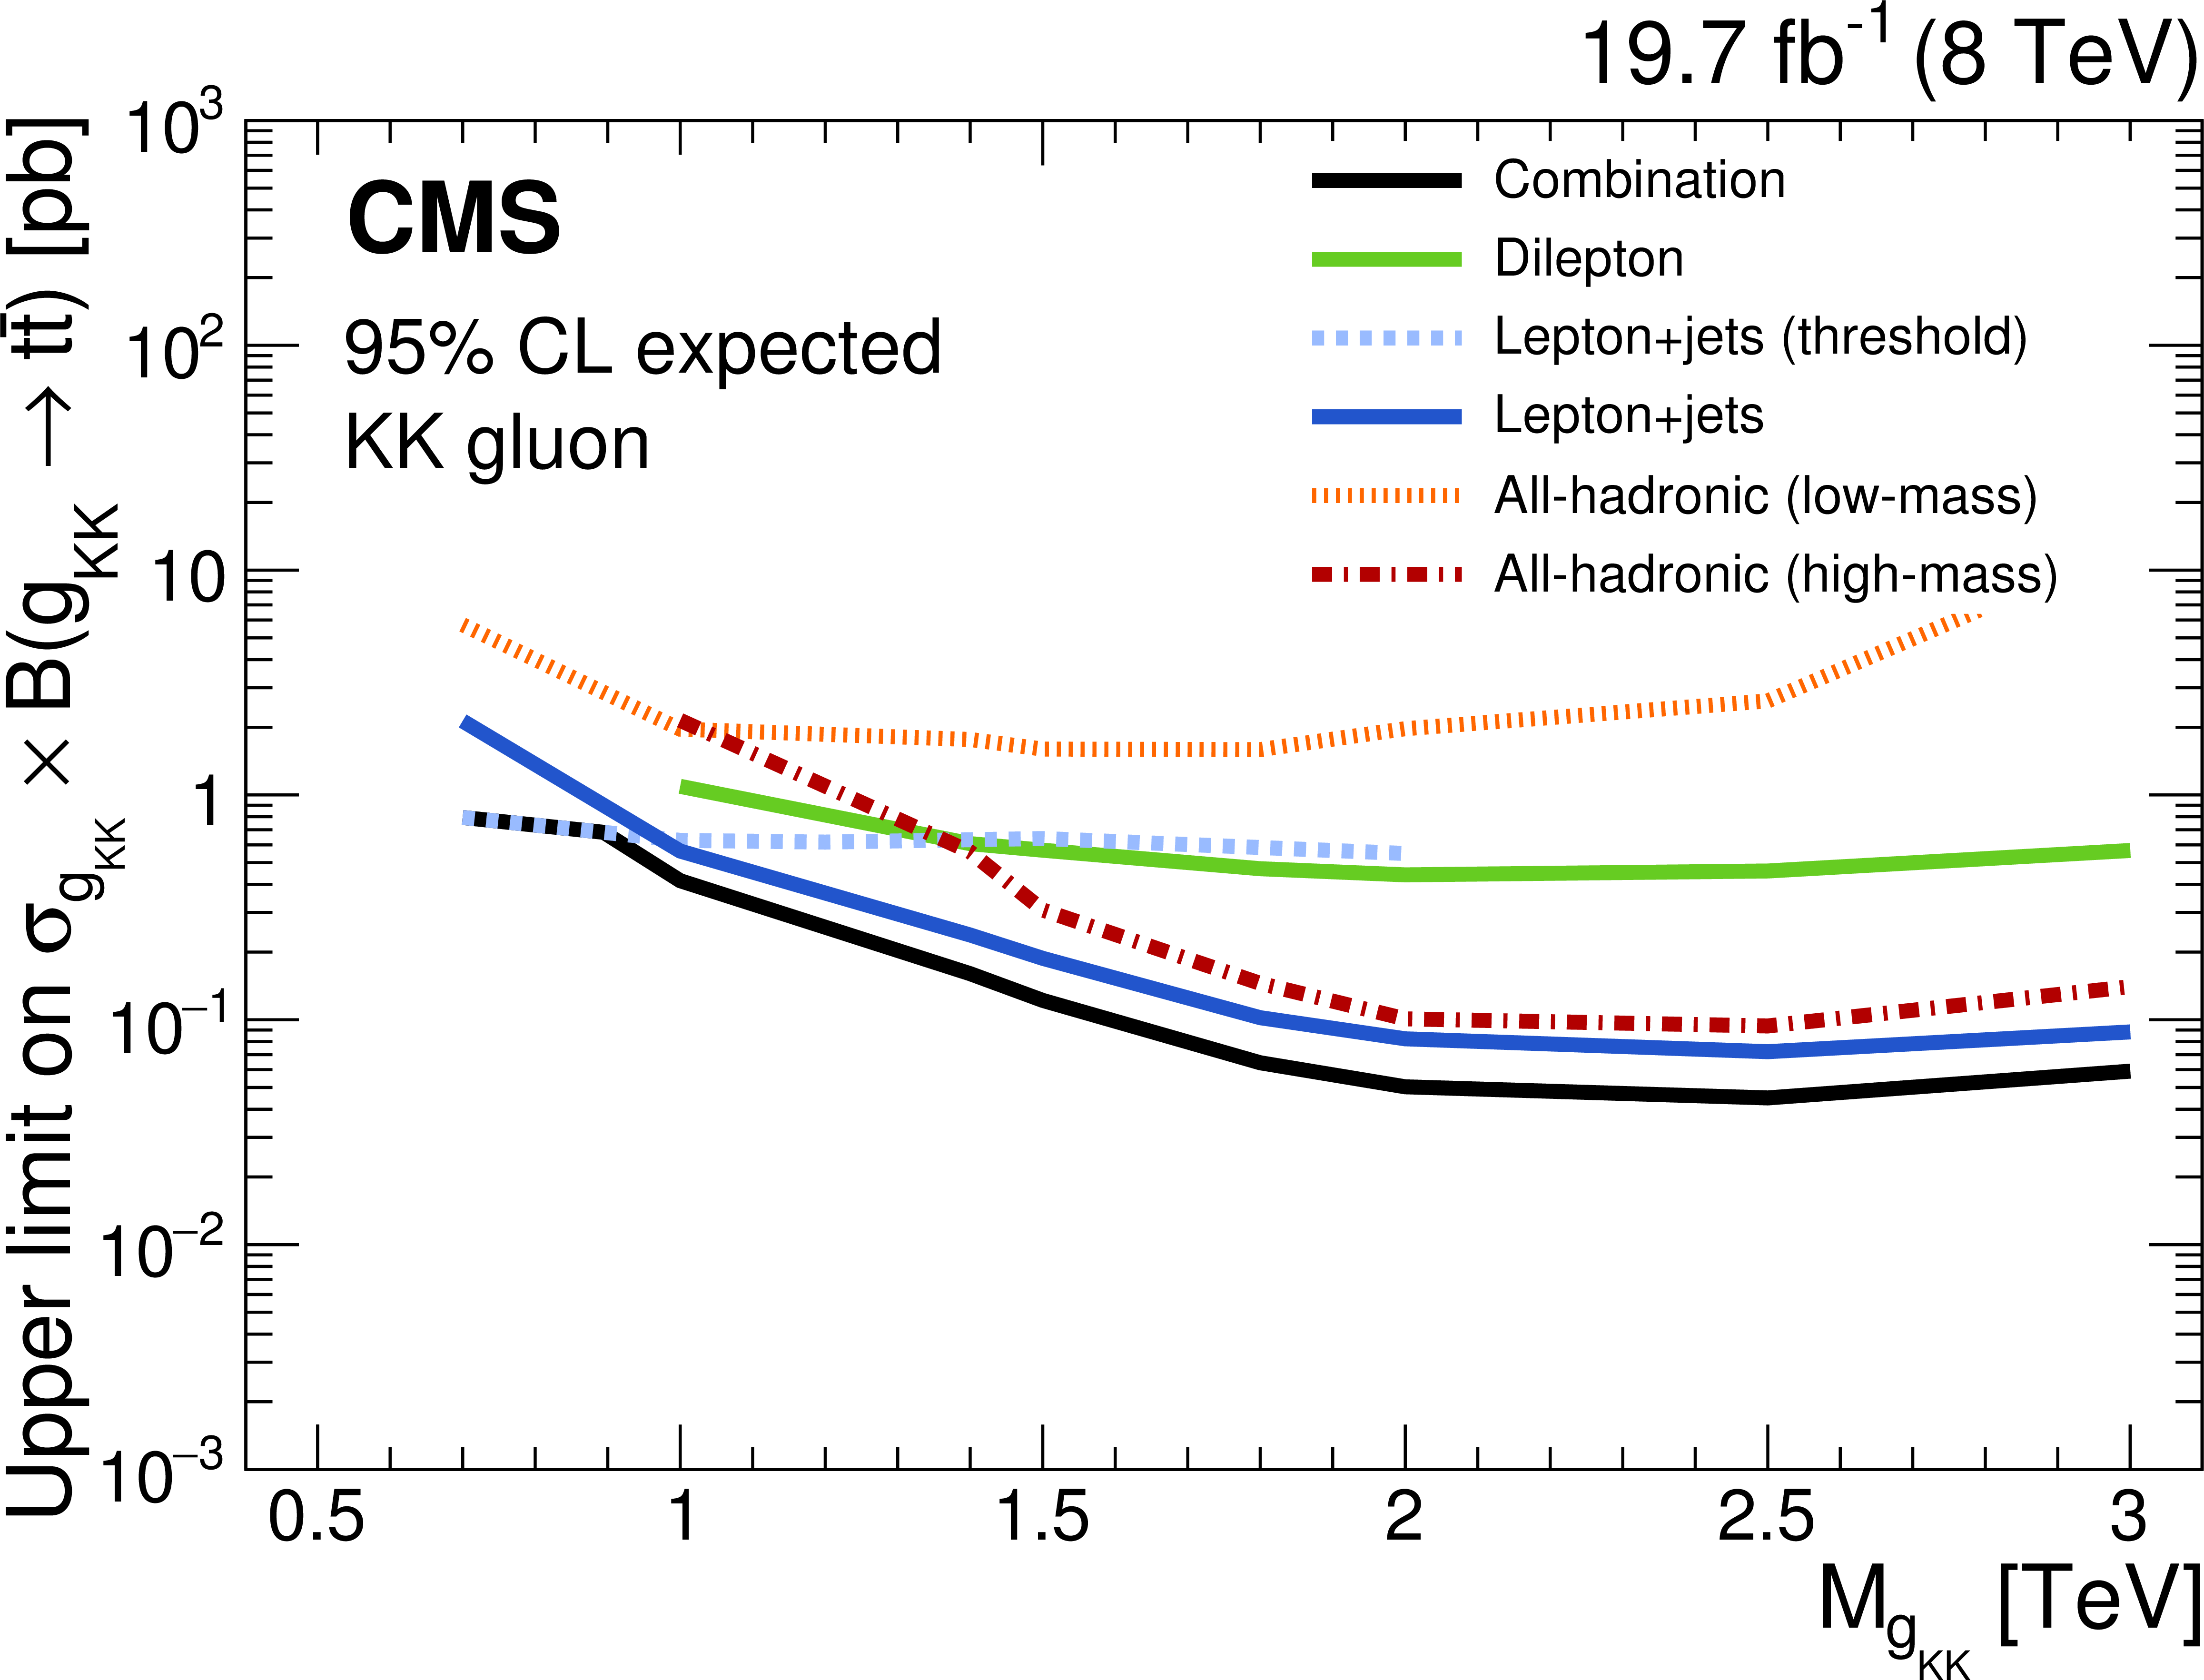
Expected 95% CL upper limits on the production cross section times branching fraction for a Z' boson decaying to $ {\mathrm {t}\overline {\mathrm {t}}} $ with 1% width (a) and a KK gluon in the RS model (b). The limits obtained from the individual channels are shown separately, together with the result from the combination. Also shown are results from a threshold analysis in the lepton+jets channel [31: CMS, PRL 111 (2013) 211804], optimized for low mass values. |
png pdf |
Figure 13-b:
Expected 95% CL upper limits on the production cross section times branching fraction for a Z' boson decaying to $ {\mathrm {t}\overline {\mathrm {t}}} $ with 1% width (a) and a KK gluon in the RS model (b). The limits obtained from the individual channels are shown separately, together with the result from the combination. Also shown are results from a threshold analysis in the lepton+jets channel [31: CMS, PRL 111 (2013) 211804], optimized for low mass values. |
png pdf |
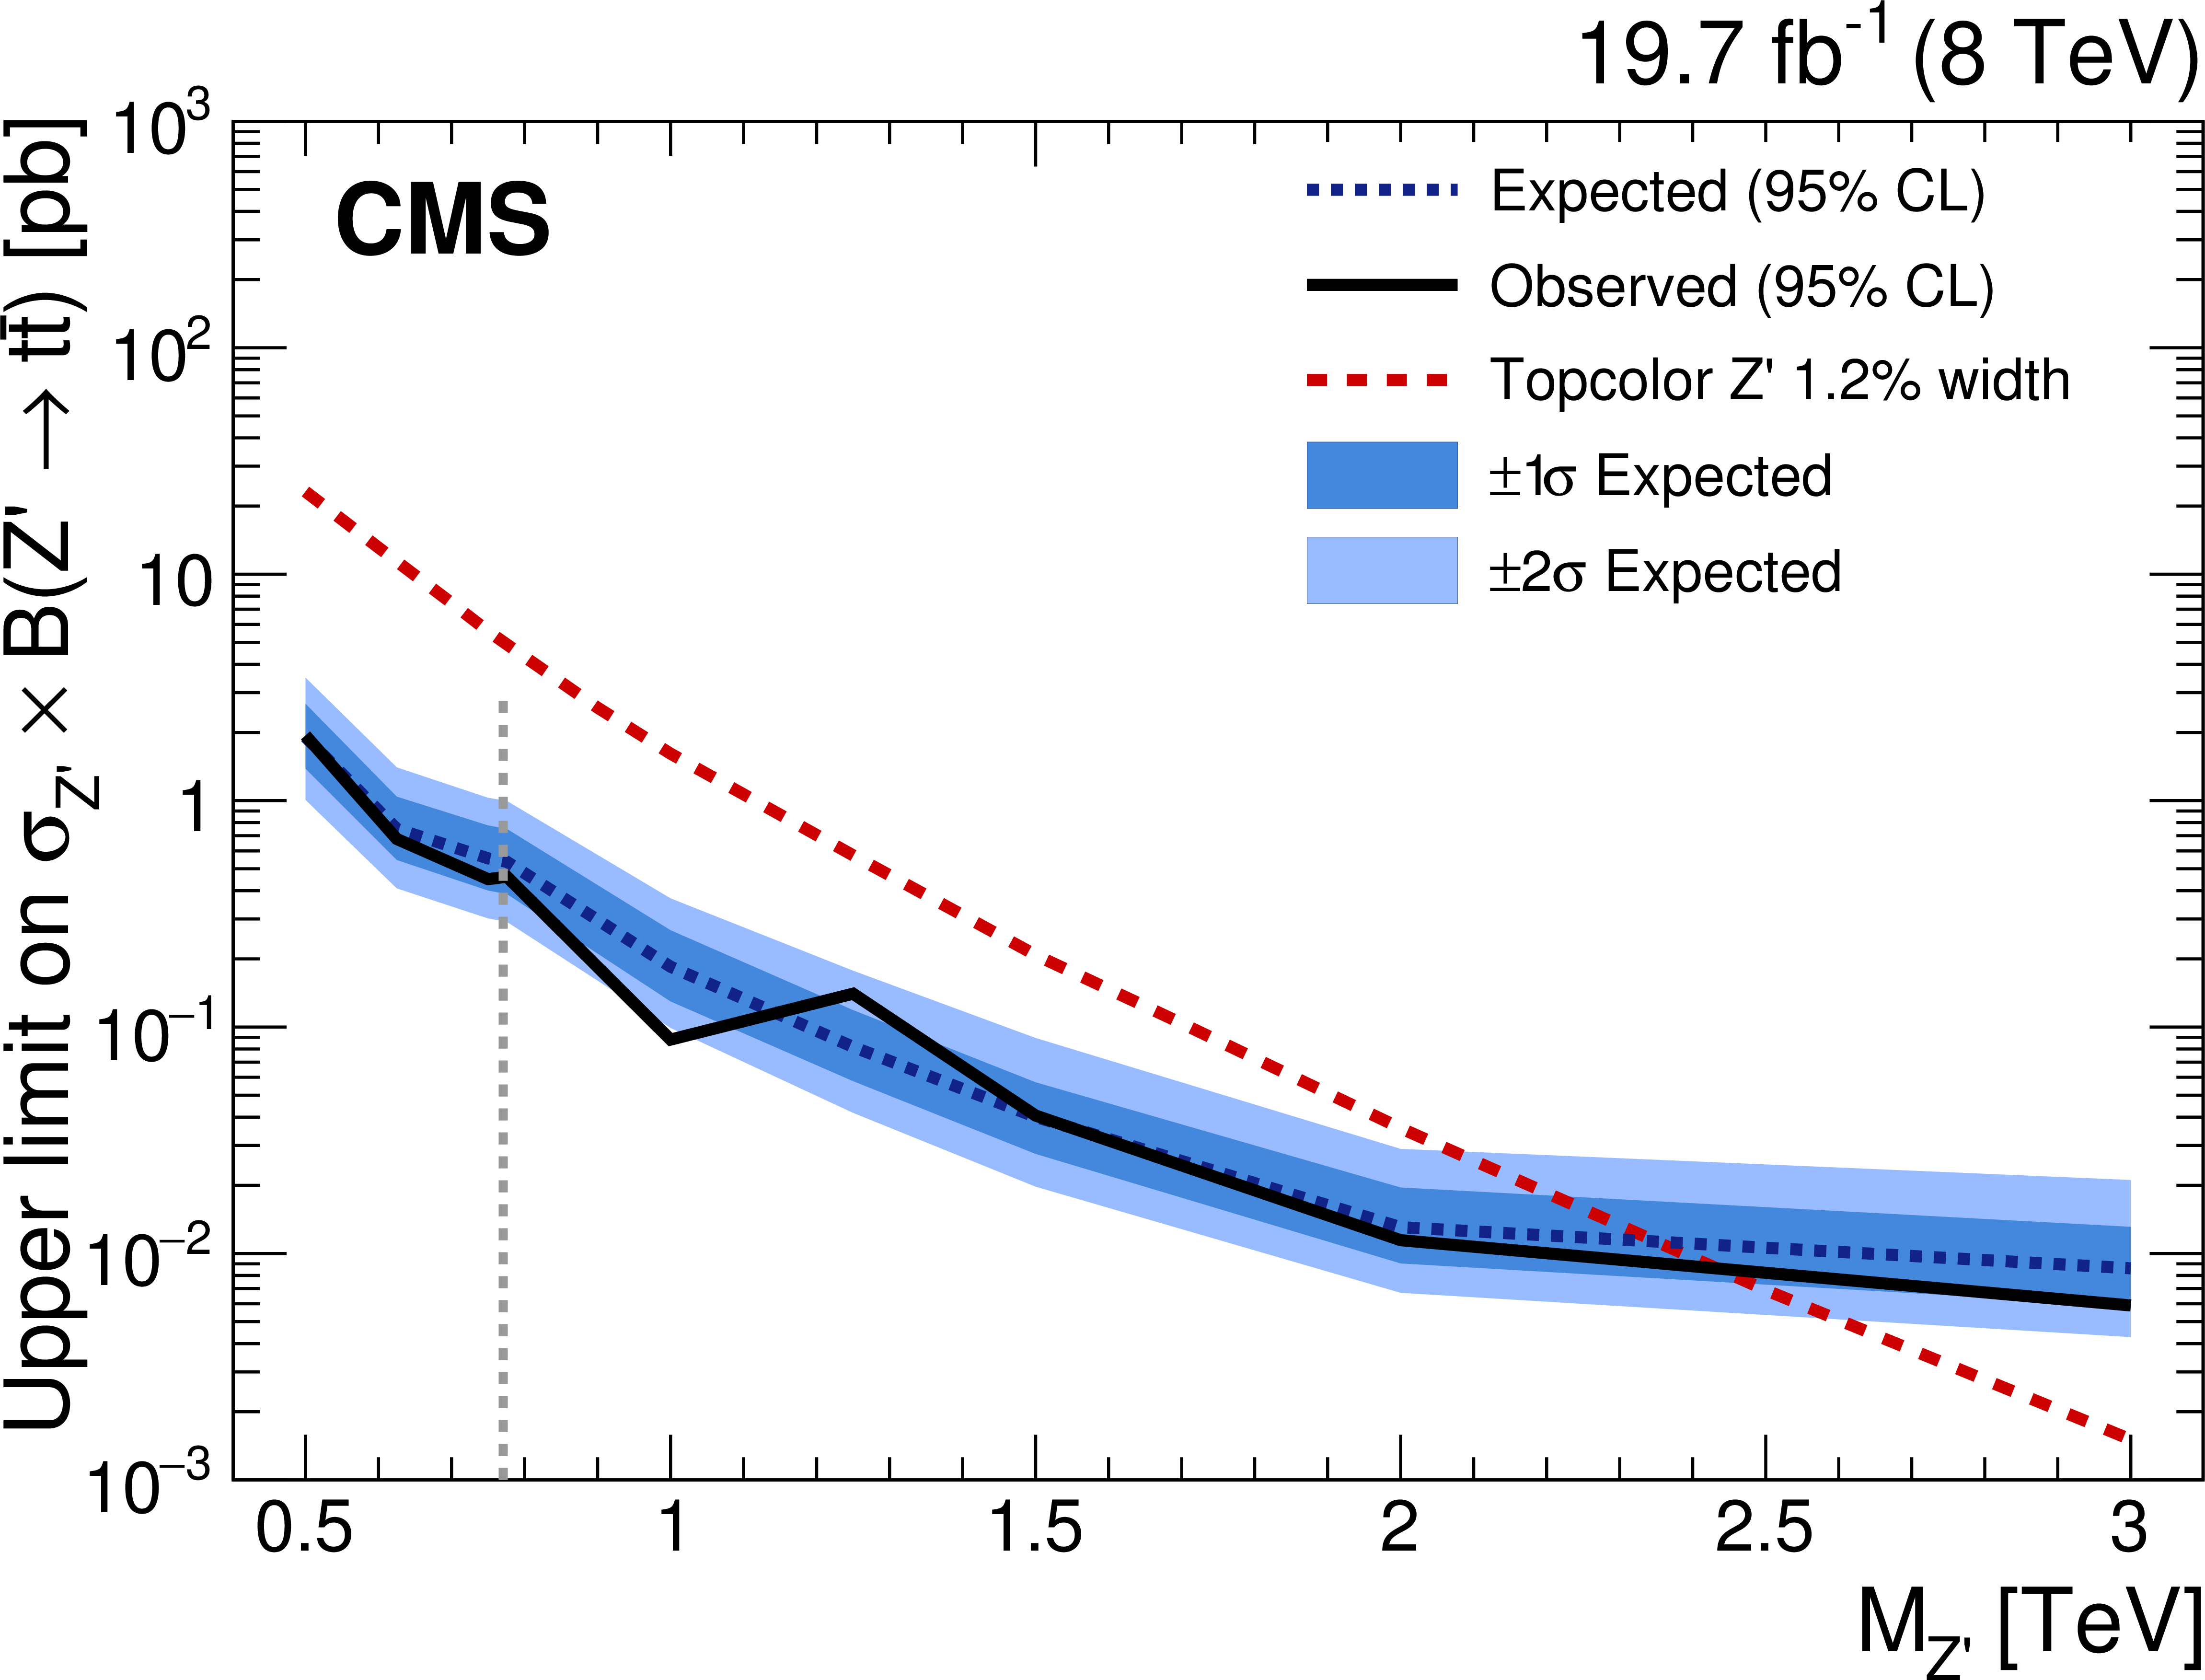
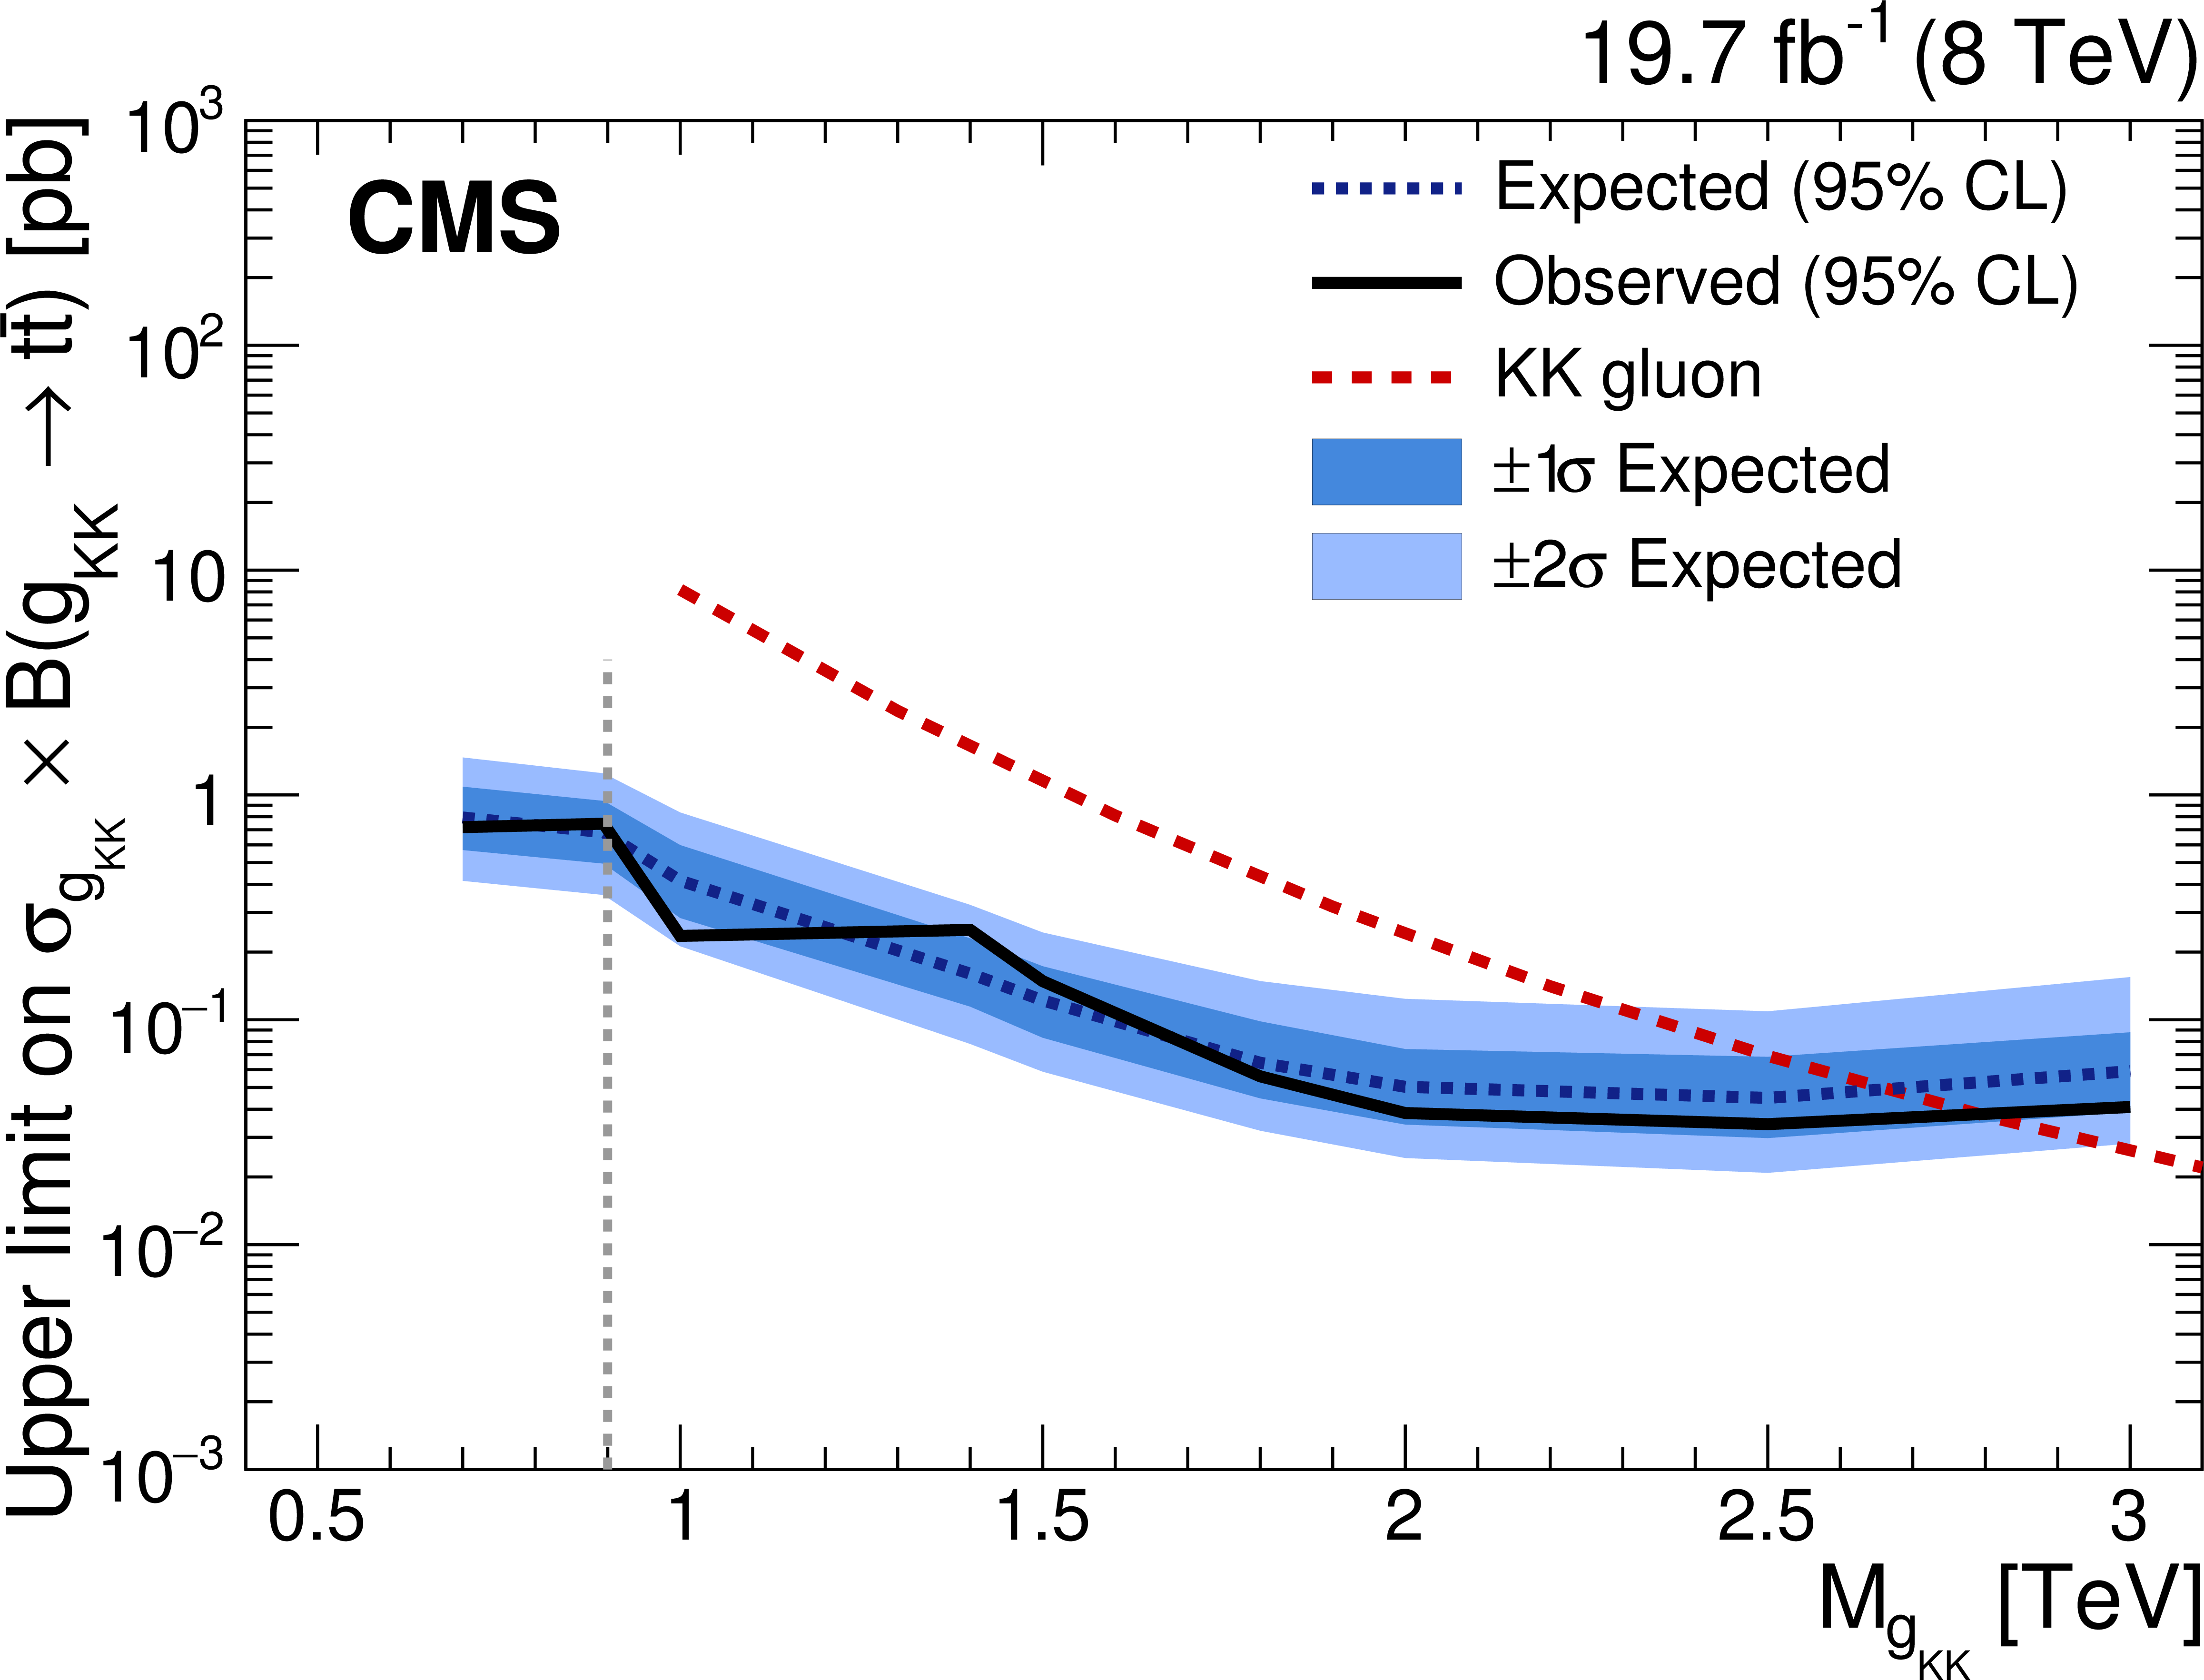
Figure 14-a:
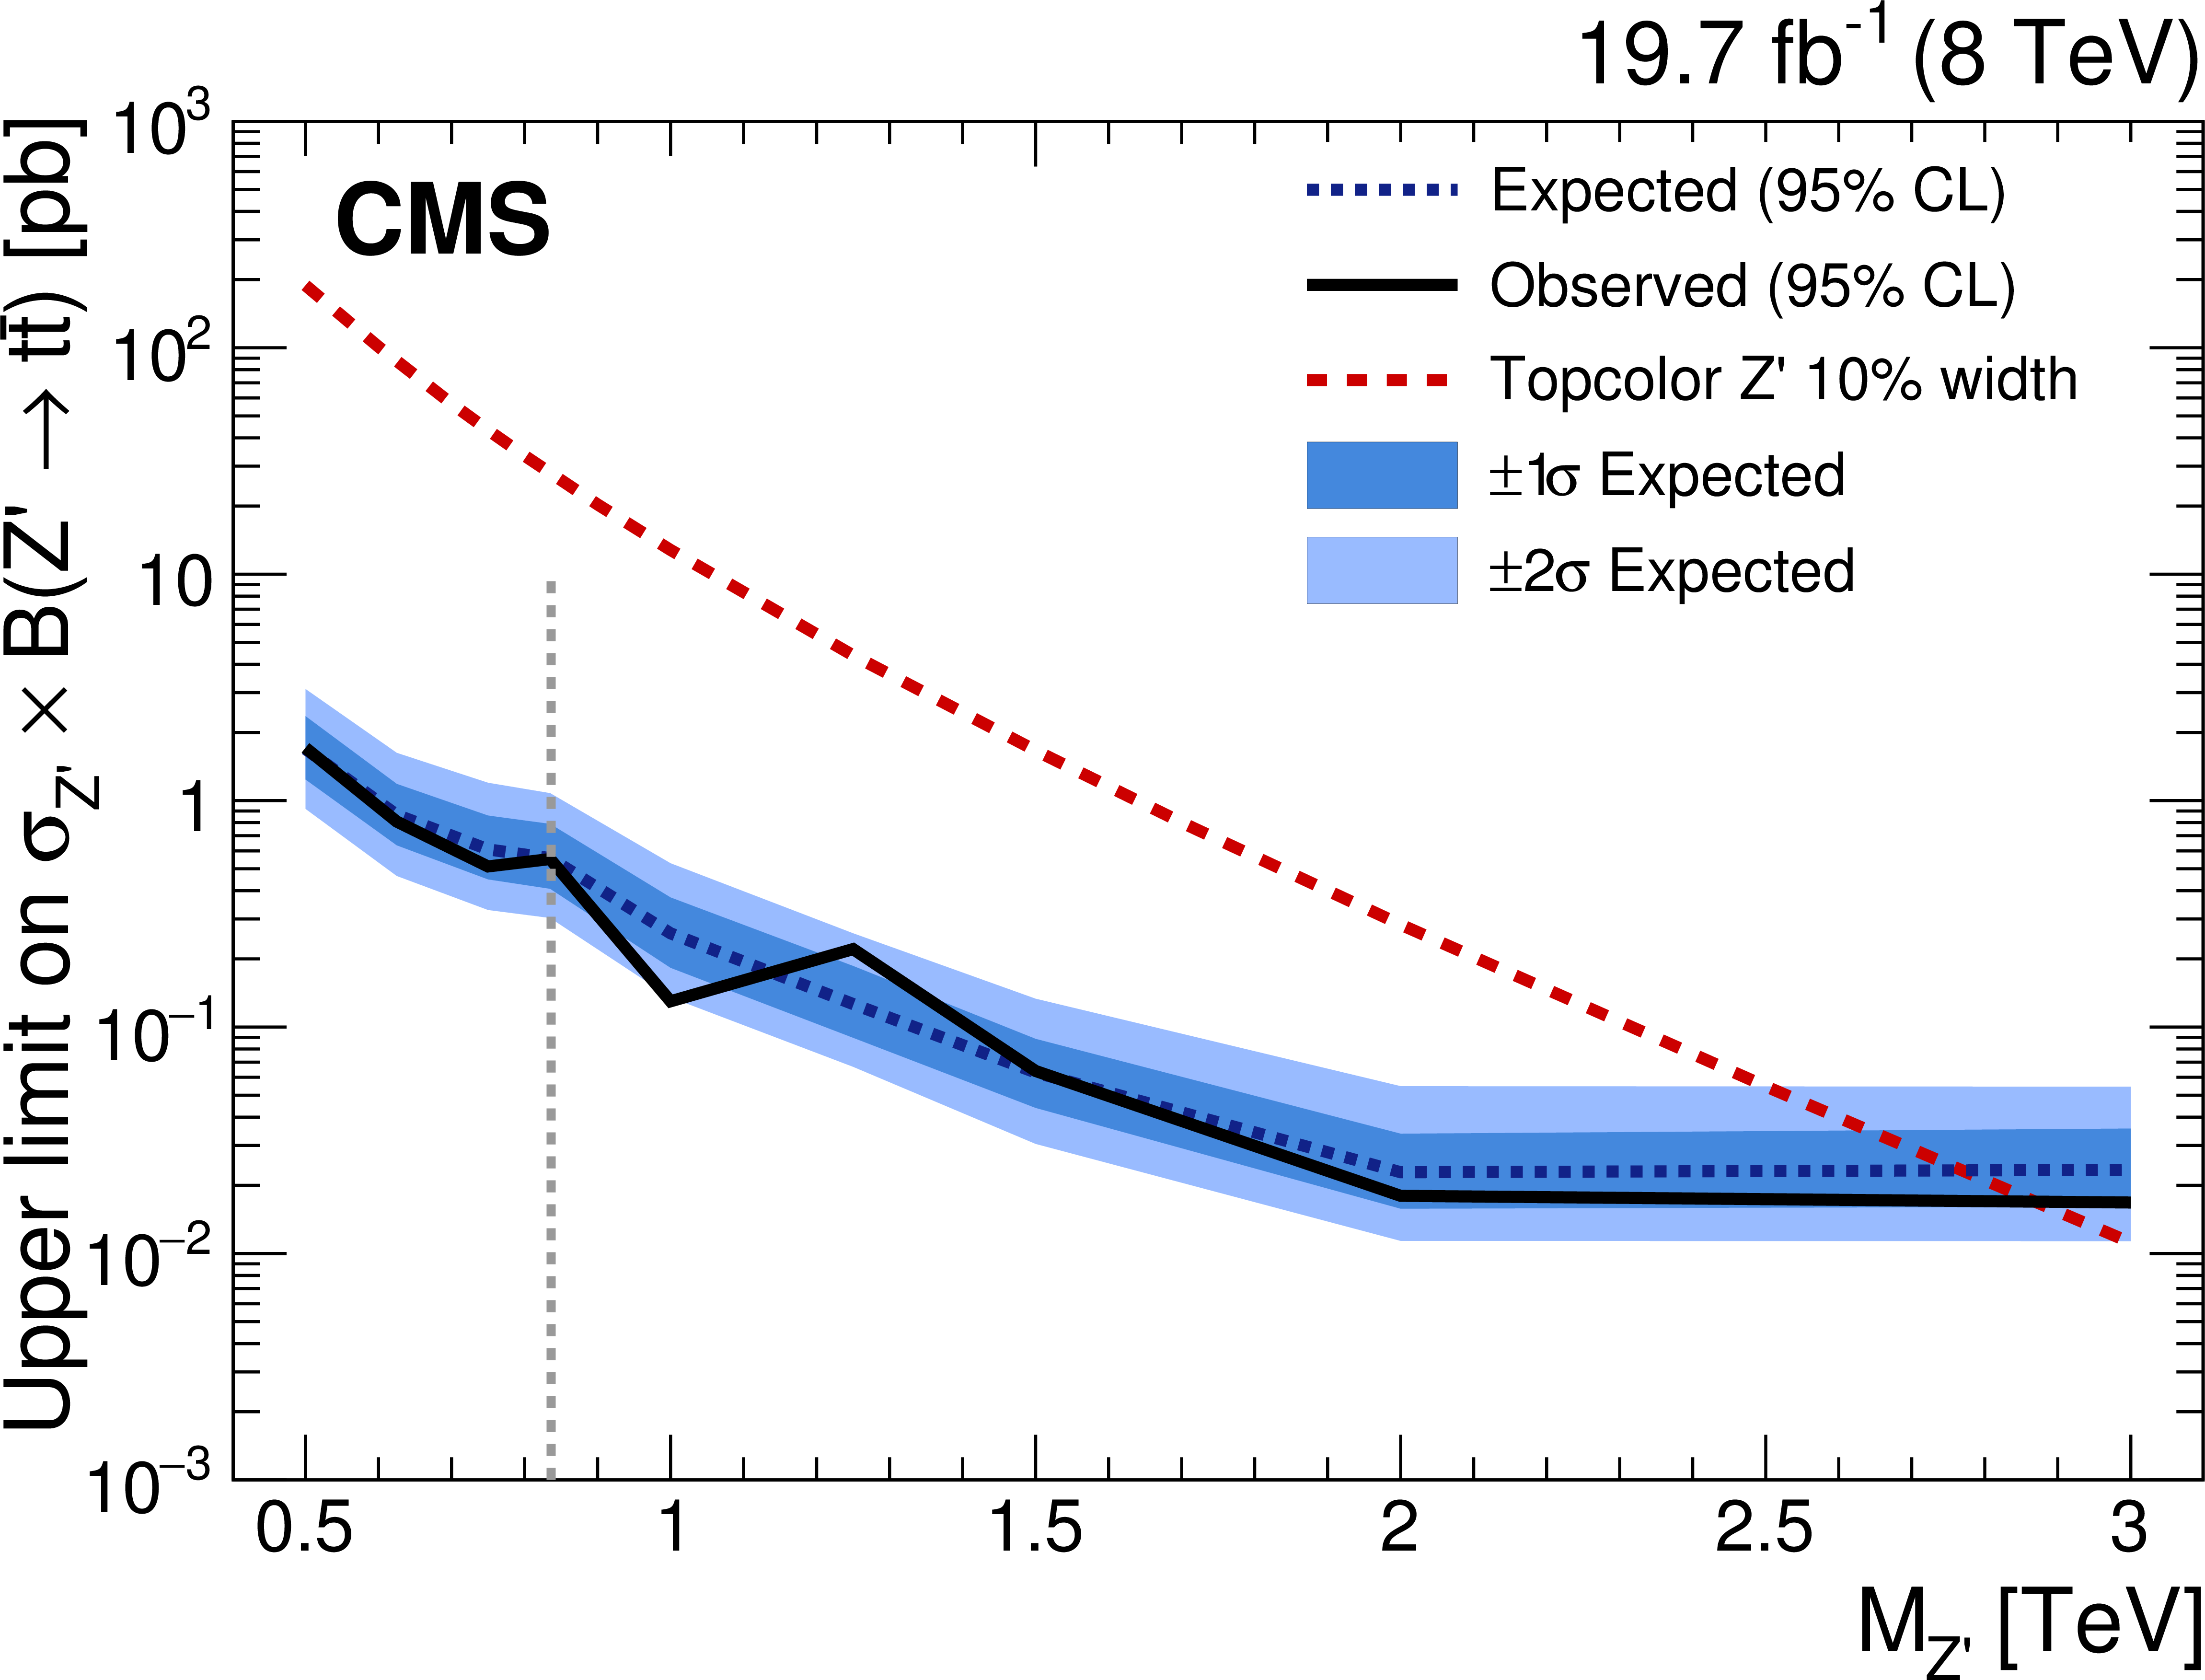
Upper limits at 95% CL on the production cross section times branching fraction for a Z' boson decaying to $ {\mathrm {t}\overline {\mathrm {t}}} $ with narrow width (a), with 10% width (b) and a KK gluon in the Randall--Sundrum model decaying to $ {\mathrm {t}\overline {\mathrm {t}}} $ (c). The vertical dashed line indicates the transition from a threshold analysis [31: CMS, PRL 111 (2013) 211804] to the combination, in providing the best expected limit. Below this dashed line, only the results of the low-mass analysis with resolved jets are quoted; above this line, the results from the combination of the boosted channels are given. The limits are shown as a function of the resonance mass and are compared to predictions for the cross section of a Z' boson with relative width of 1.2% and 10% [10: Harris and Jain, EPJC 72 (2012) 2072] and the prediction for the production of a KK gluon [18: Agashe et al., PRD 77 (2008) 015003]. The predictions are multiplied by a factor of 1.3 to account for higher-order corrections [68: Gao et al, PRD 82 (2010) 014020]. |
png pdf |
Figure 14-b:
Upper limits at 95% CL on the production cross section times branching fraction for a Z' boson decaying to $ {\mathrm {t}\overline {\mathrm {t}}} $ with narrow width (a), with 10% width (b) and a KK gluon in the Randall--Sundrum model decaying to $ {\mathrm {t}\overline {\mathrm {t}}} $ (c). The vertical dashed line indicates the transition from a threshold analysis [31: CMS, PRL 111 (2013) 211804] to the combination, in providing the best expected limit. Below this dashed line, only the results of the low-mass analysis with resolved jets are quoted; above this line, the results from the combination of the boosted channels are given. The limits are shown as a function of the resonance mass and are compared to predictions for the cross section of a Z' boson with relative width of 1.2% and 10% [10: Harris and Jain, EPJC 72 (2012) 2072] and the prediction for the production of a KK gluon [18: Agashe et al., PRD 77 (2008) 015003]. The predictions are multiplied by a factor of 1.3 to account for higher-order corrections [68: Gao et al, PRD 82 (2010) 014020]. |
png pdf |
Figure 14-c:
Upper limits at 95% CL on the production cross section times branching fraction for a Z' boson decaying to $ {\mathrm {t}\overline {\mathrm {t}}} $ with narrow width (a), with 10% width (b) and a KK gluon in the Randall--Sundrum model decaying to $ {\mathrm {t}\overline {\mathrm {t}}} $ (c). The vertical dashed line indicates the transition from a threshold analysis [31: CMS, PRL 111 (2013) 211804] to the combination, in providing the best expected limit. Below this dashed line, only the results of the low-mass analysis with resolved jets are quoted; above this line, the results from the combination of the boosted channels are given. The limits are shown as a function of the resonance mass and are compared to predictions for the cross section of a Z' boson with relative width of 1.2% and 10% [10: Harris and Jain, EPJC 72 (2012) 2072] and the prediction for the production of a KK gluon [18: Agashe et al., PRD 77 (2008) 015003]. The predictions are multiplied by a factor of 1.3 to account for higher-order corrections [68: Gao et al, PRD 82 (2010) 014020]. |
| Tables | |
png pdf |
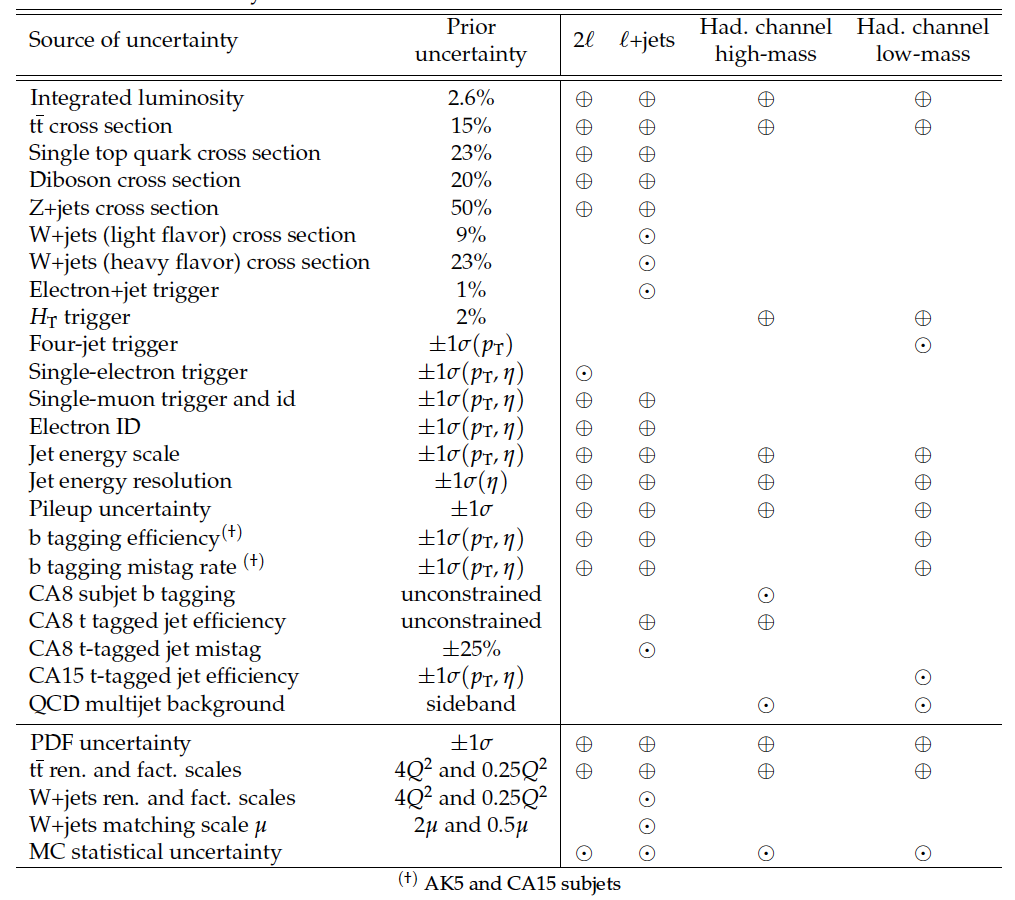
Table 1:
Sources of systematic uncertainties and the channels they affect. The CA8 subjet b tagging uncertainty includes the uncertainties in both the efficiency and mistag rate. Uncorrelated uncertainties that apply to a given channel are marked by $\odot$. Uncertainties correlated between channels are marked by $\oplus$. |
png pdf |
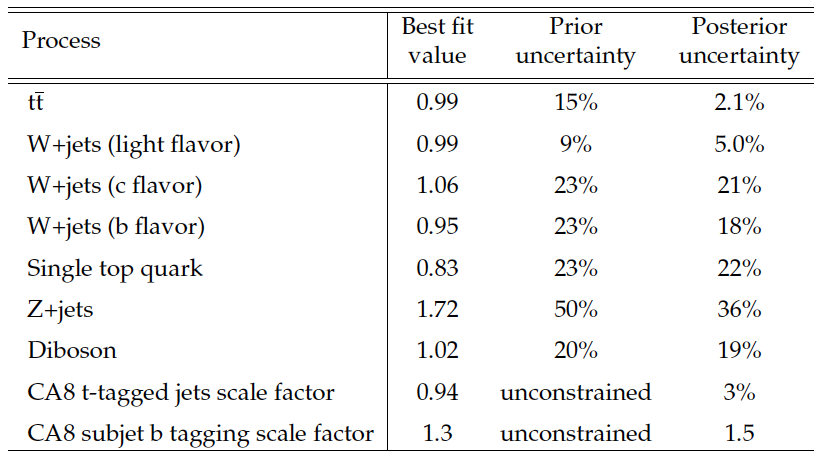
Table 2:
Parameters for the background normalization of the given processes, the scale factor for CA8 t-tagged jets and the subjet b tagging scale factor. The value of each parameter is obtained from a maximum likelihood fit. Also shown are the prior assumptions on the rate uncertainties and the posterior uncertainties obtained by the fit. In case of the subjet b tagging scale factor, the best fit value and the posterior uncertainty are given in units of the standard b tagging scale factor and uncertainty. |
png pdf |
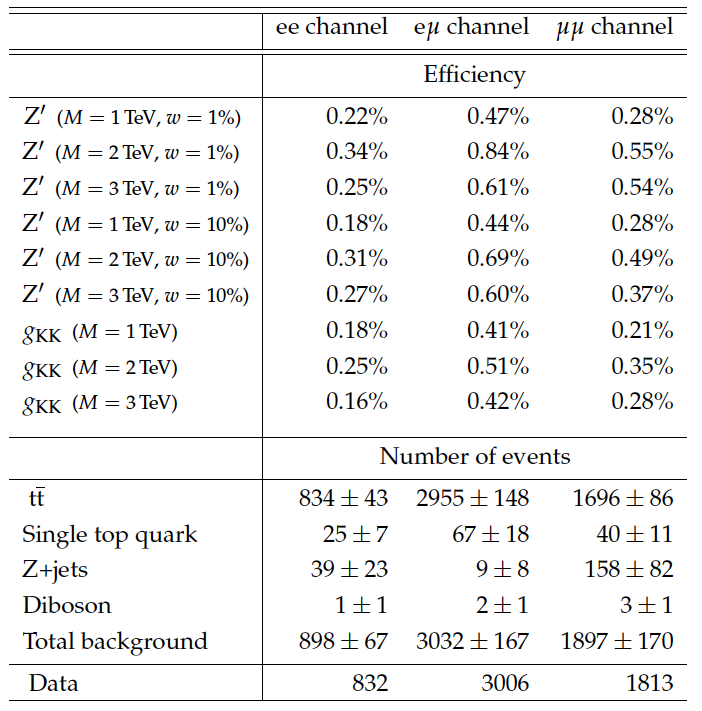
Table 3:
Signal efficiency and number of events in the $\mathrm{ee}$, $\mathrm{e}\mu$, and $\mu\mu$ channels. The yield of each MC background is obtained from NLO+NNLL calculations, multiplied by a scale factor derived from the likelihood fit. The uncertainty given for each background process includes the MC statistical uncertainty added in quadrature with all systematic uncertainties. The resonance relative decay width $\Gamma_{\mathrm{Z}^{\prime}}/M_{\mathrm{Z}^{\prime}} $ is indicated by $w$. |
png pdf |
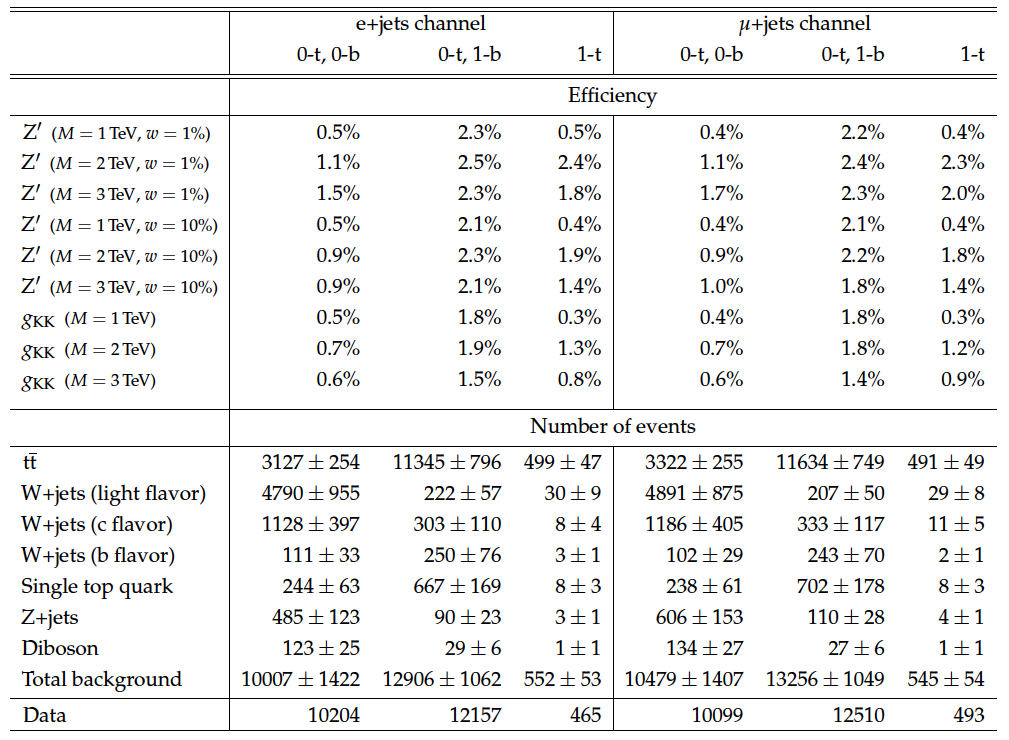
Table 4:
Signal efficiency and number of events in the e+jets and $\mu$+jets channels. The yield of each MC background is obtained from NLO+NNLL calculations, multiplied by a scale factor derived from the likelihood fit. The uncertainty given for each background process includes the MC statistical uncertainty added in quadrature with all systematic uncertainties. The resonance relative decay width $\Gamma_{\mathrm{Z}^{\prime}}/M_{\mathrm{Z}^{\prime}} $ is indicated by $w$. |
png pdf |
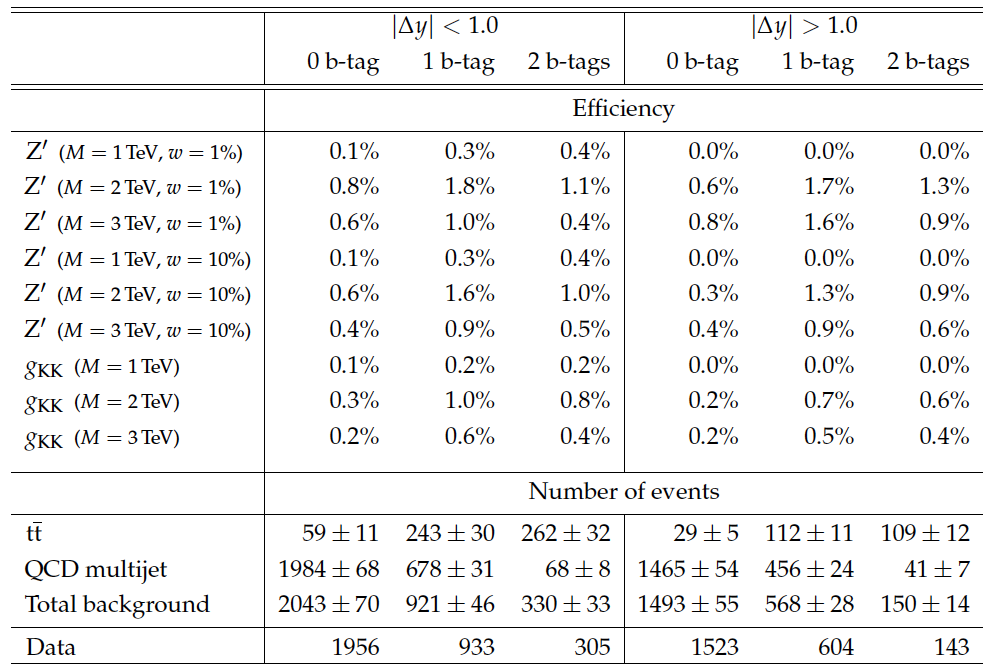
Table 5:
Signal efficiency and number of events in the high-mass all-hadronic channel. The yield of the $ \mathrm{ t \bar{t} } $ background is obtained from NLO+NNLL calculations, multiplied by a scale factor derived from the likelihood fit. The multijet background is obtained from sideband regions in data. The uncertainty given for each background process includes the statistical uncertainty added in quadrature with all systematic uncertainties. The resonance relative decay width $\Gamma_{\mathrm{Z}^{\prime}}/M_{\mathrm{Z}^{\prime}} $ is indicated by $w$. |
png pdf |
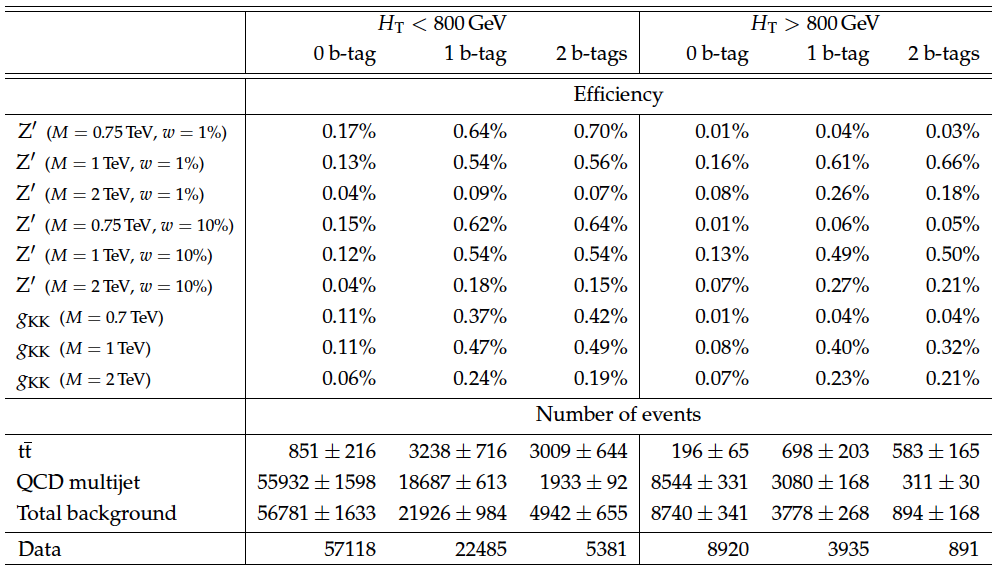
Table 6:
Signal efficiency and number of events in the low-mass all-hadronic channel. The yield of the $ \mathrm{ t \bar{t} } $ background is obtained from NLO+NNLL calculations, multiplied by a scale factor derived from the likelihood fit. The multijet background is obtained from sideband regions in data. The uncertainty given for each background process includes the statistical uncertainty added in quadrature with all systematic uncertainties. The resonance relative decay width $\Gamma_{\mathrm{Z}^{\prime}}/M_{\mathrm{Z}^{\prime}} $ is indicated by $w$. |
png pdf |
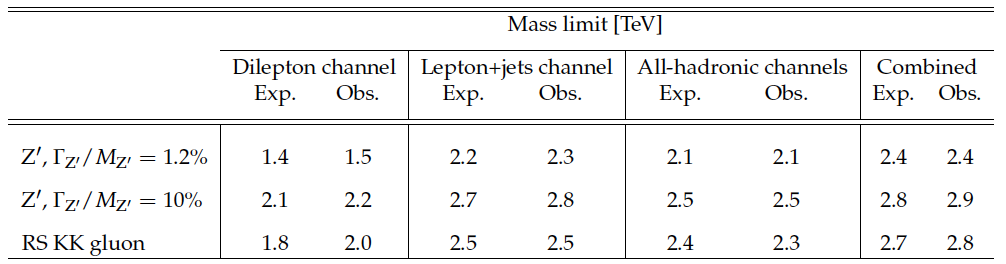
Table 7:
Expected and observed lower mass limits for the three benchmark models. Mass limits are given for the dilepton analysis, the lepton+jets analysis, the combination of the two all-hadronic analyses and the full combination of all four analyses. All limits are given at 95% CL. |
png pdf |
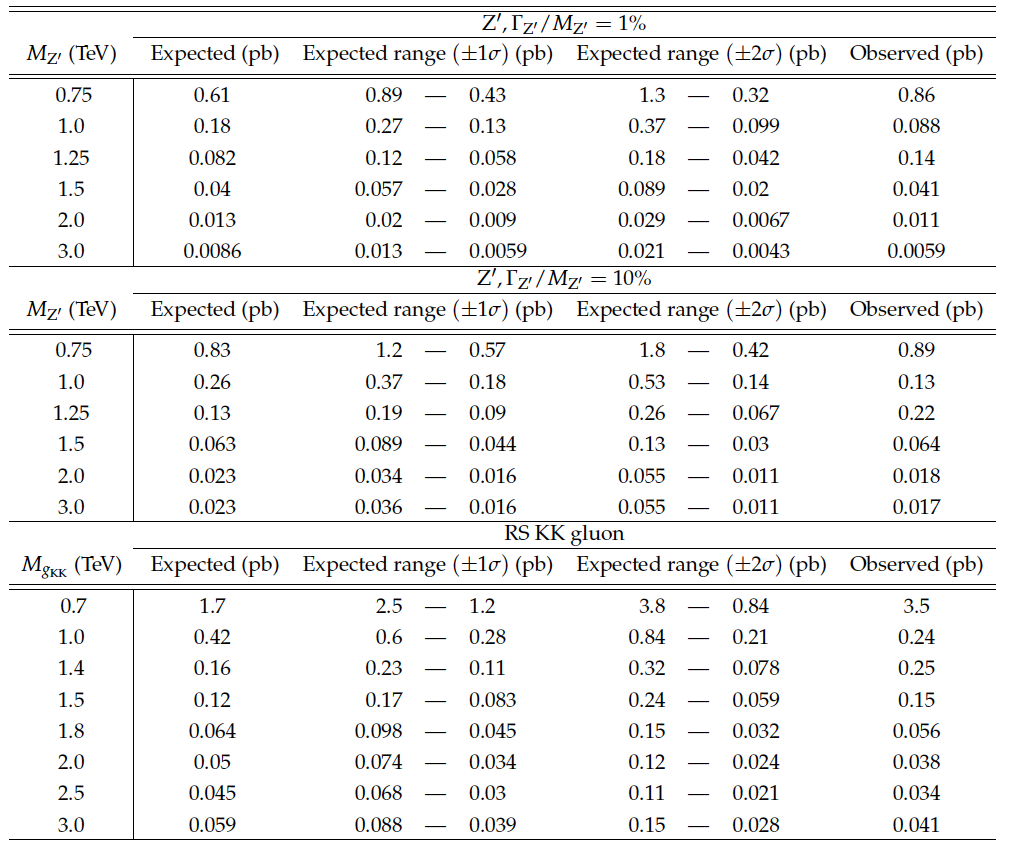
Table 8:
Expected and observed limits for the production cross section times branching fraction of a Z' boson decaying to $ \mathrm{ t \bar{t} } $ with a width of 1%, 10% and a KK gluon in the RS model. All limits are given at 95% CL. |
| Summary |
|
A search has been performed for the production of heavy $ \mathrm{ t \bar{t} } $ resonances in final states including two, one, or no leptons. The analysis is based on a data sample corresponding to an integrated luminosity of 19.7 fb$^{-1}$ recorded in 2012 with the CMS detector in proton-proton collisions at $\sqrt{s} = $ 8 TeV at the LHC. No evidence is found for a resonant $ \mathrm{ t \bar{t} } $ component beyond the standard model $ \mathrm{ t \bar{t} } $ continuum production. Model-independent cross section limits are set on the production of such resonances that have widths well below the experimental resolution of about 10%. Cross sections times branching fractions above 11 fb are excluded at 95% confidence level (CL) for the process pp $\to$ Z' $\to \mathrm{ t \bar{t} } $ with a Z' resonance with mass of 2 TeV and width $\Gamma_{\mathrm{Z}^{\prime}}/M_{\mathrm{Z}^{\prime}} =$ 1%. The corresponding 95% CL expected cross section limit is 13 fb. The 95% CL observed lower mass limit for a topcolor narrow Z' resonance with $\Gamma_{\mathrm{Z}^{\prime}}/M_{\mathrm{Z}^{\prime}} =$ 1.2% corresponds to 2.4 TeV, which agrees with the expected limit. Observed and expected 95% CL upper limits of 18 fb (23 fb) are set for a Z' boson with a mass of 2 TeV and width $\Gamma_{\mathrm{Z}^{\prime}}/M_{\mathrm{Z}^{\prime}} =$ 10%. The respective 95% CL observed and expected lower mass limits are 2.9 and 2.8 TeV for a wide topcolor Z' resonance. For the production of Kaluza-Klein gluon excitations pp $\to g_{\mathrm{KK}} \to \mathrm{ t \bar{t} } $ predicted in Randall-Sundrum models [18], an upper limit on the cross section of 38 fb is observed (50 fb expected) at 95% CL for a mass of 2 TeV. The observed and expected lower mass limits are 2.8 and 2.7 TeV. These mass limits represent significant improvements over previous ones set at $\sqrt{s} =$ 7 TeV. An improvement by about 50% on the 95% CL upper limits with respect to an earlier search optimized for high masses at $\sqrt{s} =$ 8 TeV is achieved by the application of additional jet substructure information and the addition of the dilepton channel. The results presented provide the most stringent constraints on resonant $ \mathrm{ t \bar{t} } $ production to date. |
|
|
Compact Muon Solenoid LHC, CERN |
|

|

|

|

|

|