

Compact Muon Solenoid
LHC, CERN
| CMS-EXO-15-001 ; CERN-PH-EP-2015-317 | ||
| Search for narrow resonances decaying to dijets in proton-proton collisions at $\sqrt{s}= $ 13 TeV | ||
| CMS Collaboration | ||
| 3 December 2015 | ||
| Phys. Rev. Lett. 116 (2016) 071801 | ||
| Abstract: A search for narrow resonances in proton-proton collisions at $\sqrt{s} =$ 13 TeV is presented. The invariant mass distribution of the two leading jets is measured with the CMS detector using a data set corresponding to an integrated luminosity of 2.4 fb$^{-1}$. The highest observed dijet mass is 6.1 TeV. The distribution is smooth and no evidence for resonant particles is observed. Upper limits at 95% confidence level are set on the production cross section for narrow resonances with masses above 1.5 TeV. When interpreted in the context of specific models, the limits exclude string resonances with masses below 7.0 TeV, scalar diquarks below 6.0 TeV, axigluons and colorons below 5.1 TeV, excited quarks below 5.0 TeV, color-octet scalars below 3.1 TeV, and W' bosons below 2.6 TeV. These results significantly extend previously published limits. | ||
| Links: e-print arXiv:1512.01224 [hep-ex] (PDF) ; CDS record ; inSPIRE record ; CADI line (restricted) ; | ||
| Figures | |

png pdf |
Figure 1:
Dijet mass spectrum (points) compared to a fitted parameterization (solid curve) and to the prediction of the PYTHIA8 [33] QCD MC event generator including simulation of the detector (dashed curve). The lower panel shows the difference between the data and the fitted parametrization, divided by the statistical uncertainties. The predicted distributions of narrow resonance signals for three models, with resonance mass values corresponding to the respective 95% confidence level exclusion limit, are shown in both panels (dash-dotted curves). |
png pdf |
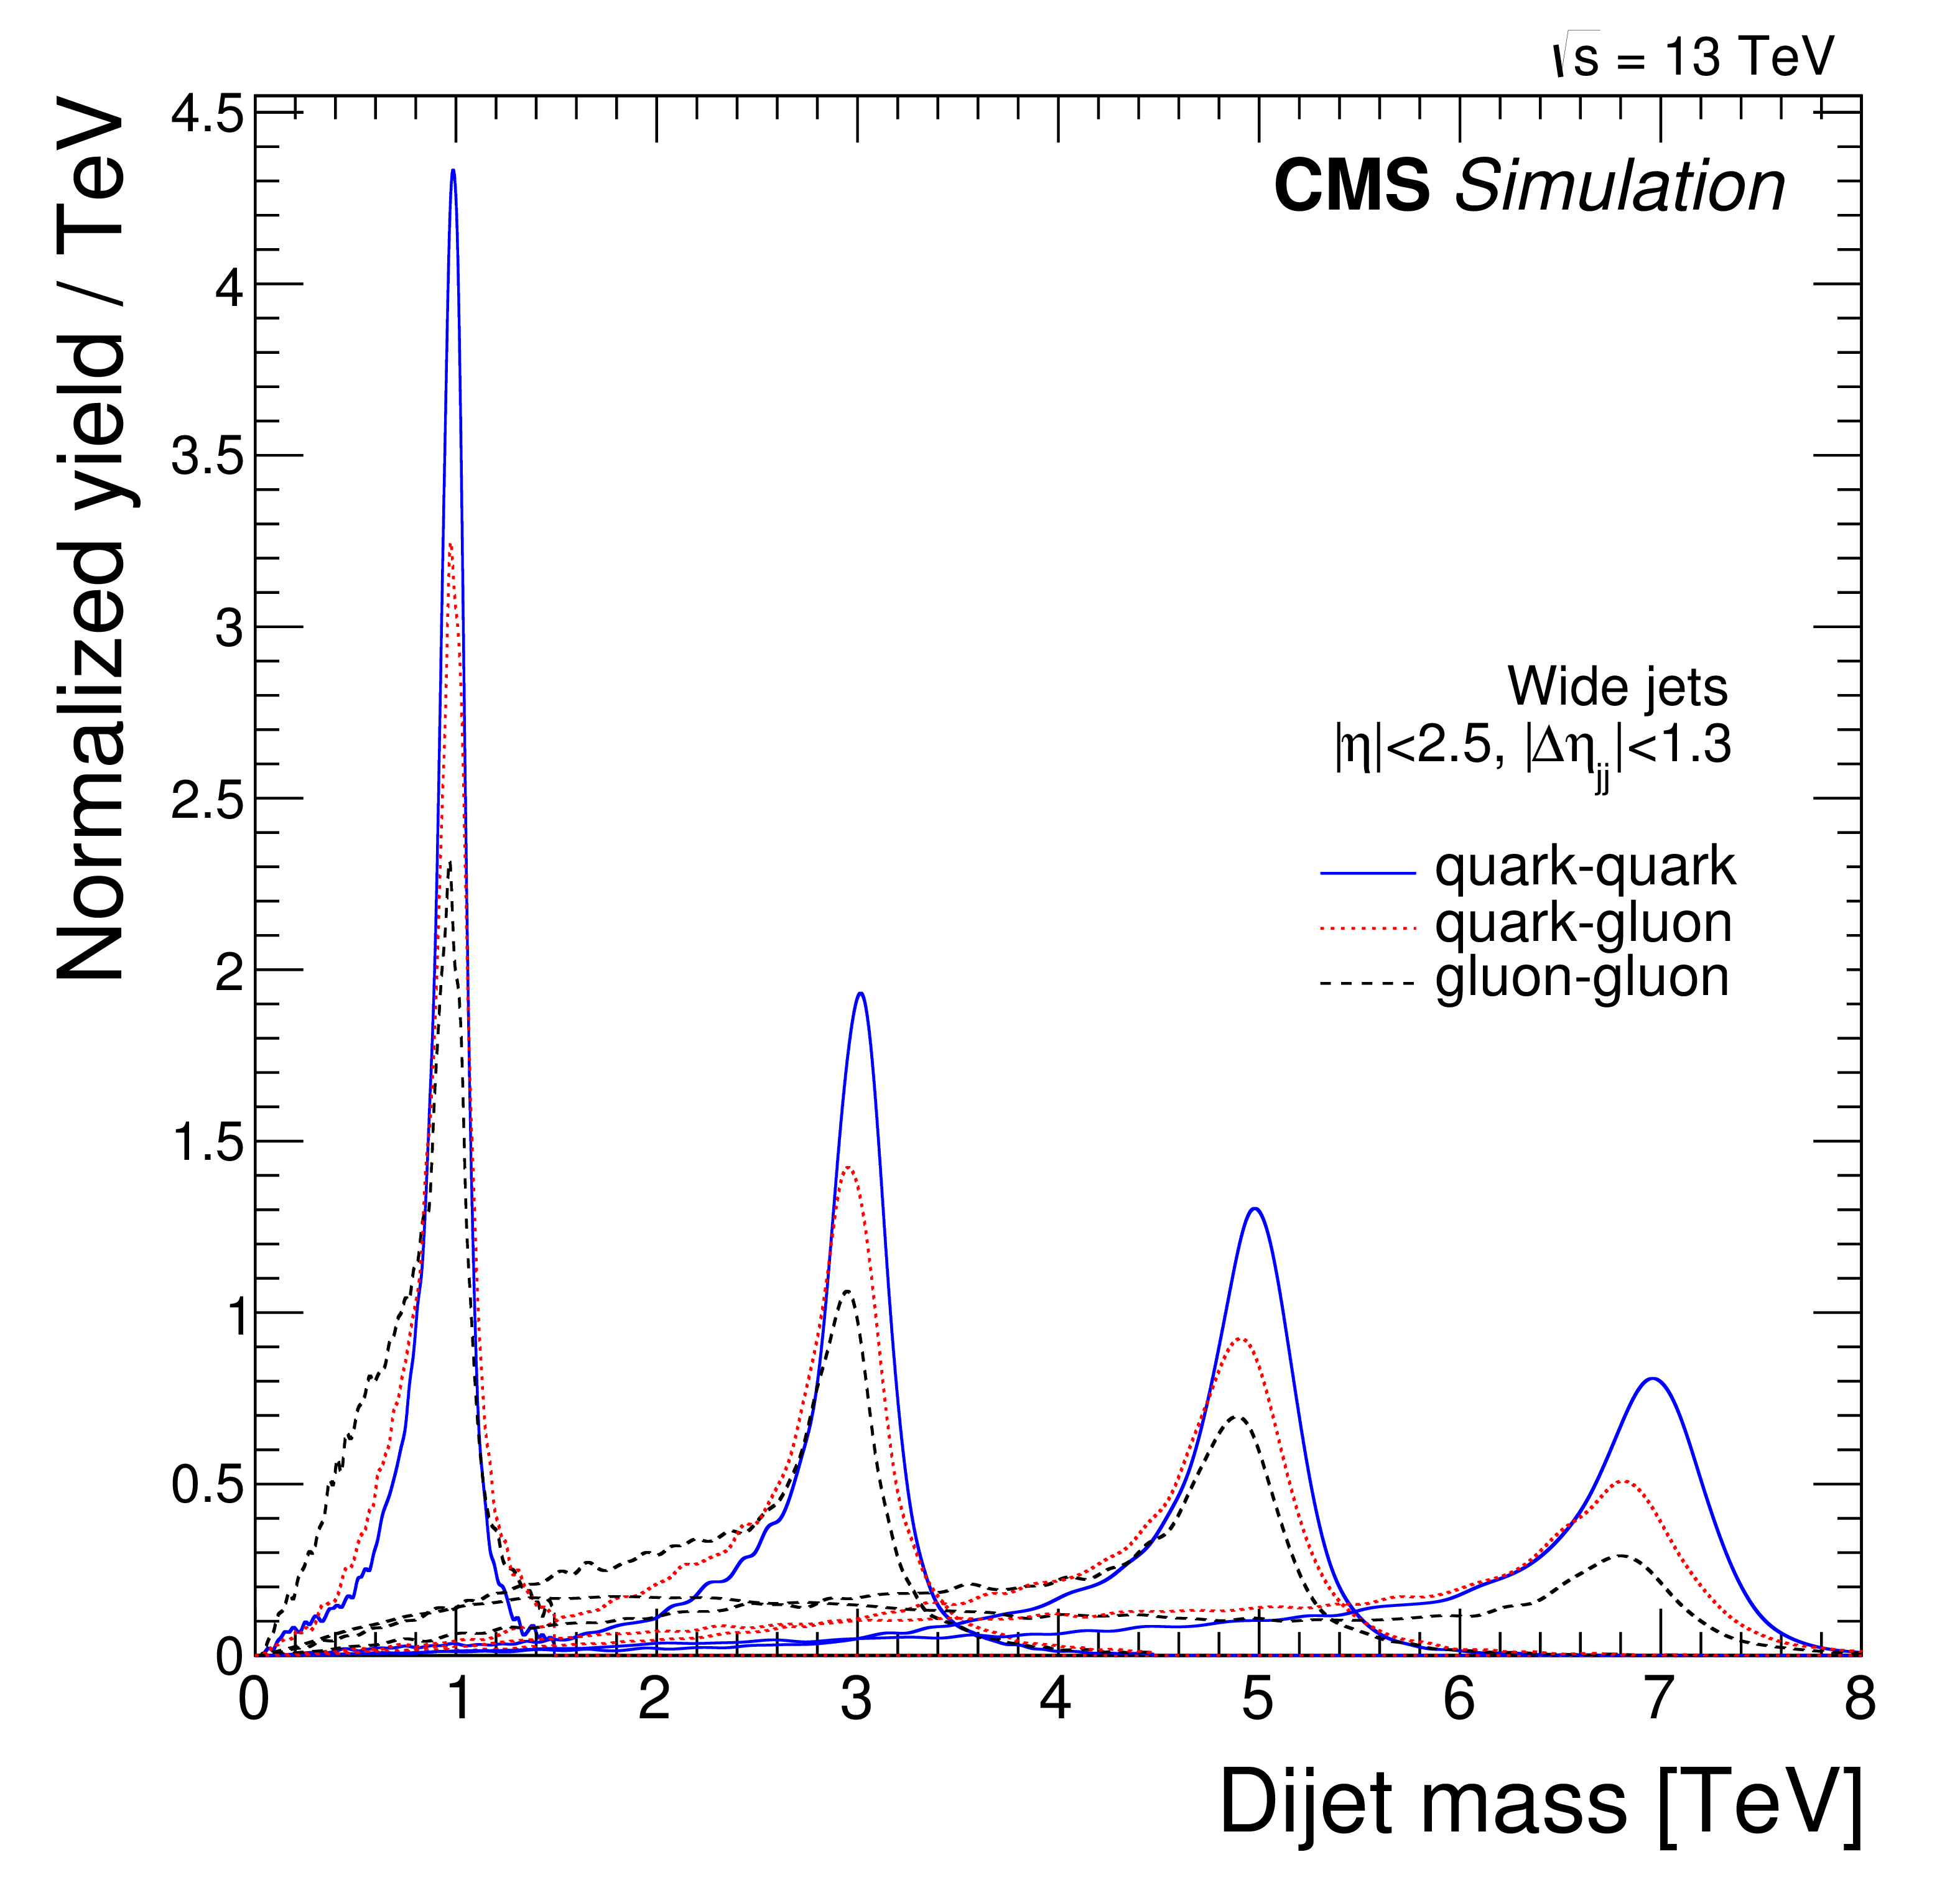
Figure 2:
The reconstructed resonance mass spectrum predicted by the PYTHIA8 [33] MC event generator, including simulation of the detector, for resonances generated with mass values 1, 3, 5, and 7 TeV, for quark-quark processes modeled by $ \mathrm{ q \bar{q} \to G \to q \bar{q} } $ (solid), for quark-gluon processes modeled by $\mathrm{ q g \to q^* \to q g } $ (dotted), and for gluon-gluon processes modeled by $ \mathrm{ g g \to G \to g g } $ (dashed), where $\mathrm{G} $ is a RS graviton and $\mathrm{ q^* } $ is an excited quark. |
png pdf |
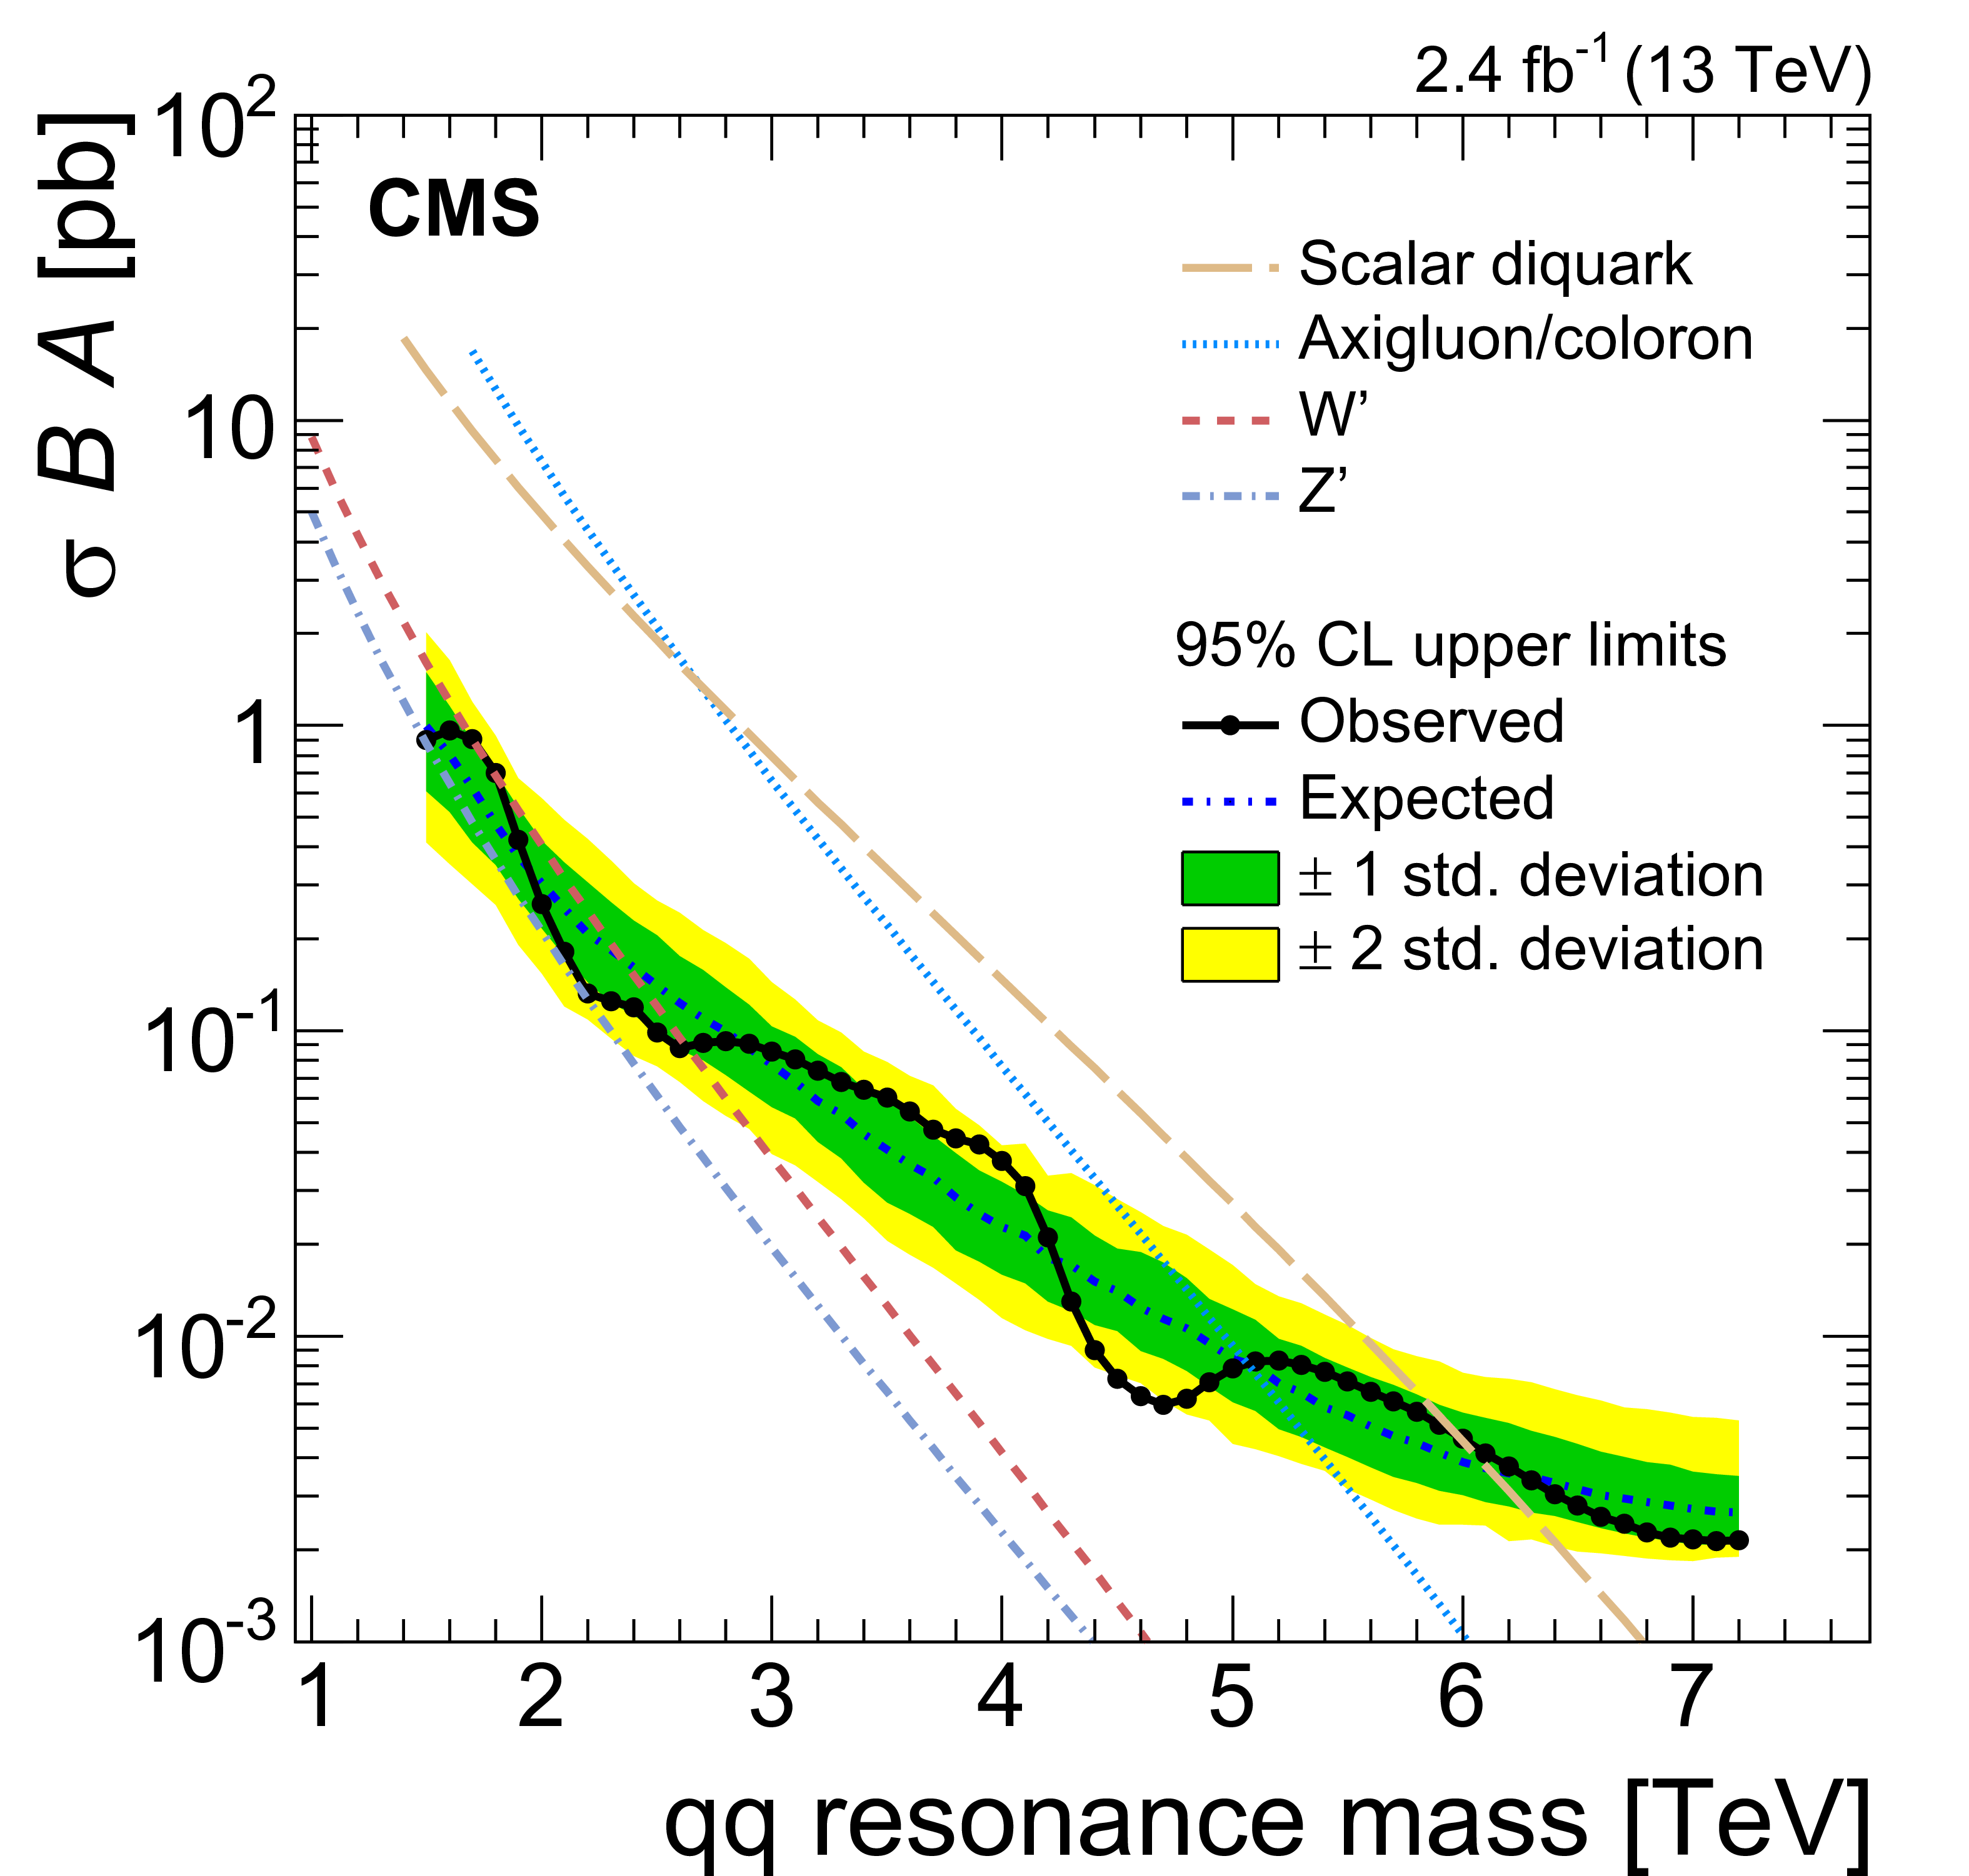
Figure 3-a:
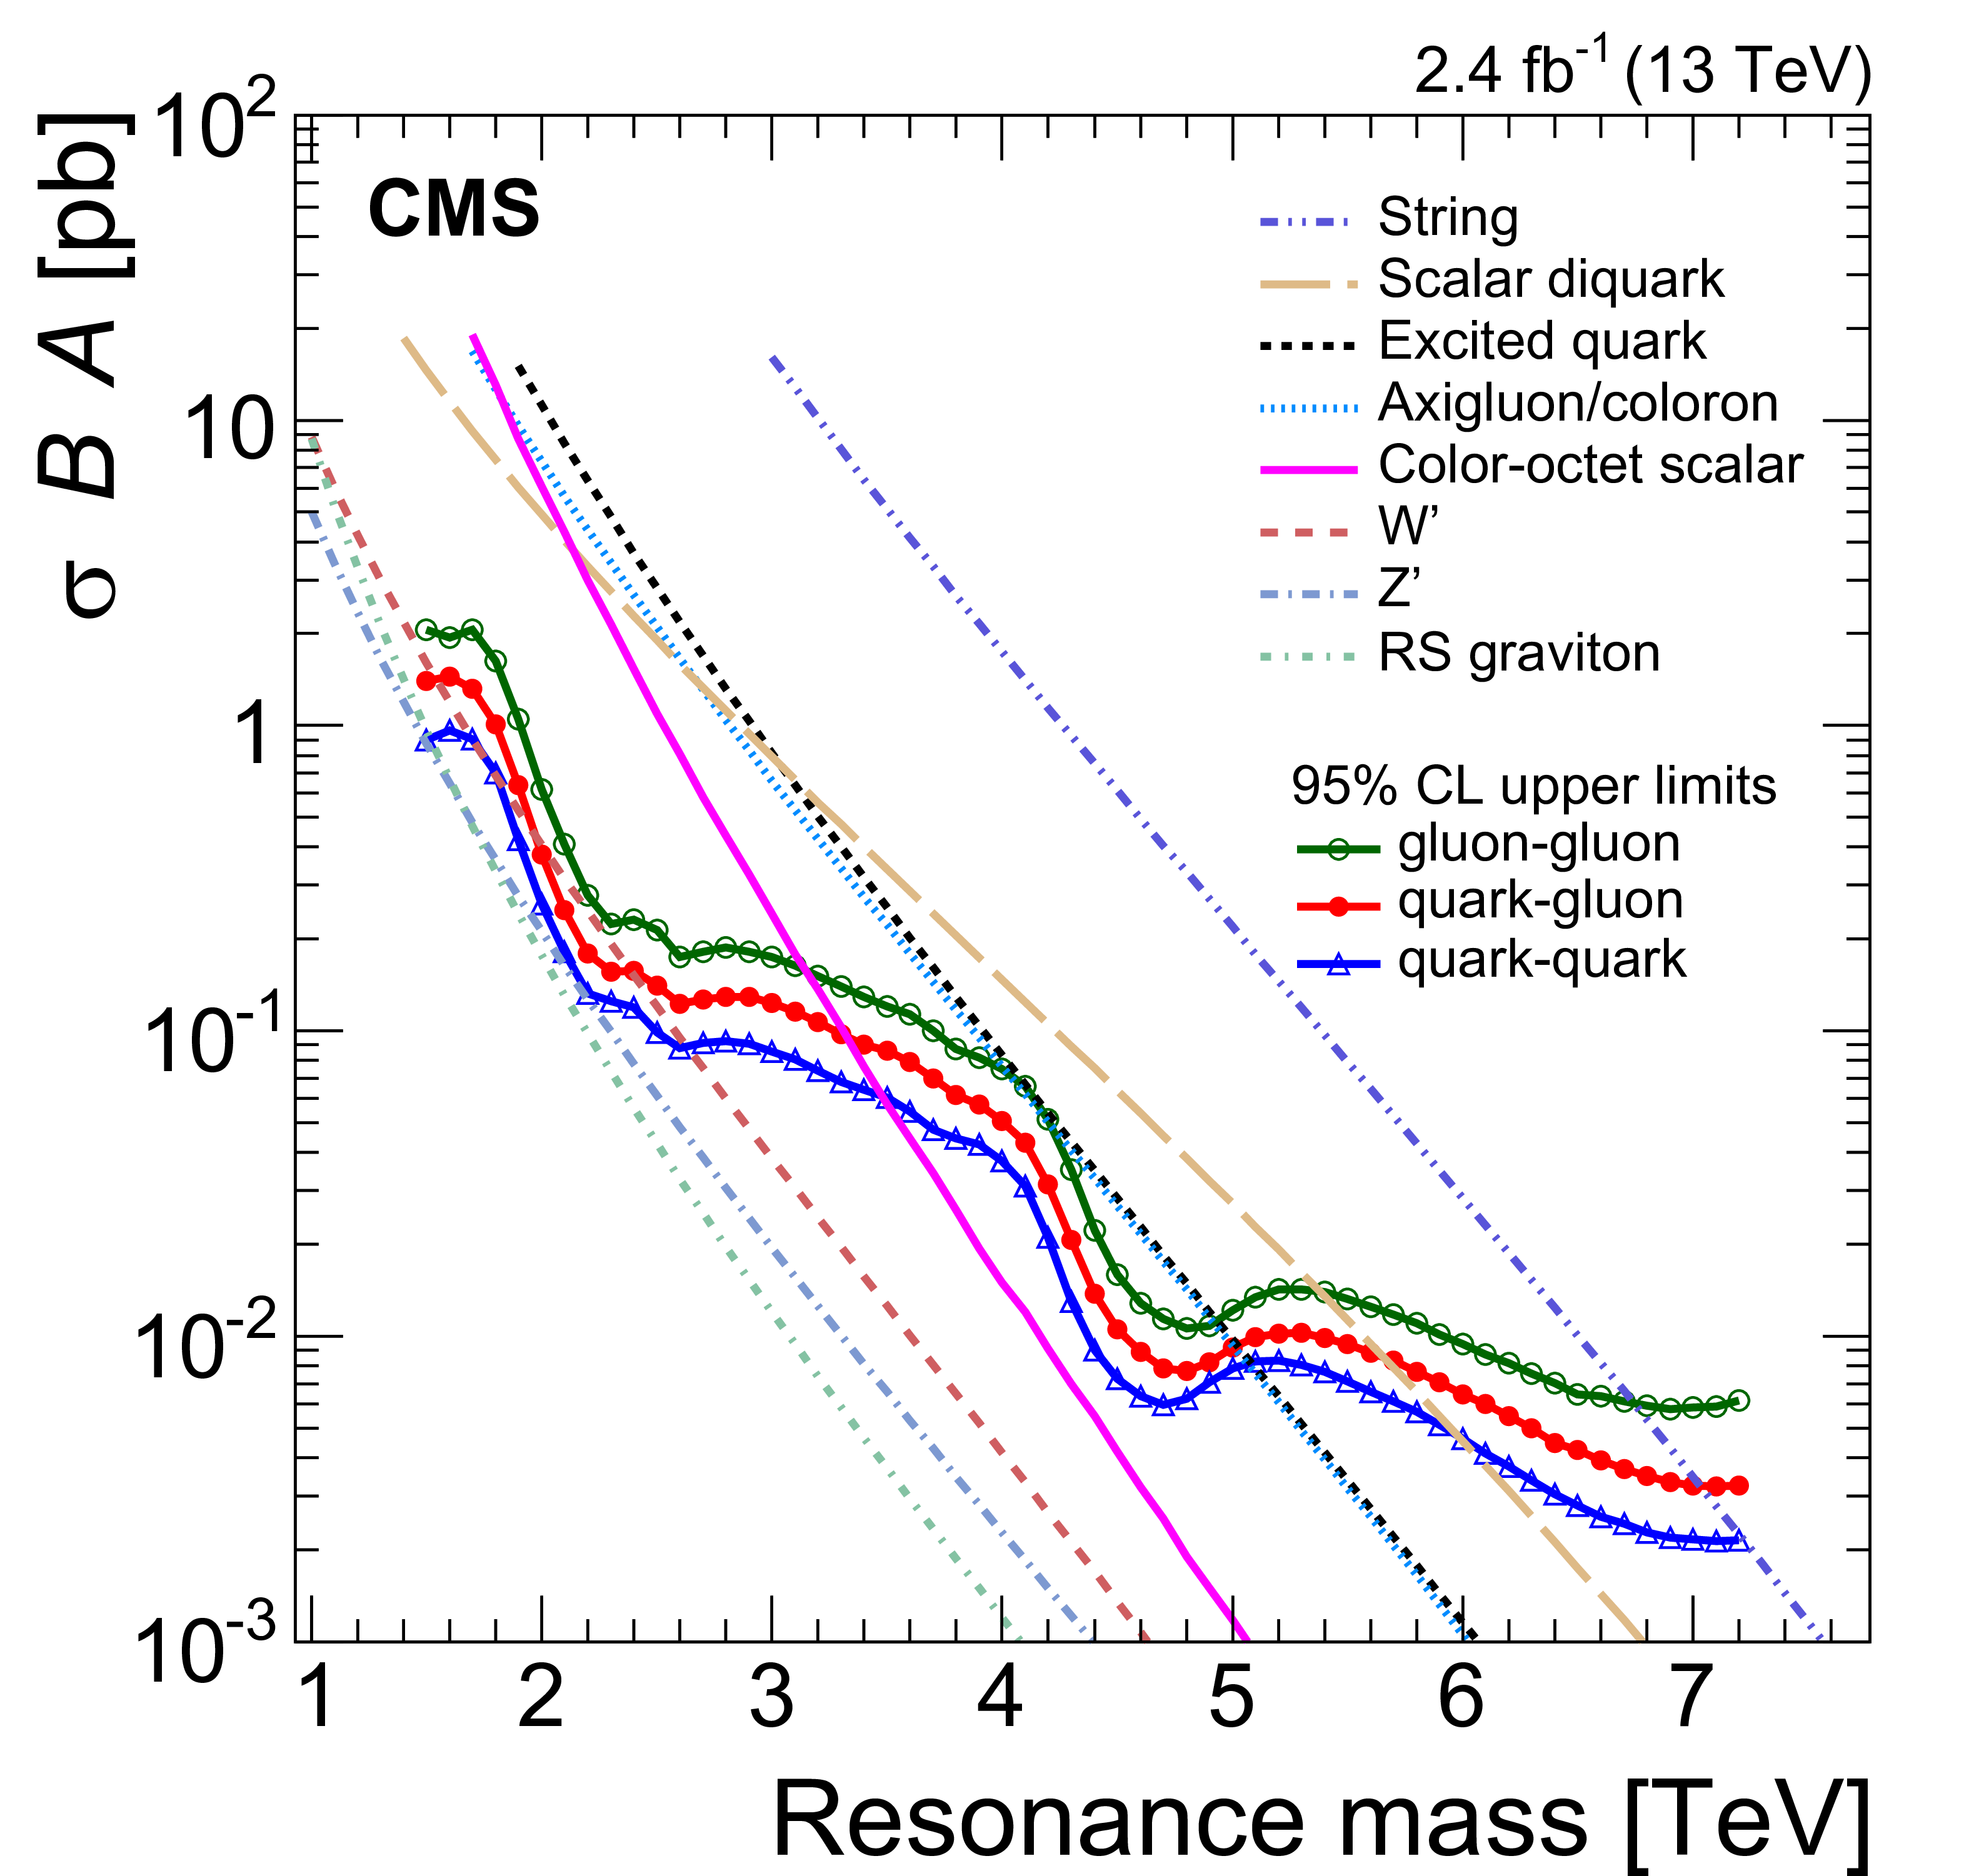
The observed 95% CL upper limits on the product of the cross section, branching fraction, and acceptance for quark-quark (a), quark-gluon (b), and gluon-gluon (c) type dijet resonances, shown as symbols connected by solid curves, and a comparison of all types (d). The corresponding expected limits (dash-dotted curves) and their variation at the 1 and 2 standard deviation levels (shaded bands) are also shown. The limits are compared to the predicted cross sections of string resonances [13,14], scalar diquarks [15], excited quarks [19,20], axigluons[16,17], colorons\ [17,18], color-octet scalars [21], new gauge bosons W' and Z' [22], and RS gravitons [23]. |
png pdf |
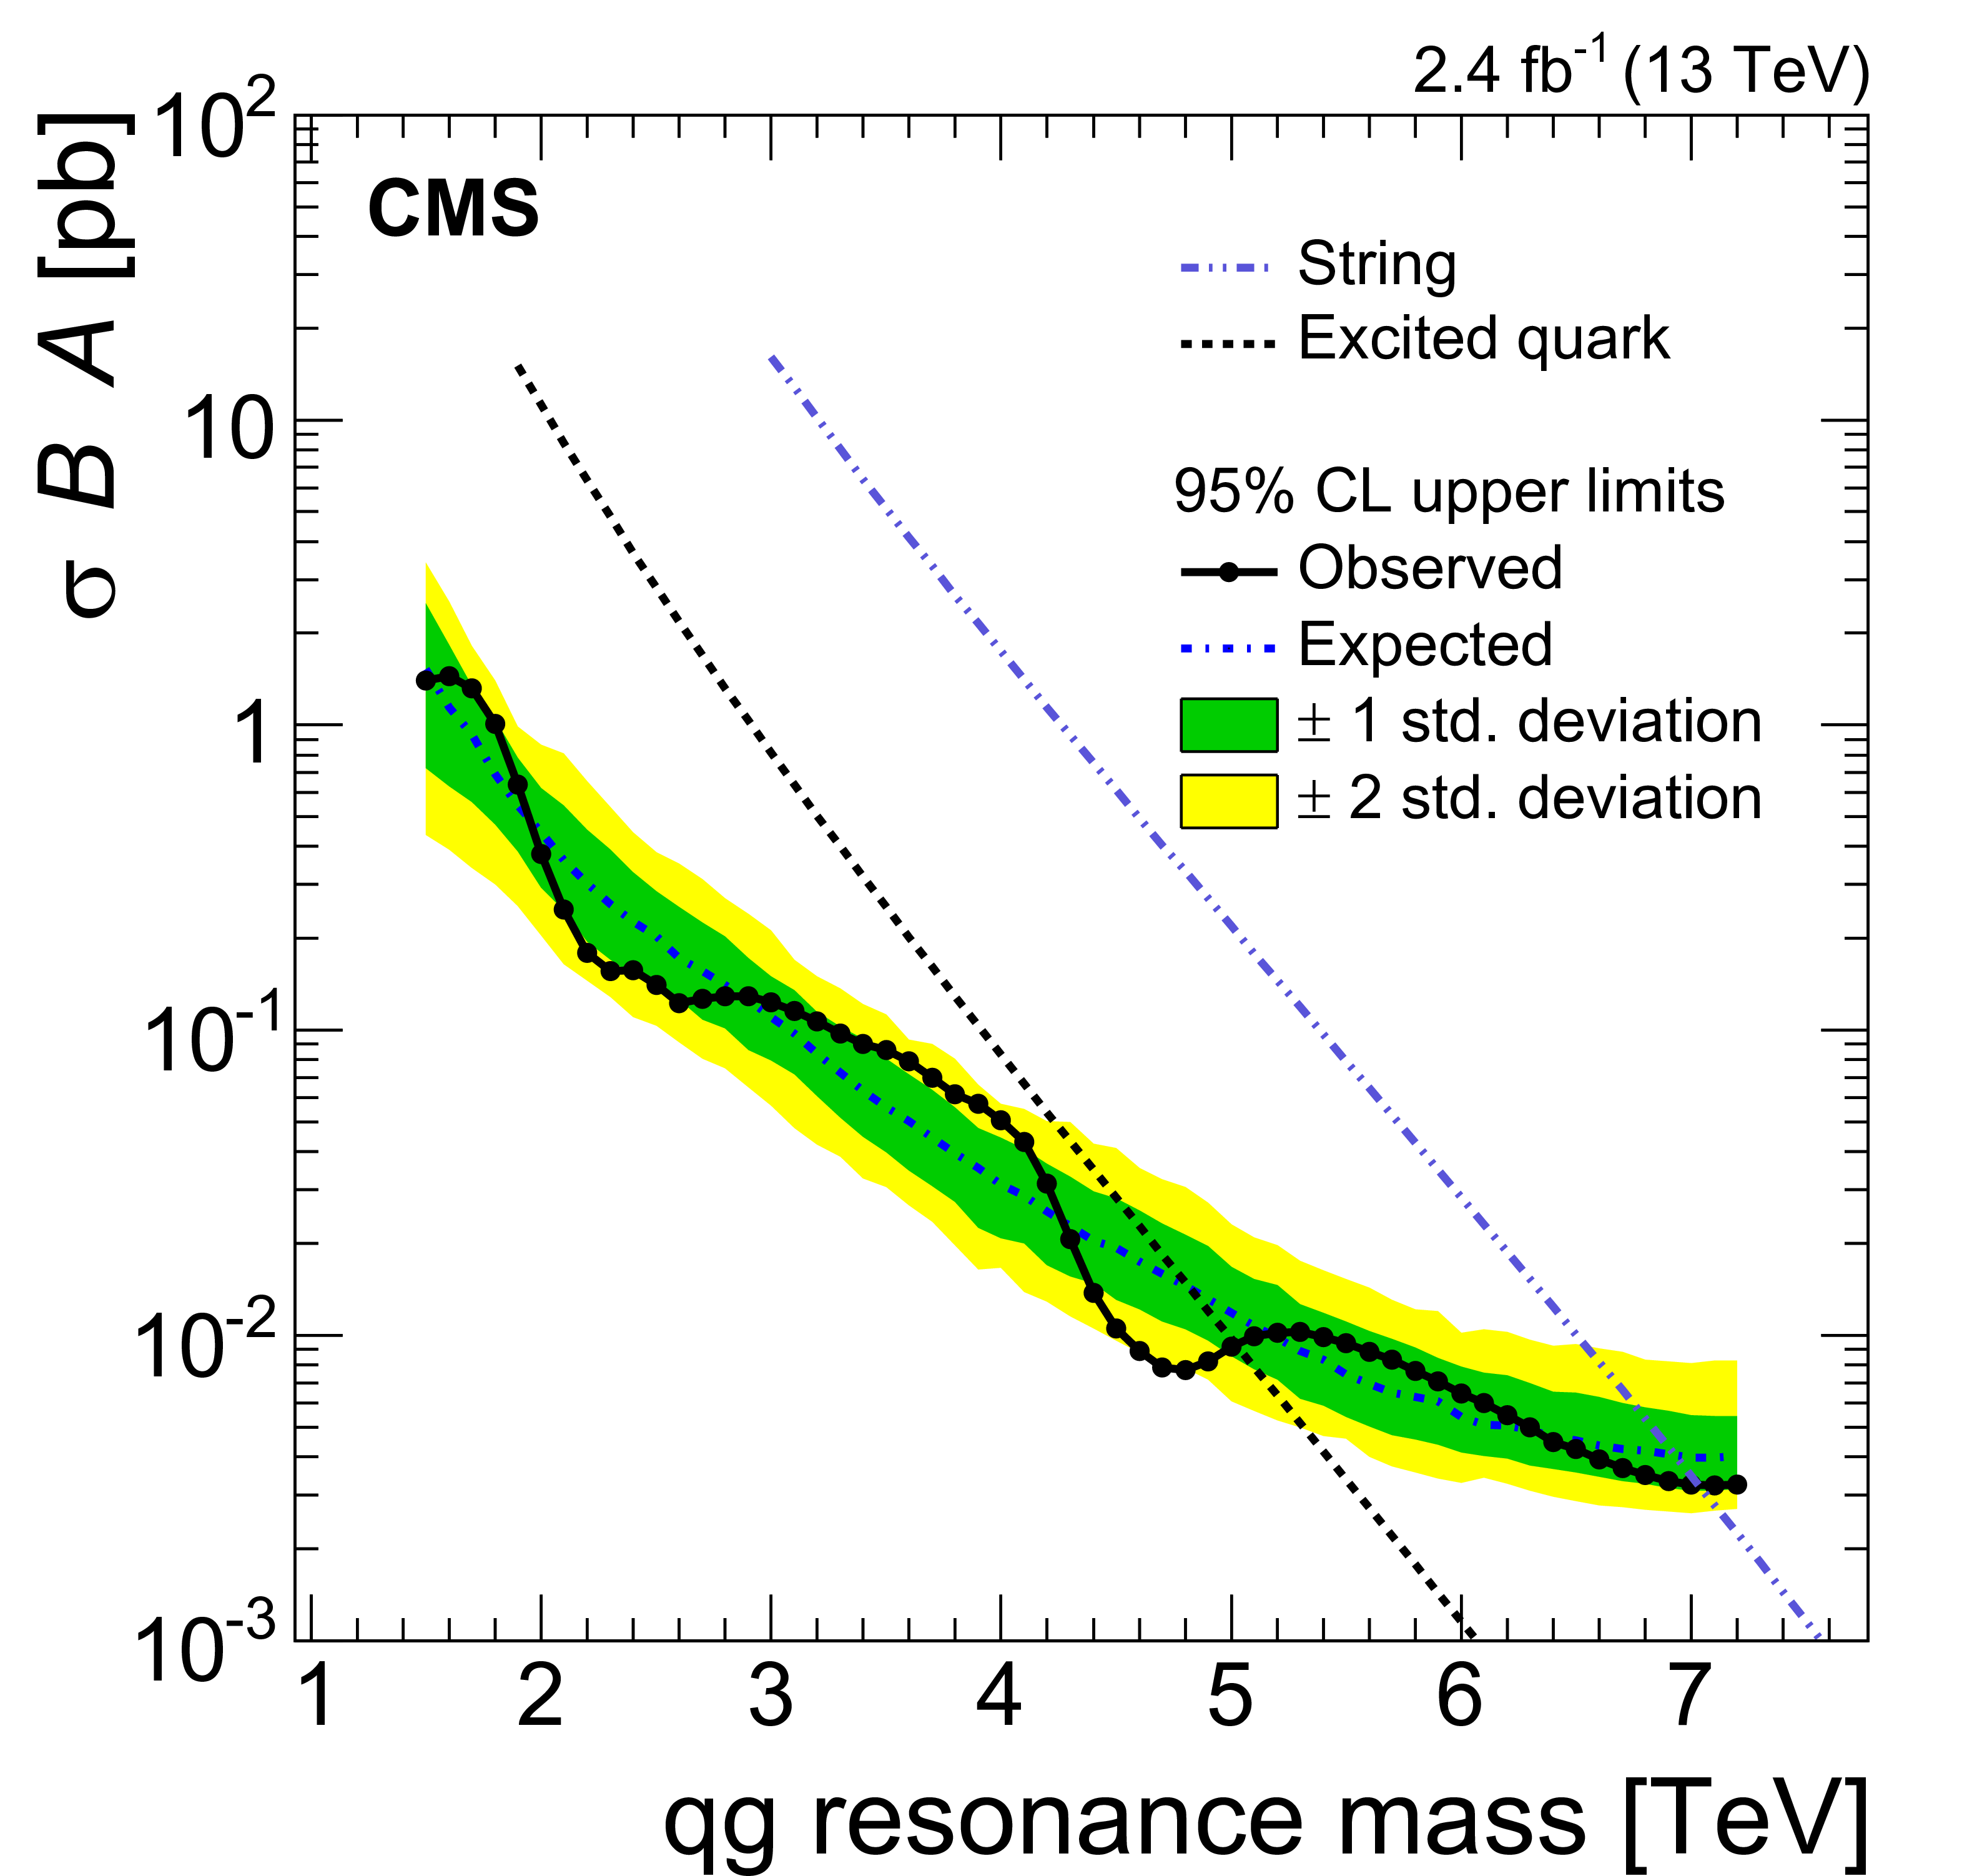
Figure 3-b:
The observed 95% CL upper limits on the product of the cross section, branching fraction, and acceptance for quark-quark (a), quark-gluon (b), and gluon-gluon (c) type dijet resonances, shown as symbols connected by solid curves, and a comparison of all types (d). The corresponding expected limits (dash-dotted curves) and their variation at the 1 and 2 standard deviation levels (shaded bands) are also shown. The limits are compared to the predicted cross sections of string resonances [13,14], scalar diquarks [15], excited quarks [19,20], axigluons[16,17], colorons\ [17,18], color-octet scalars [21], new gauge bosons W' and Z' [22], and RS gravitons [23]. |
png pdf |
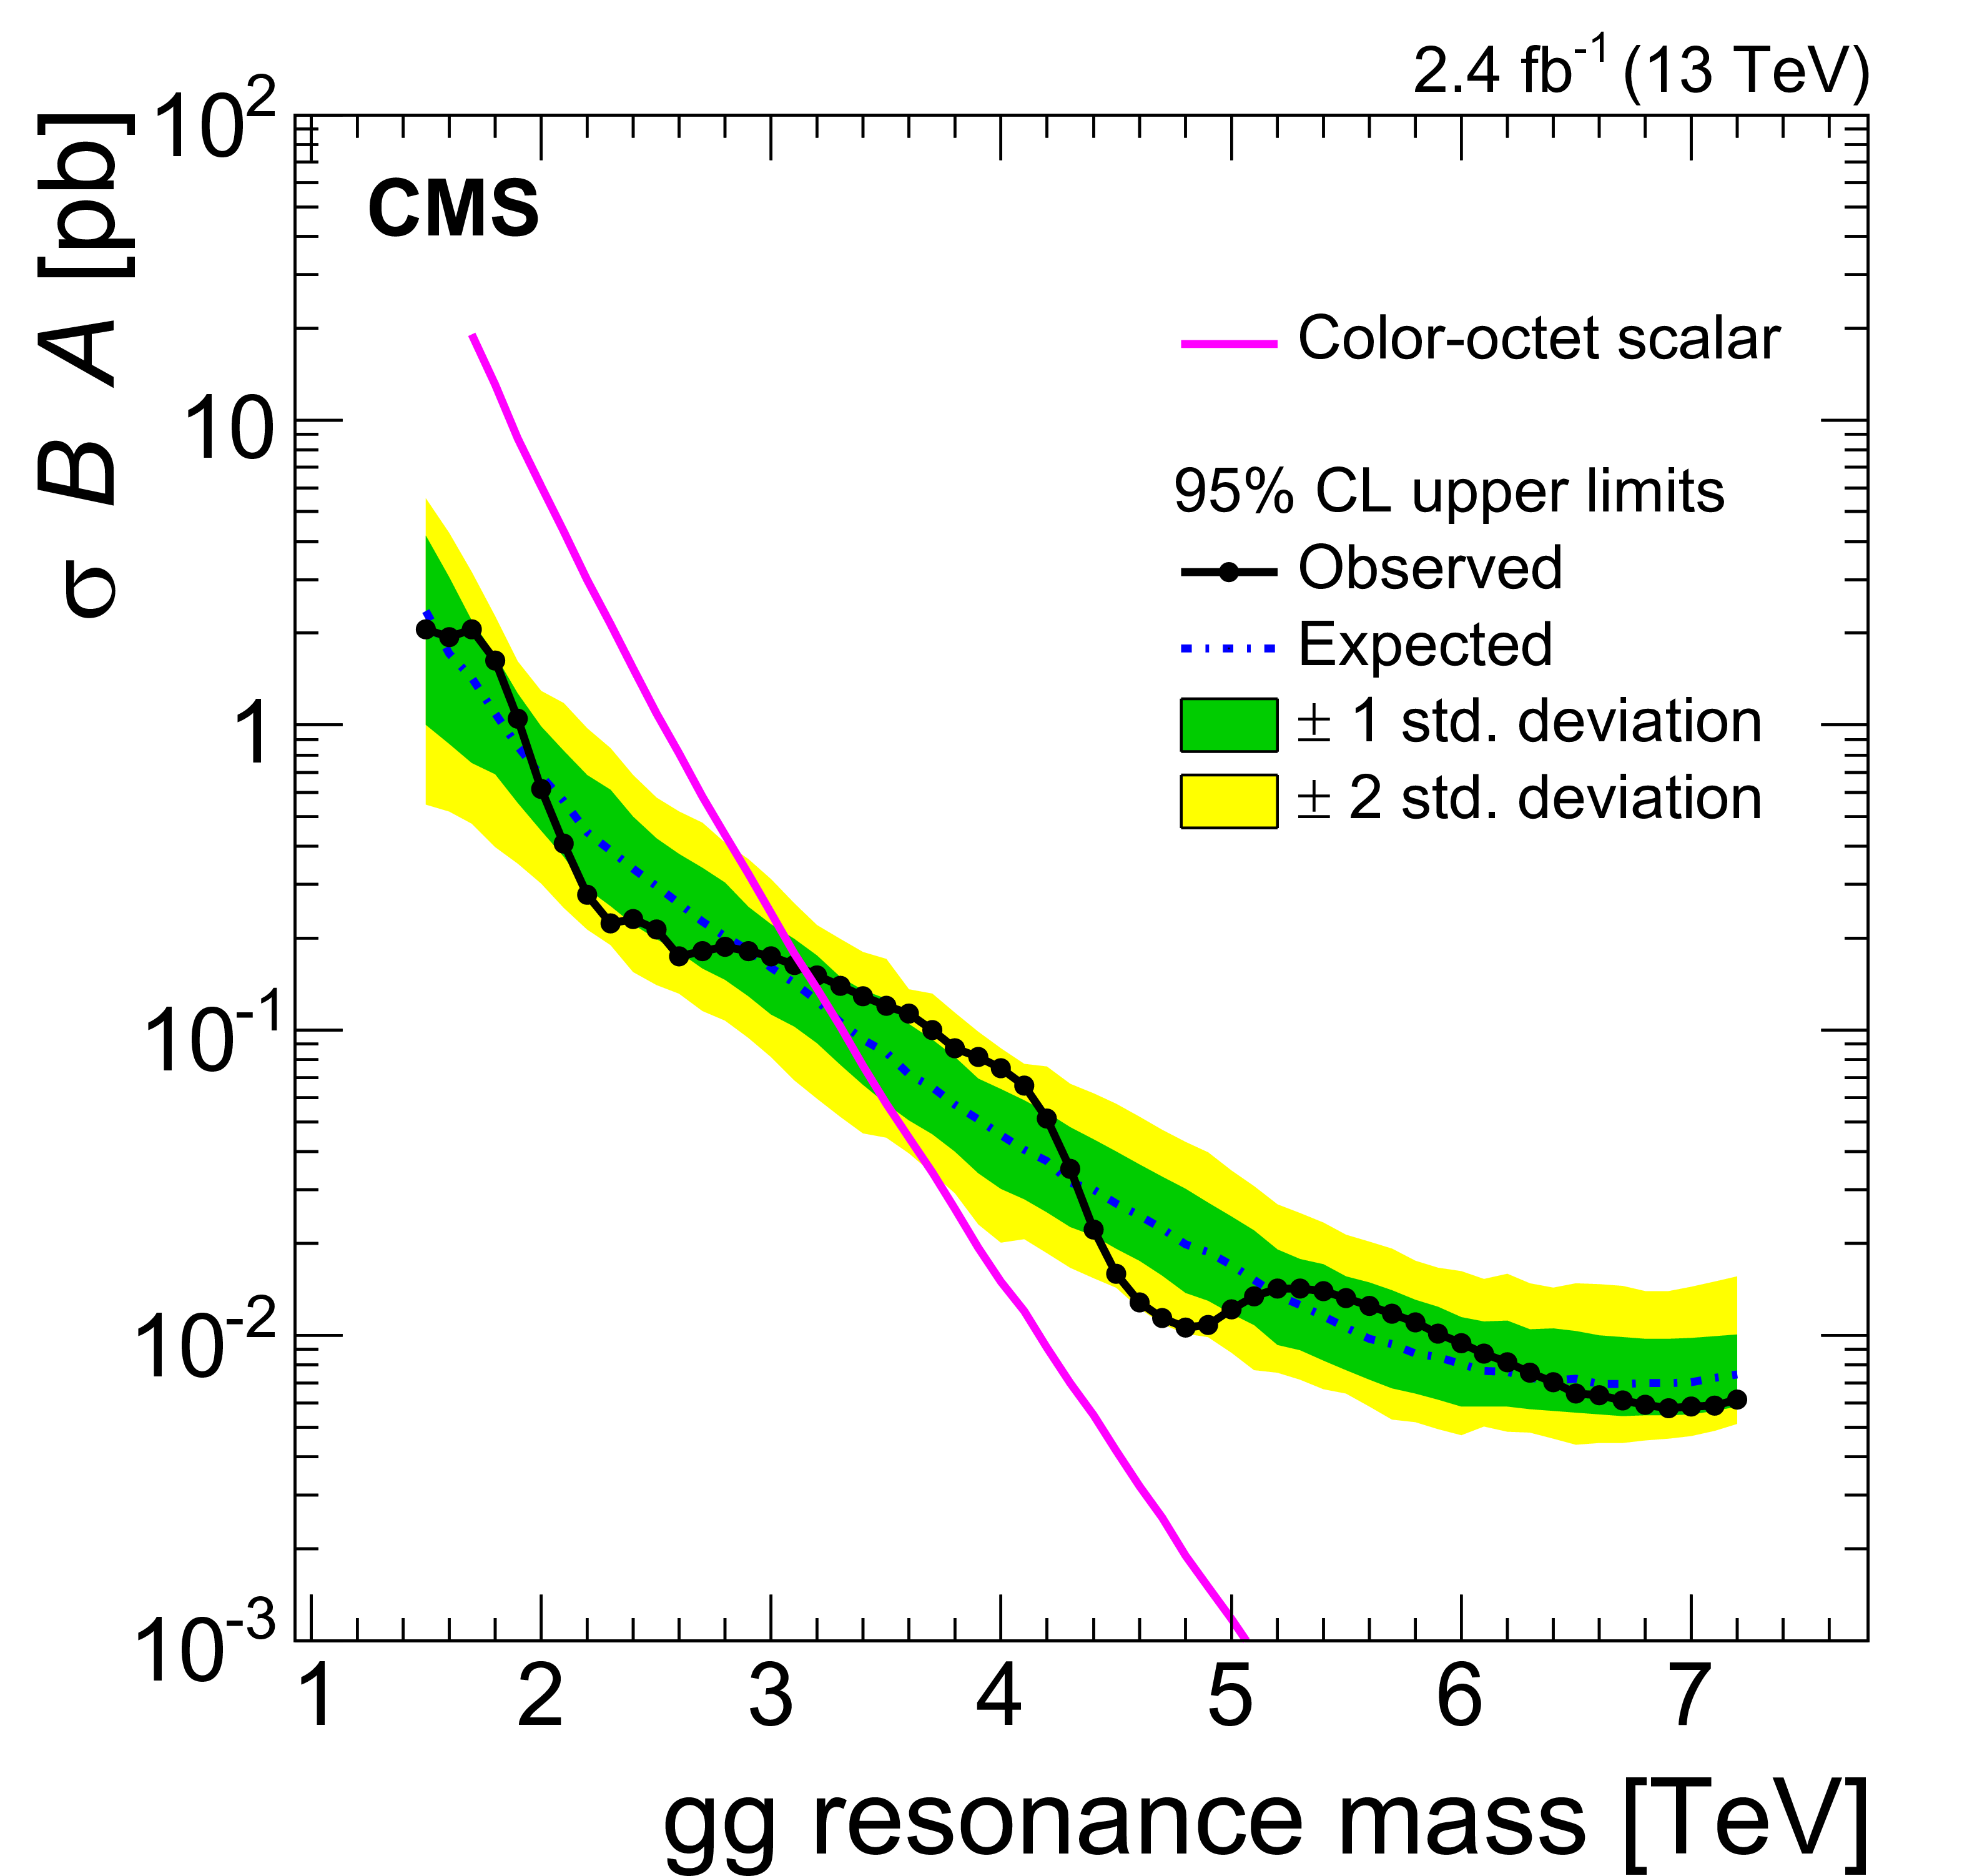
Figure 3-c:
The observed 95% CL upper limits on the product of the cross section, branching fraction, and acceptance for quark-quark (a), quark-gluon (b), and gluon-gluon (c) type dijet resonances, shown as symbols connected by solid curves, and a comparison of all types (d). The corresponding expected limits (dash-dotted curves) and their variation at the 1 and 2 standard deviation levels (shaded bands) are also shown. The limits are compared to the predicted cross sections of string resonances [13,14], scalar diquarks [15], excited quarks [19,20], axigluons[16,17], colorons\ [17,18], color-octet scalars [21], new gauge bosons W' and Z' [22], and RS gravitons [23]. |
png pdf |
Figure 3-d:
The observed 95% CL upper limits on the product of the cross section, branching fraction, and acceptance for quark-quark (a), quark-gluon (b), and gluon-gluon (c) type dijet resonances, shown as symbols connected by solid curves, and a comparison of all types (d). The corresponding expected limits (dash-dotted curves) and their variation at the 1 and 2 standard deviation levels (shaded bands) are also shown. The limits are compared to the predicted cross sections of string resonances [13,14], scalar diquarks [15], excited quarks [19,20], axigluons[16,17], colorons\ [17,18], color-octet scalars [21], new gauge bosons W' and Z' [22], and RS gravitons [23]. |
| Tables | |
png pdf |
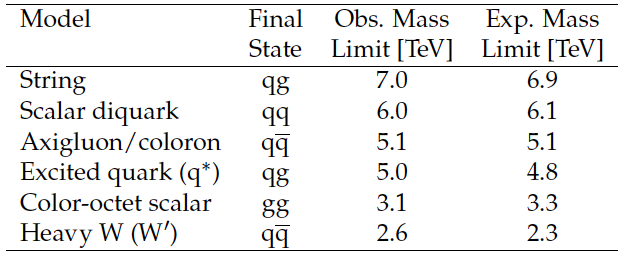
Table 1:
Observed and expected mass limits for analyses that exclude the listed models at 95%CL for a resonance mass from 1.5 TeV up to the indicated values. |
| Summary |
| In summary, a search for narrow resonances decaying into a pair of jets has been performed using a data sample of pp collisions at $\sqrt{s} = $ 13 TeV corresponding to an integrated luminosity of 2.4 fb$^{-1}$. The dijet mass spectrum has been measured to be a smoothly falling distribution. In the analyzed data sample, there is no evidence for resonant particle production. We present generic upper limits on the product $\sigma \times \mathcal{B} \times A $ that are applicable to any model of narrow dijet resonance production. This search is more sensitive than previous searches for dijet resonances for masses above 2 TeV. We set the most stringent limits to date on the masses of string resonances, scalar diquarks, axigluons, colorons, excited quarks, color-octet scalars, and W' bosons. |
| Additional Figures | |
png pdf |
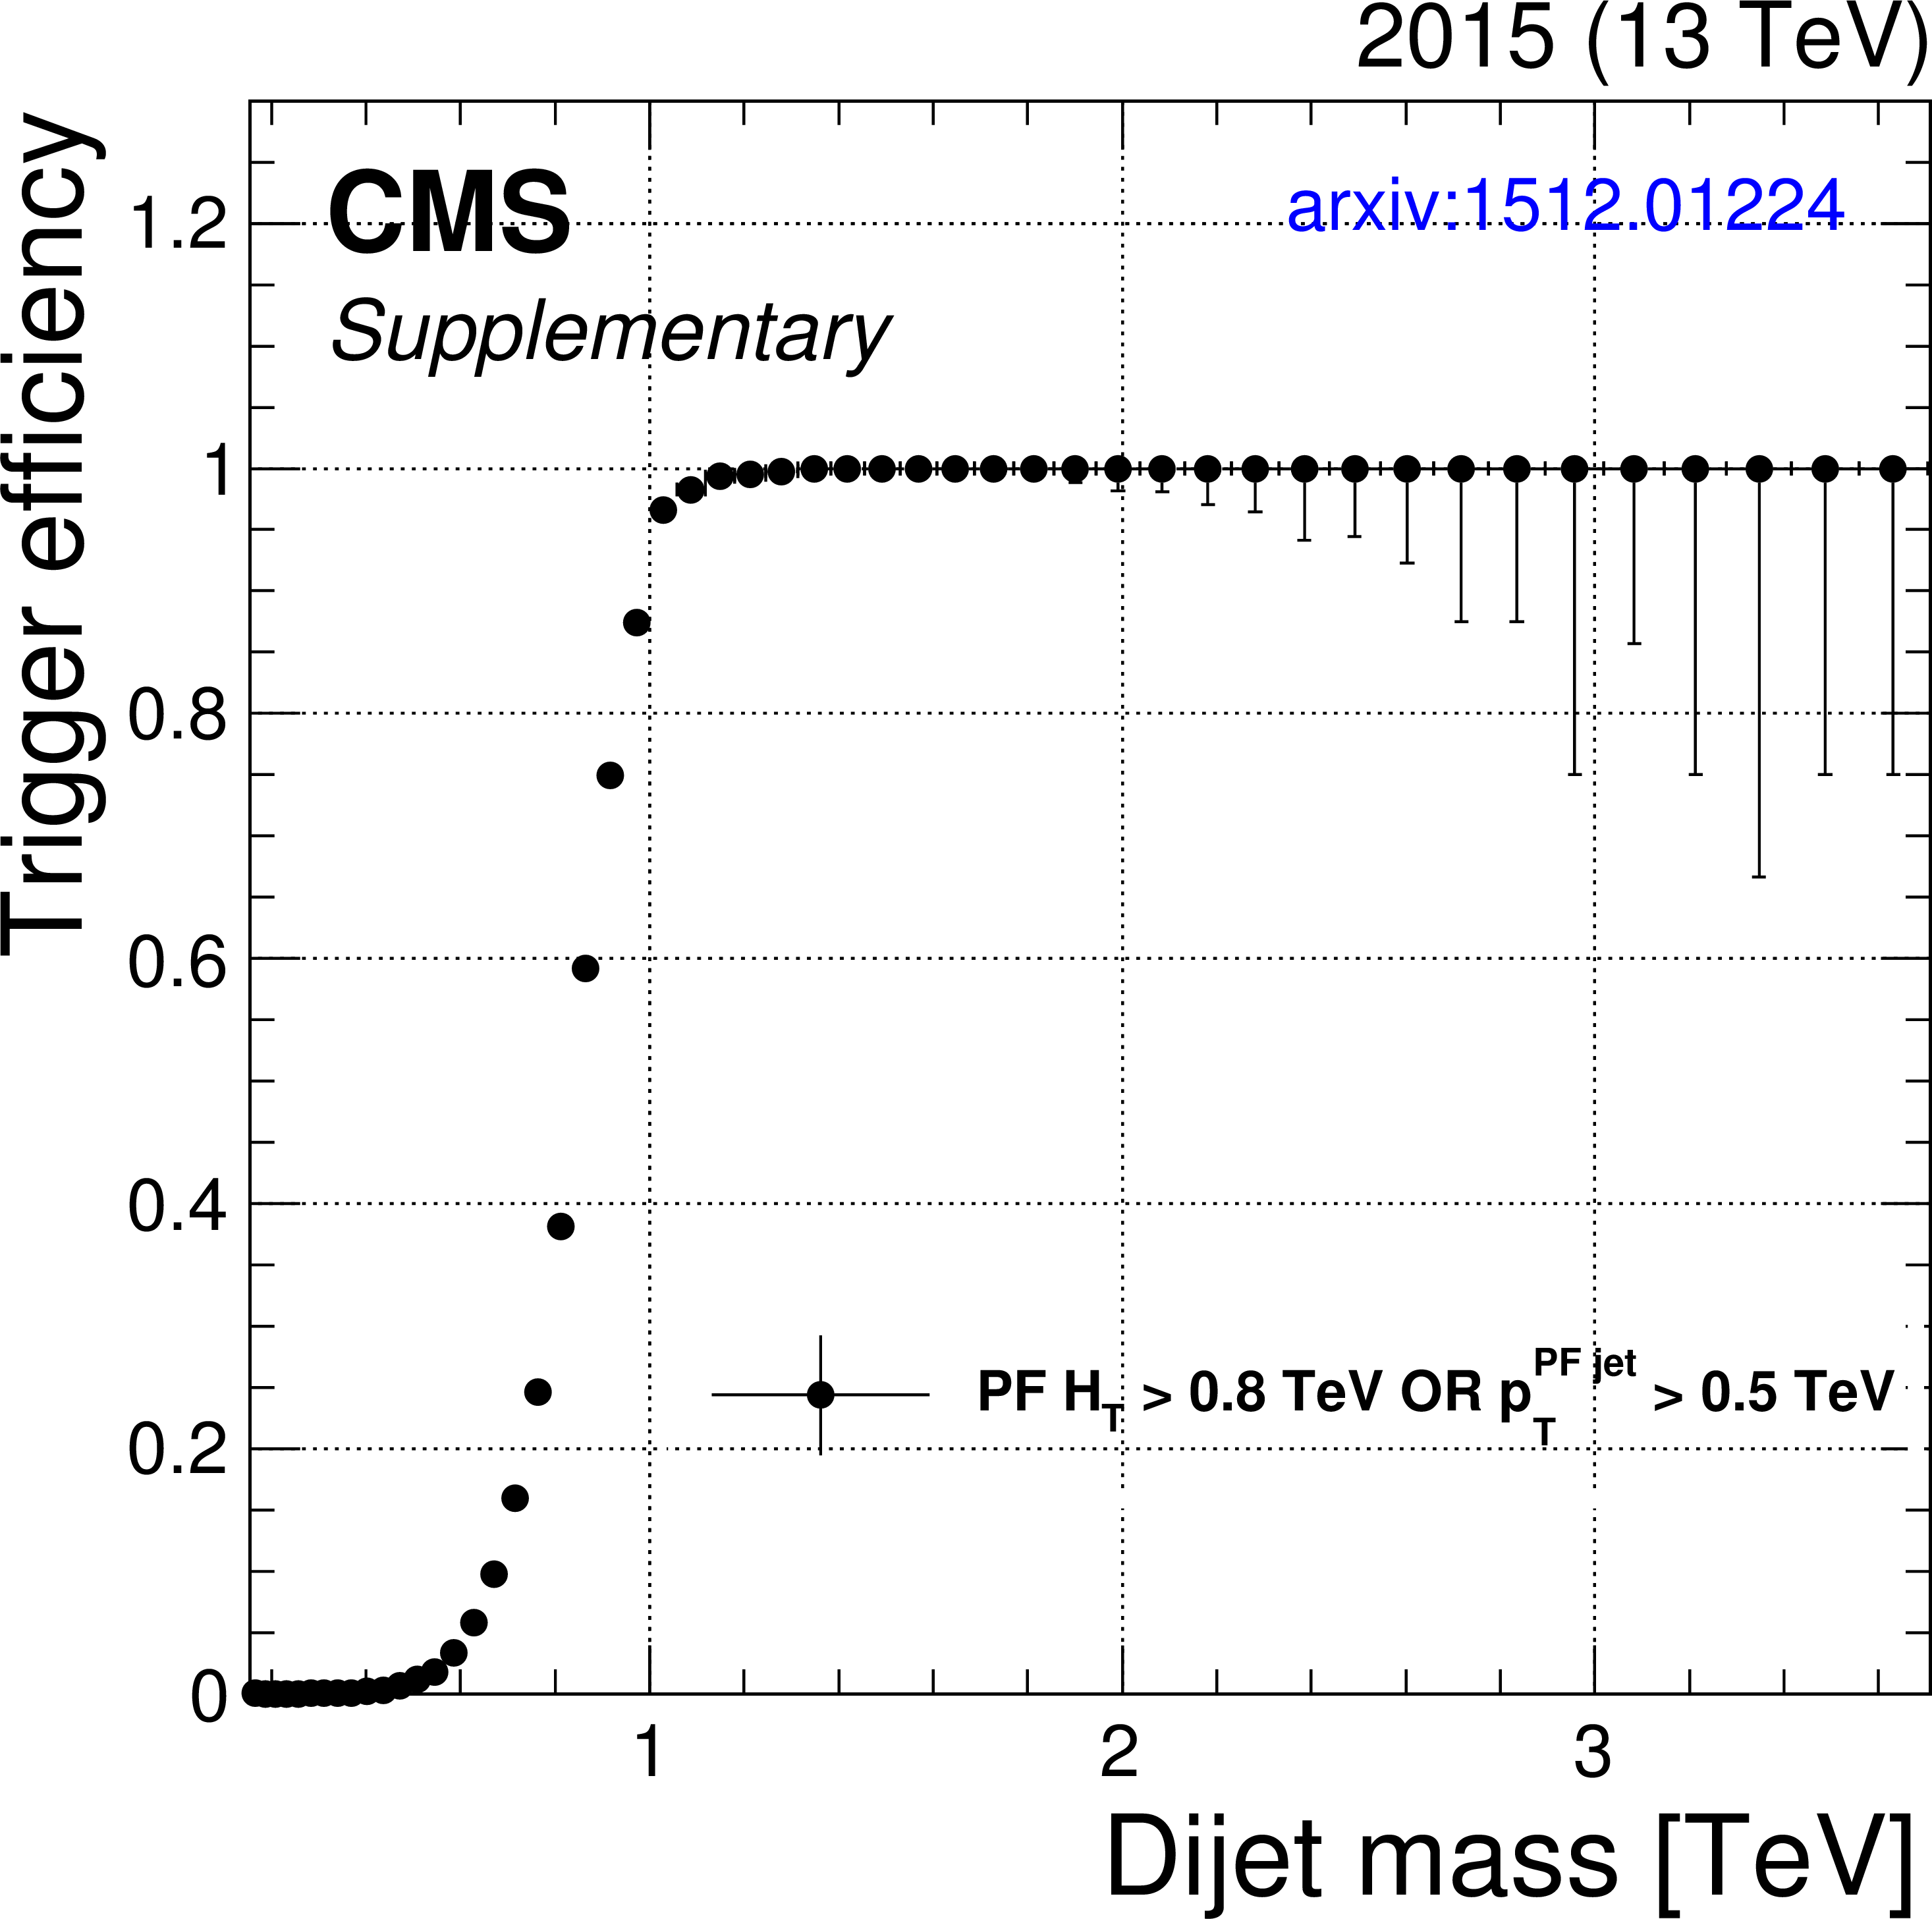
Additional Figure 1:
Trigger efficiency as a function of the reconstructed dijet mass. The trigger selection requires that events have $H_\mathrm {T}> $ 0.8 TeV or include a jet with $ {p_{\mathrm {T}}} > $ 0.5 TeV. |
png pdf |
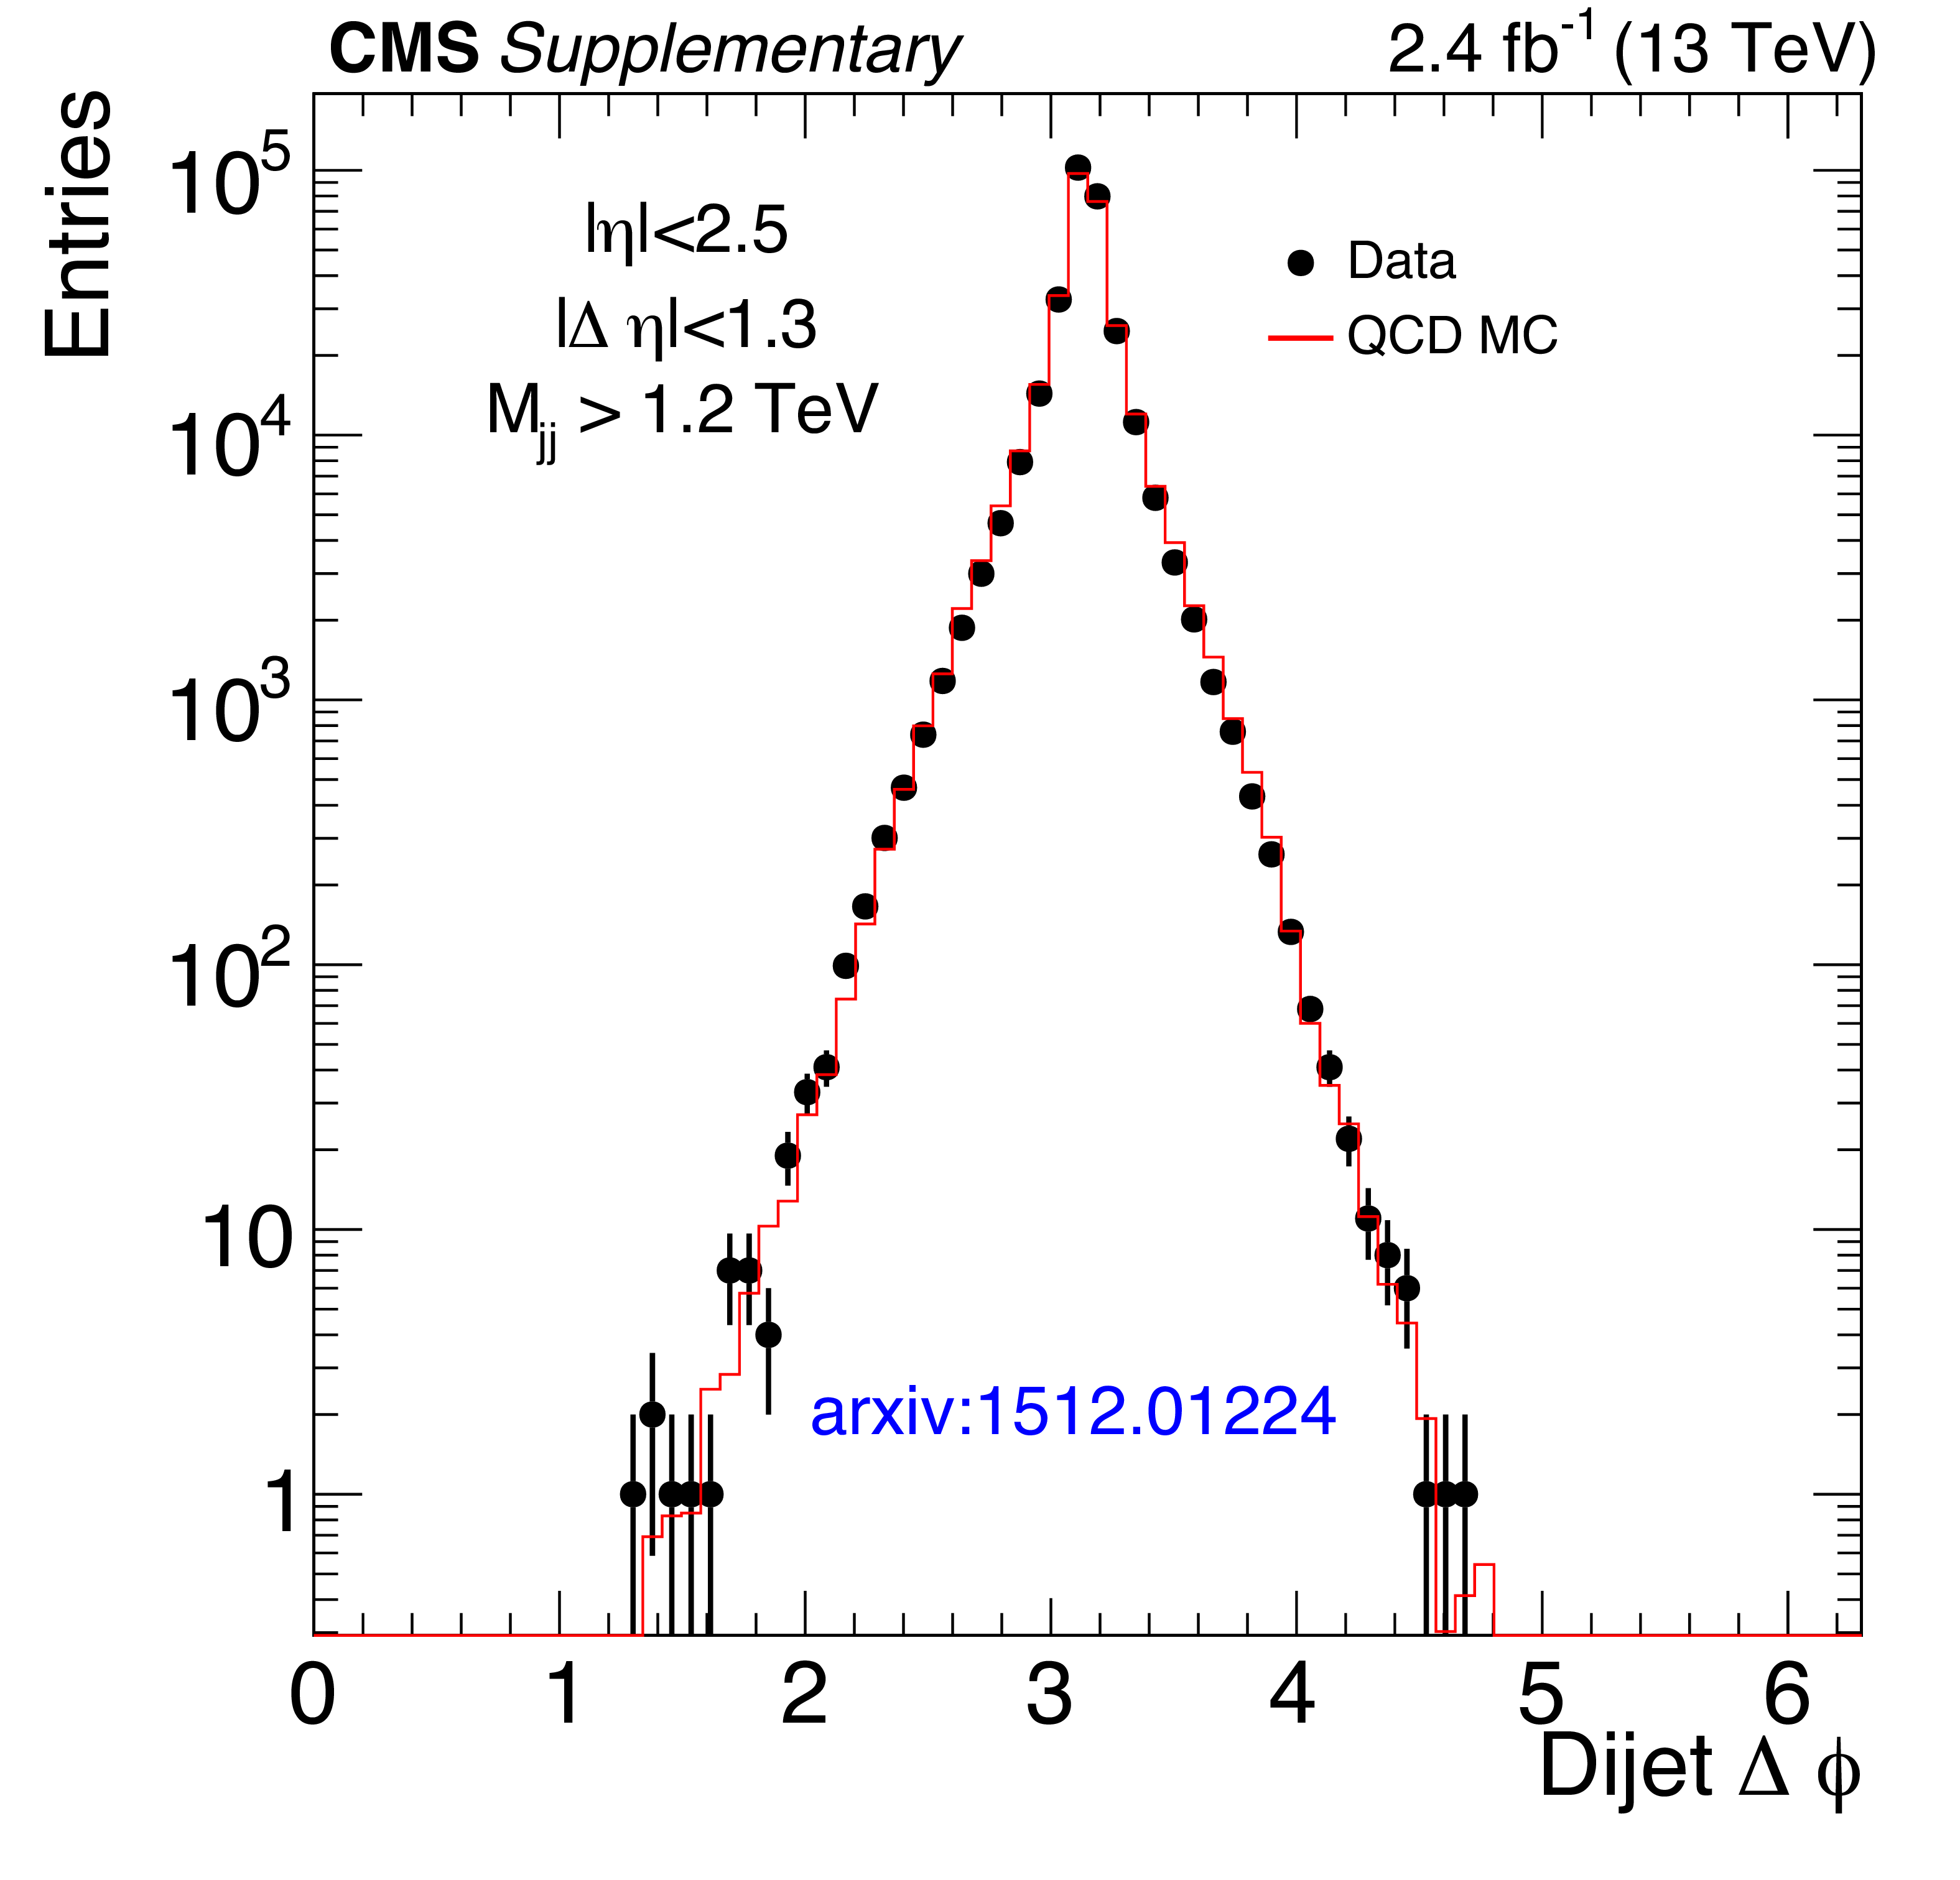
Additional Figure 2:
Distribution of the azimuthal separation $ {\Delta \phi _{\text {jj}}} $ between the two wide jets for the data and the QCD MC simulation. The MC prediction is normalized to the integrated contents of the data, requiring multiplication of the predicted cross section by a factor of 0.88. |

png pdf |
Additional Figure 3:
Distribution of the pseudorapity separation $ { {| \Delta \eta _{\text {jj}} | }} $ between the two wide jets for the data and the QCD MC simulation. The MC prediction is normalized to the integrated contents of the data, requiring multiplication of the predicted cross section by a factor of 0.88. |
png pdf |
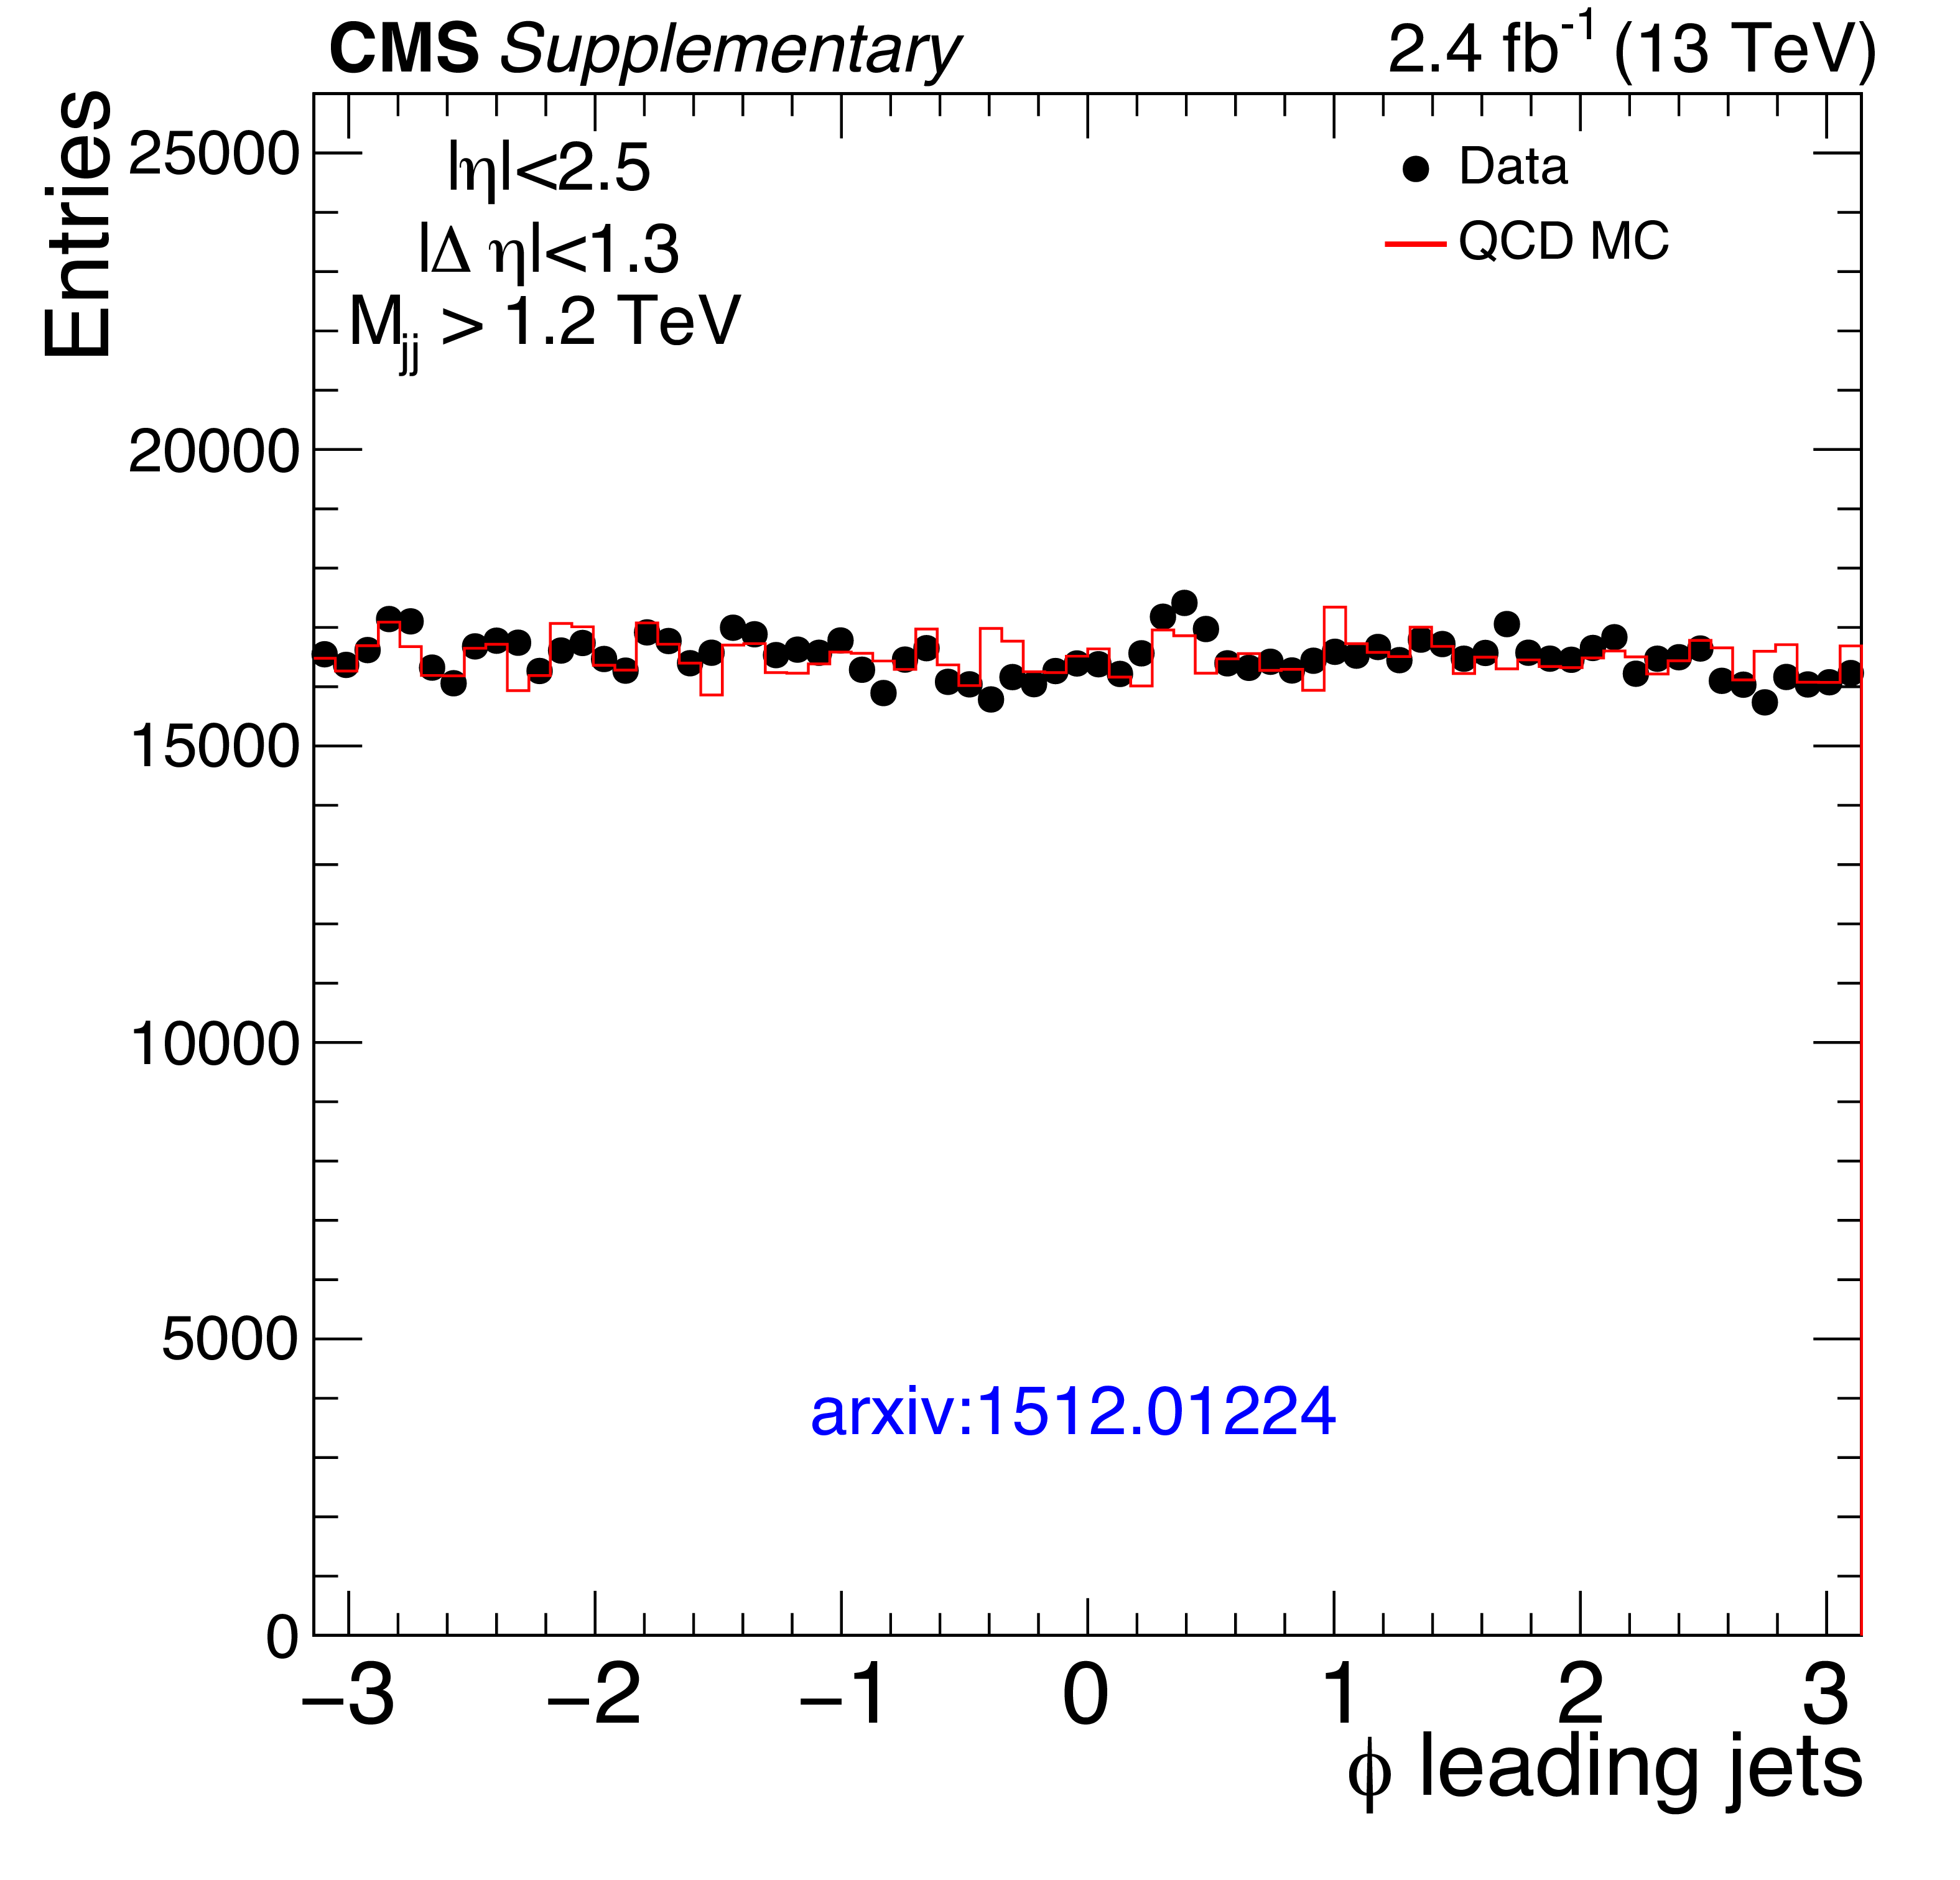
Additional Figure 4:
Distribution of the azimuthal angle $\phi $ of the two wide jets for the data and the QCD MC simulation. The MC prediction is normalized to the integrated contents of the data, requiring multiplication of the predicted cross section by a factor of 0.88. |
png pdf |
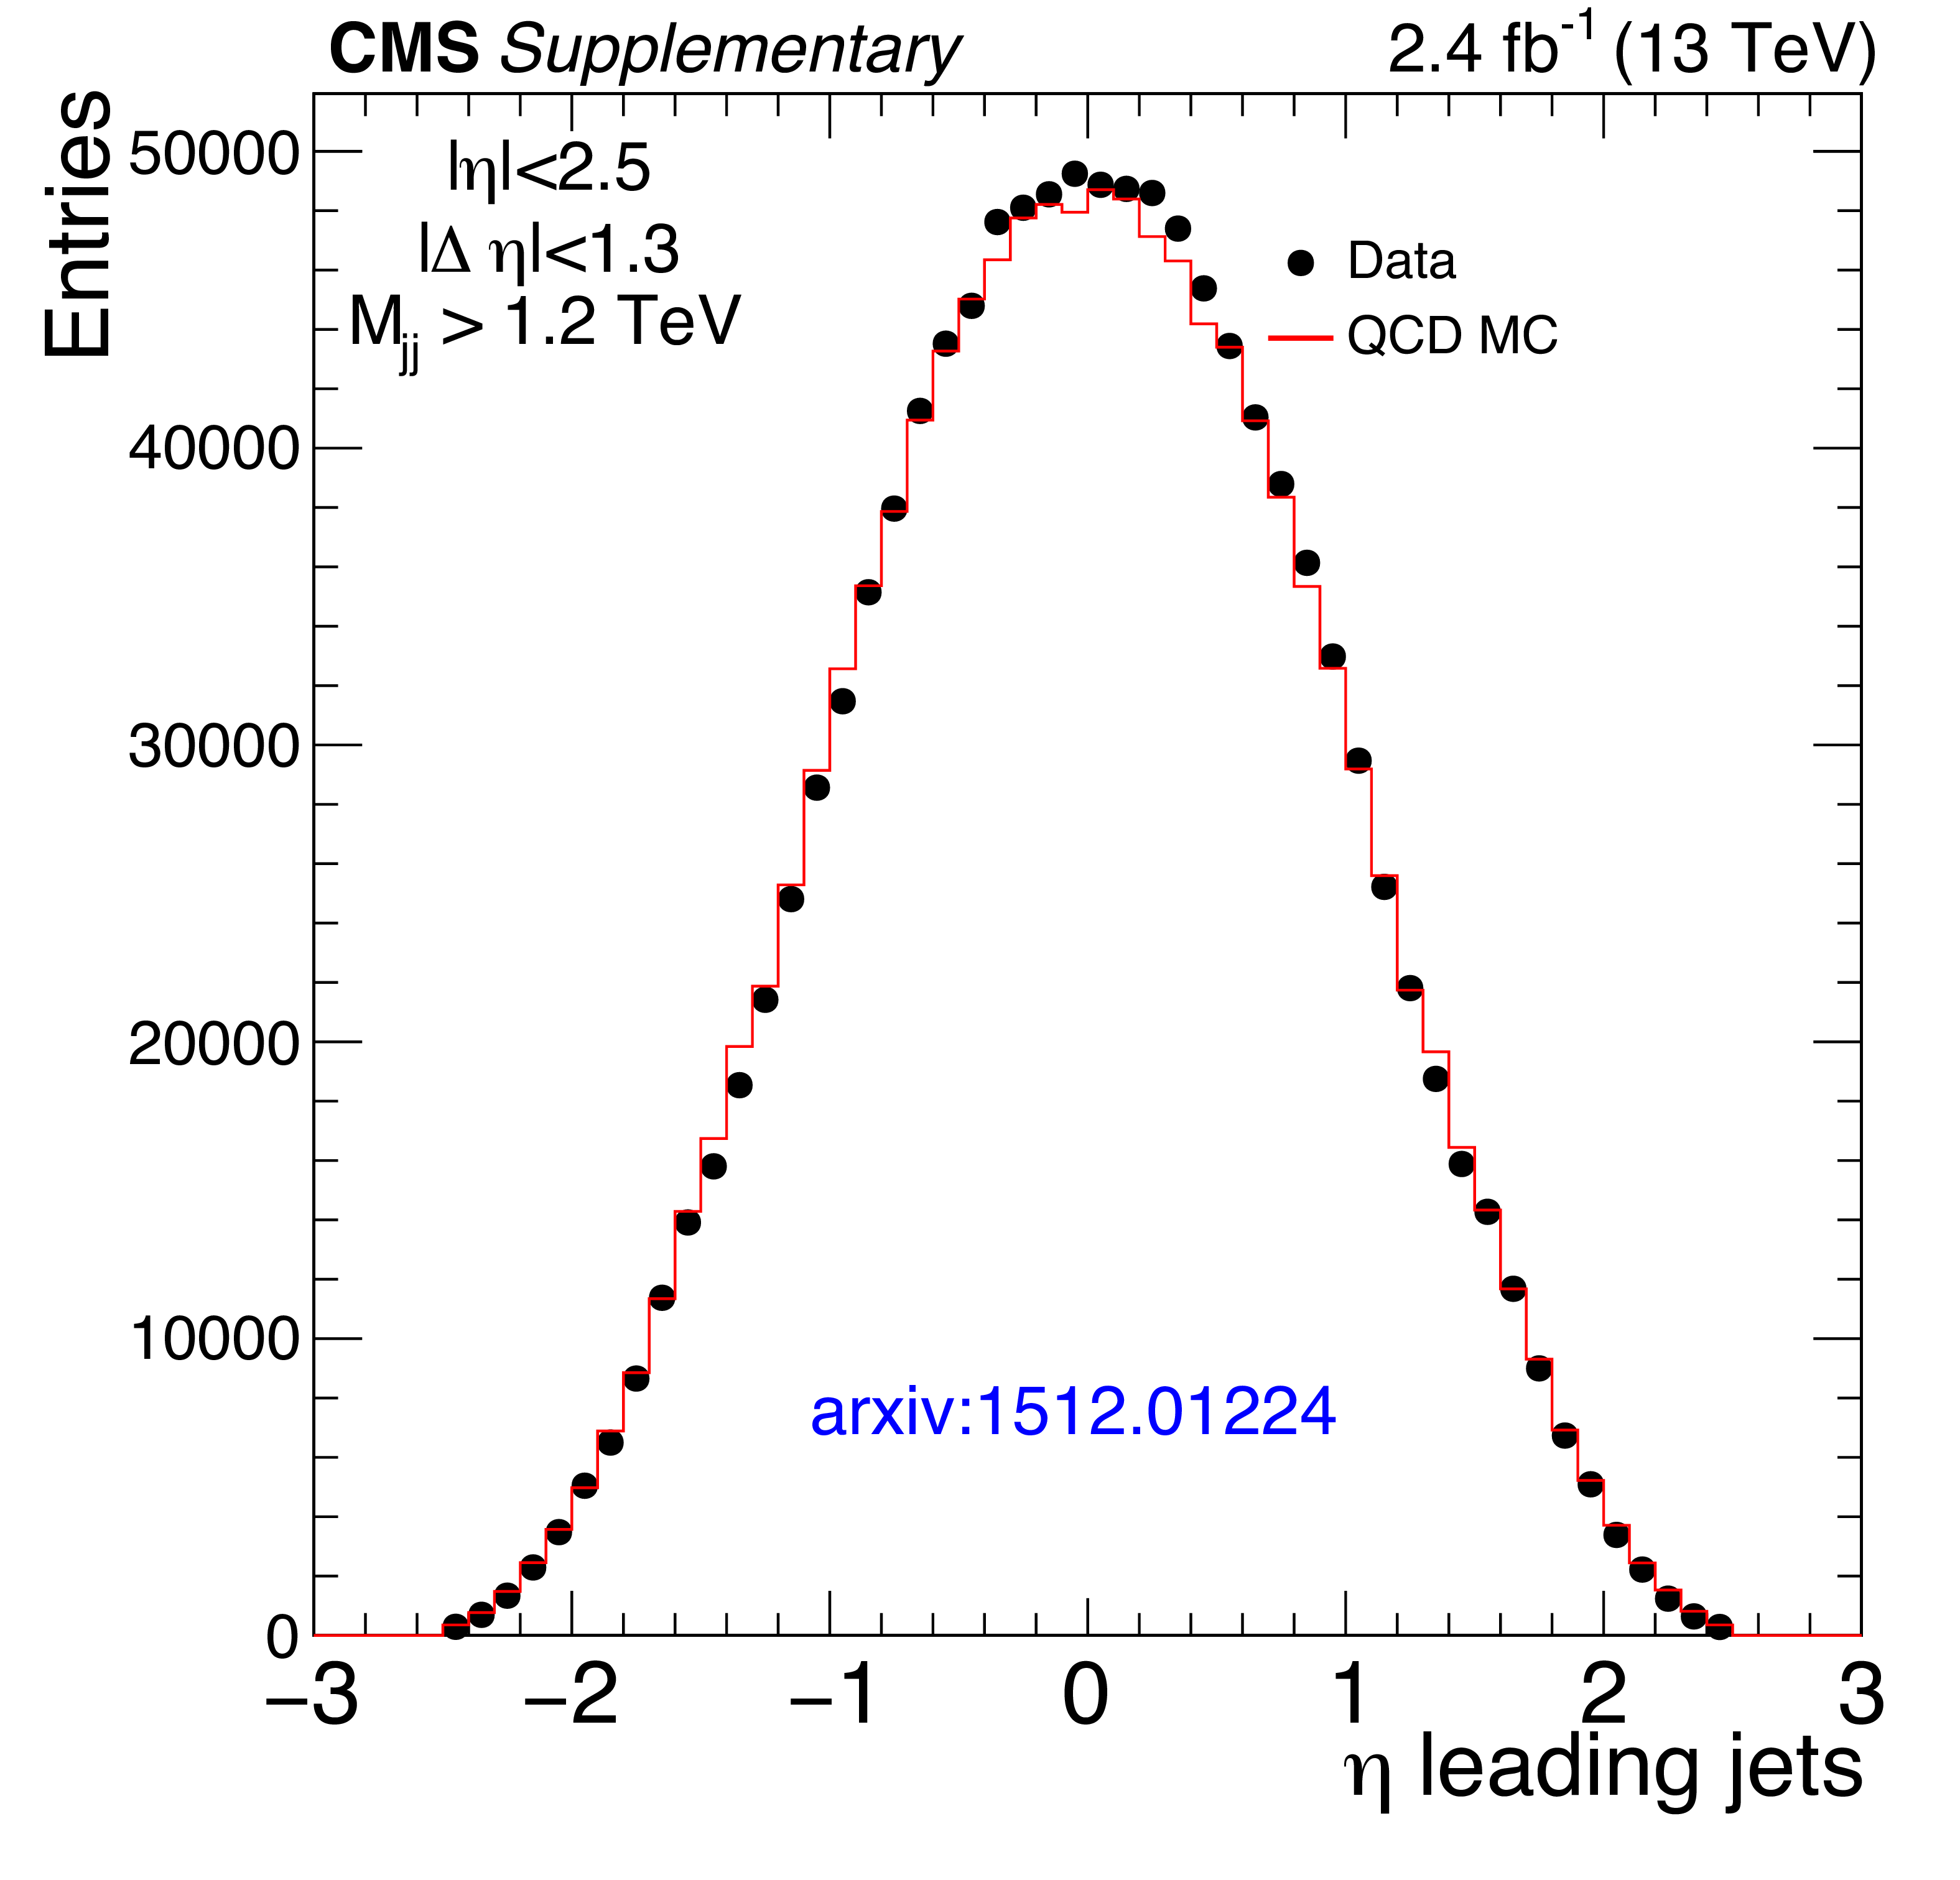
Additional Figure 5:
Distribution of the pseudorapidity $\eta $ of the two wide jets for the data and the QCD MC simulation. The MC prediction is normalized to the integrated contents of the data, requiring multiplication of the predicted cross section by a factor of 0.88. |

png pdf |
Additional Figure 6:
Distribution of the transverse momentum $ {p_{\mathrm {T}}} $ of the two wide jets for the data and the QCD MC simulation. The MC prediction is normalized to the integrated contents of the data, requiring multiplication of the predicted cross section by a factor of 0.88. |
png pdf |
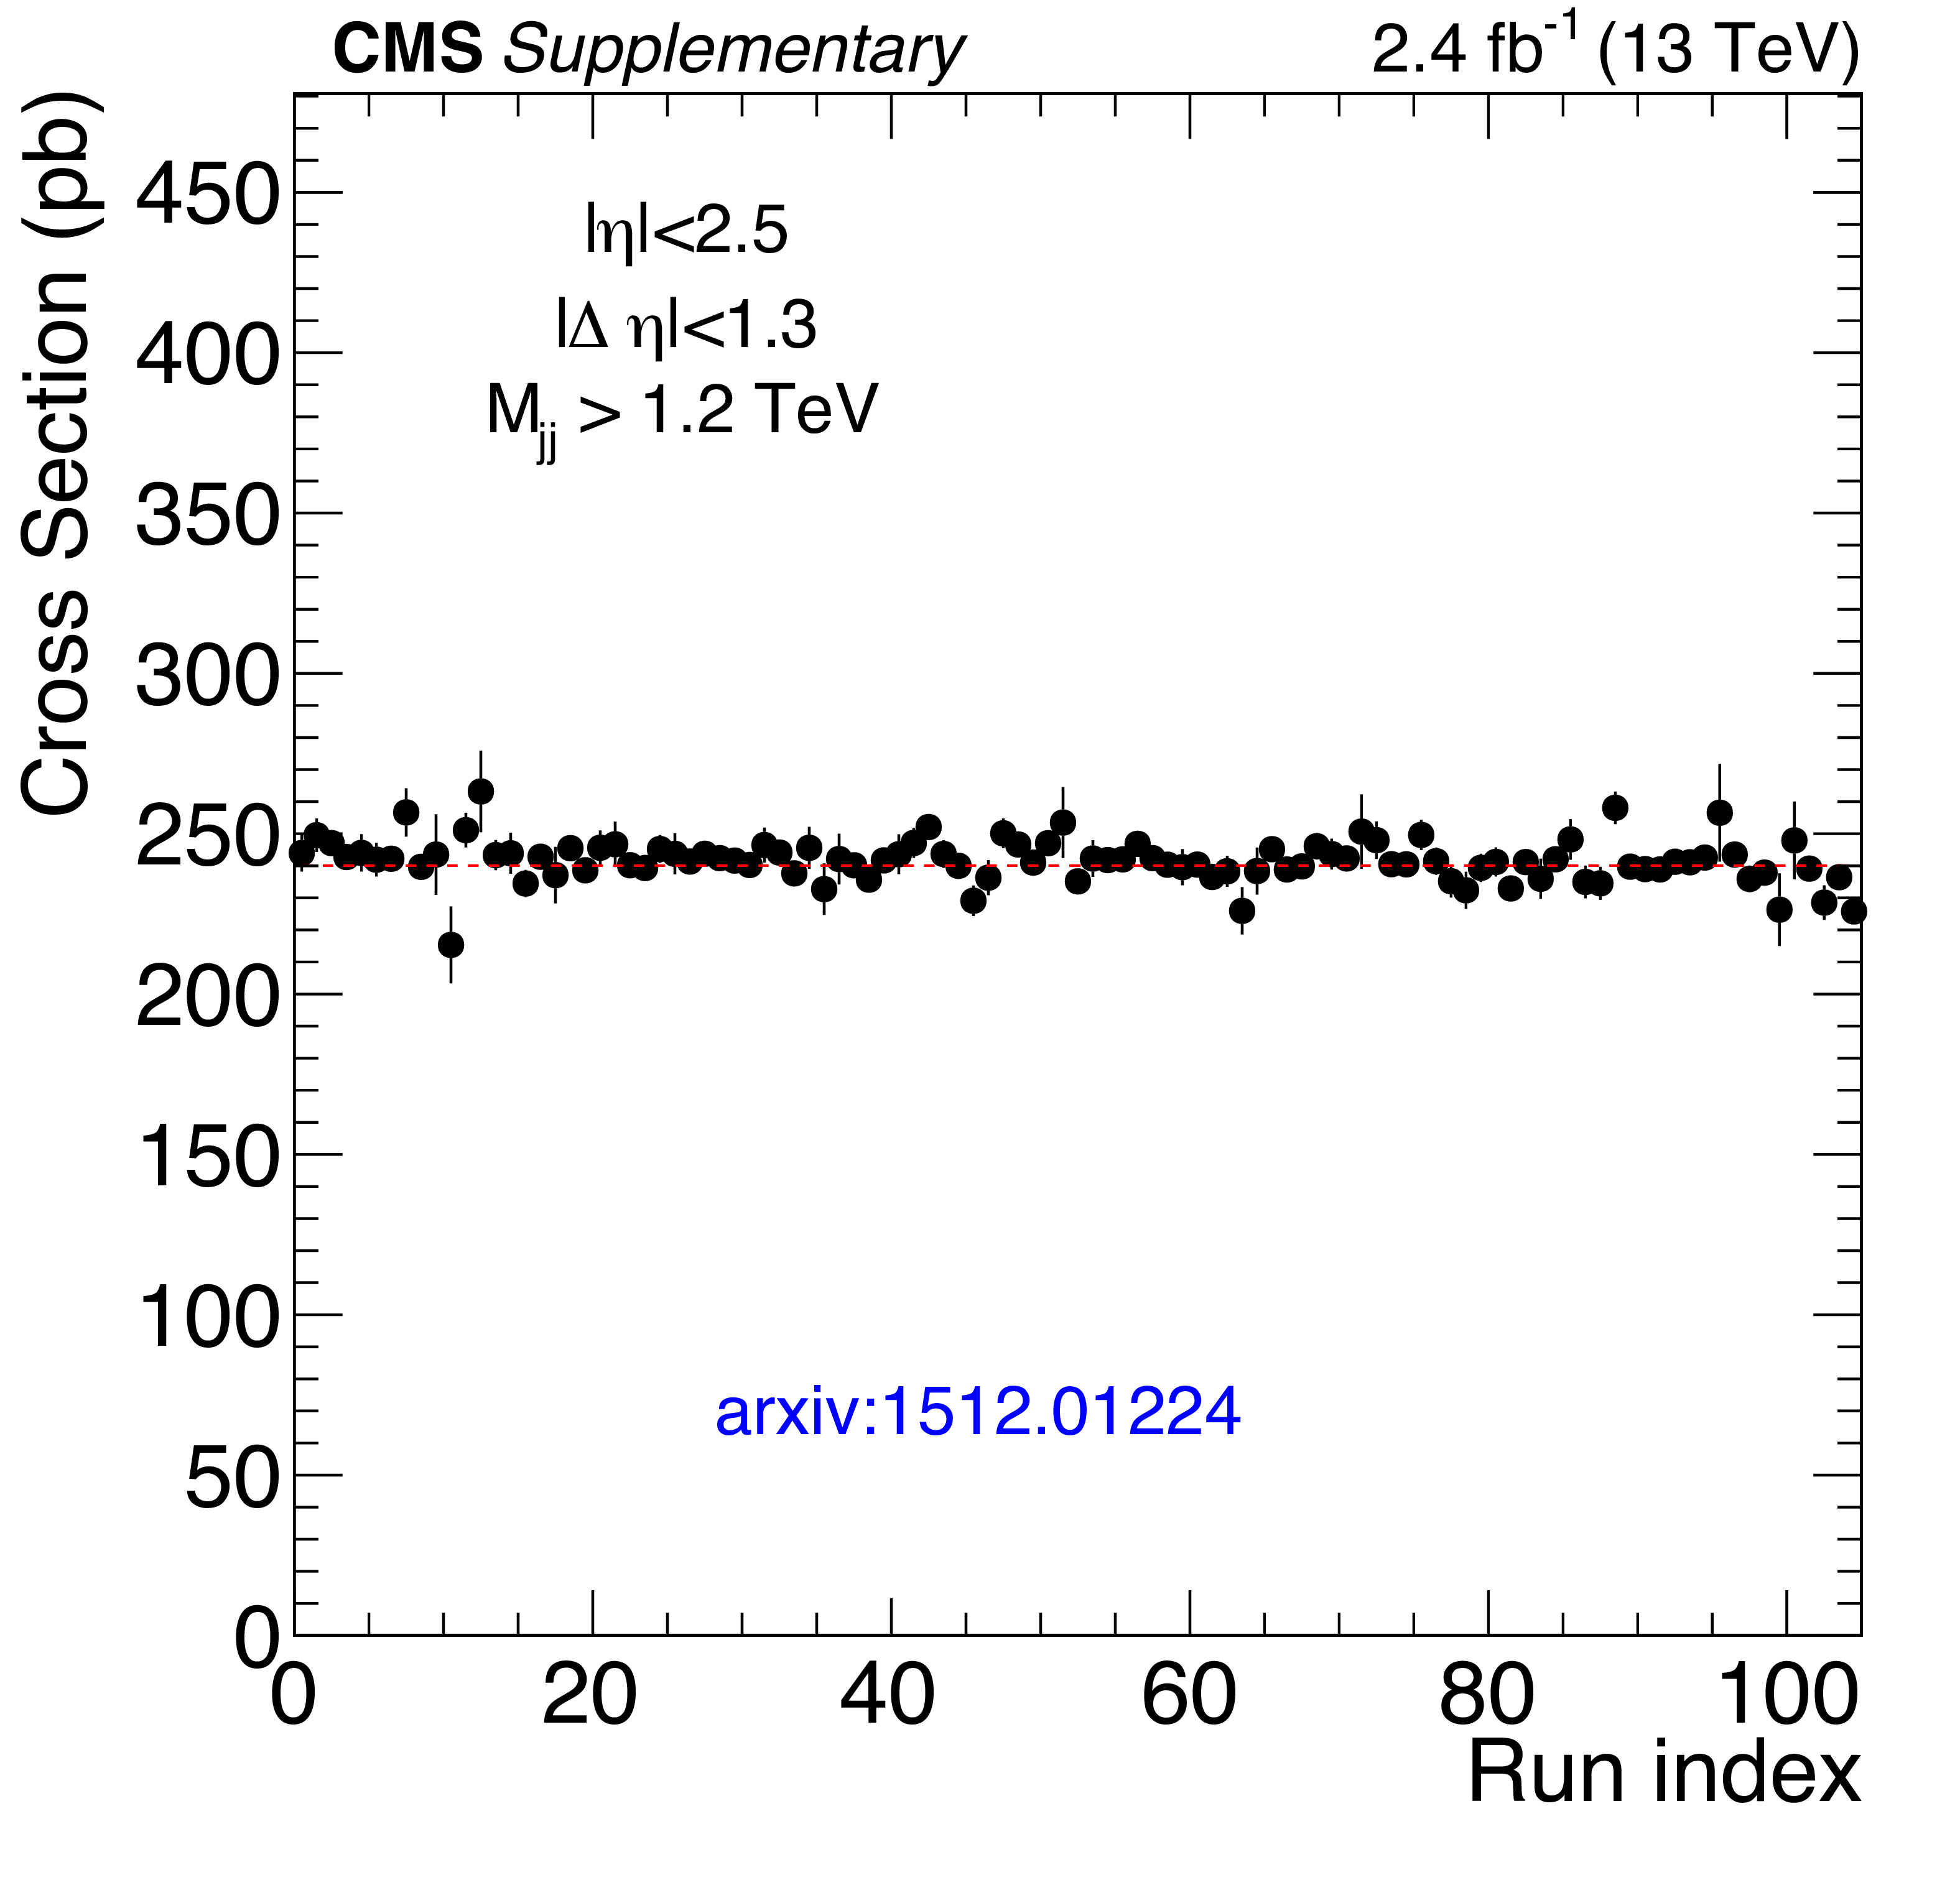
Additional Figure 7:
Measured cross section for the full selection criteria of the dijet analysis $ { {| \Delta \eta _{\text {jj}} | }} < $ 1.3, $|\eta |< $ 2.5, and $ {m_{\text {jj}}} > $ 1.2 TeV as a function of time (increasing run index). The data analyzed in these data-taking runs were collected during the period from July to November 2015. The horizontal red dashed line is the average cross section. |
png pdf |
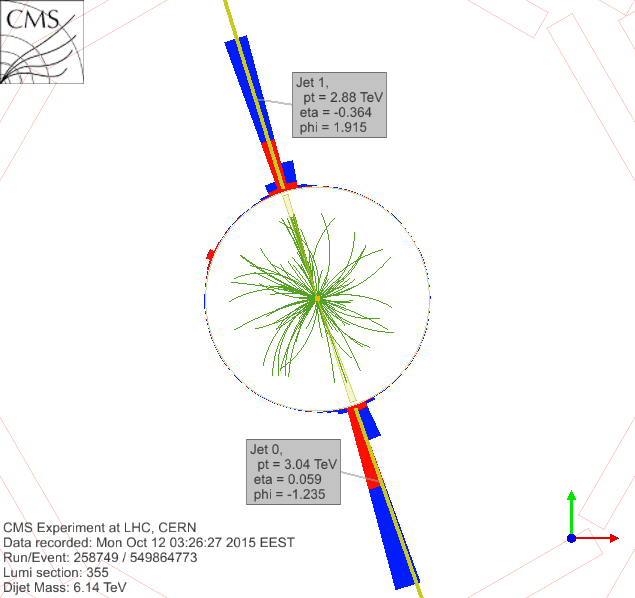
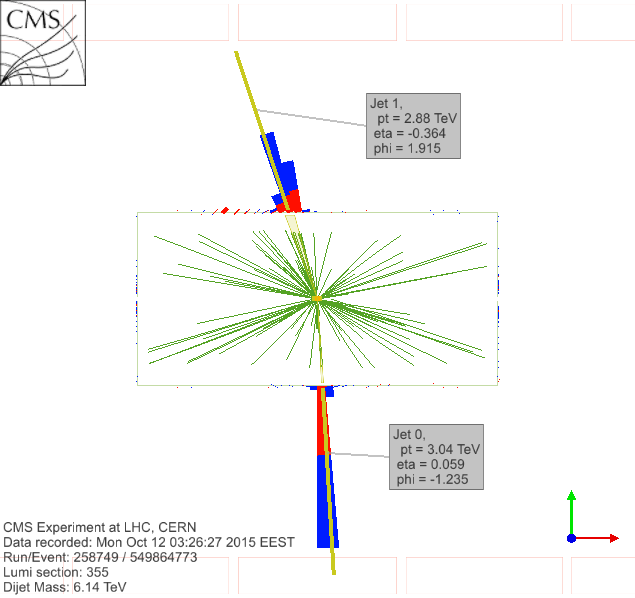
Additional Figure 8:
Display of the event with the highest dijet mass (6.14 TeV) after the full selection. The transverse view with respect to the beam axis is shown. The kinematic quantities of the two wide jets are reported. |
png pdf |
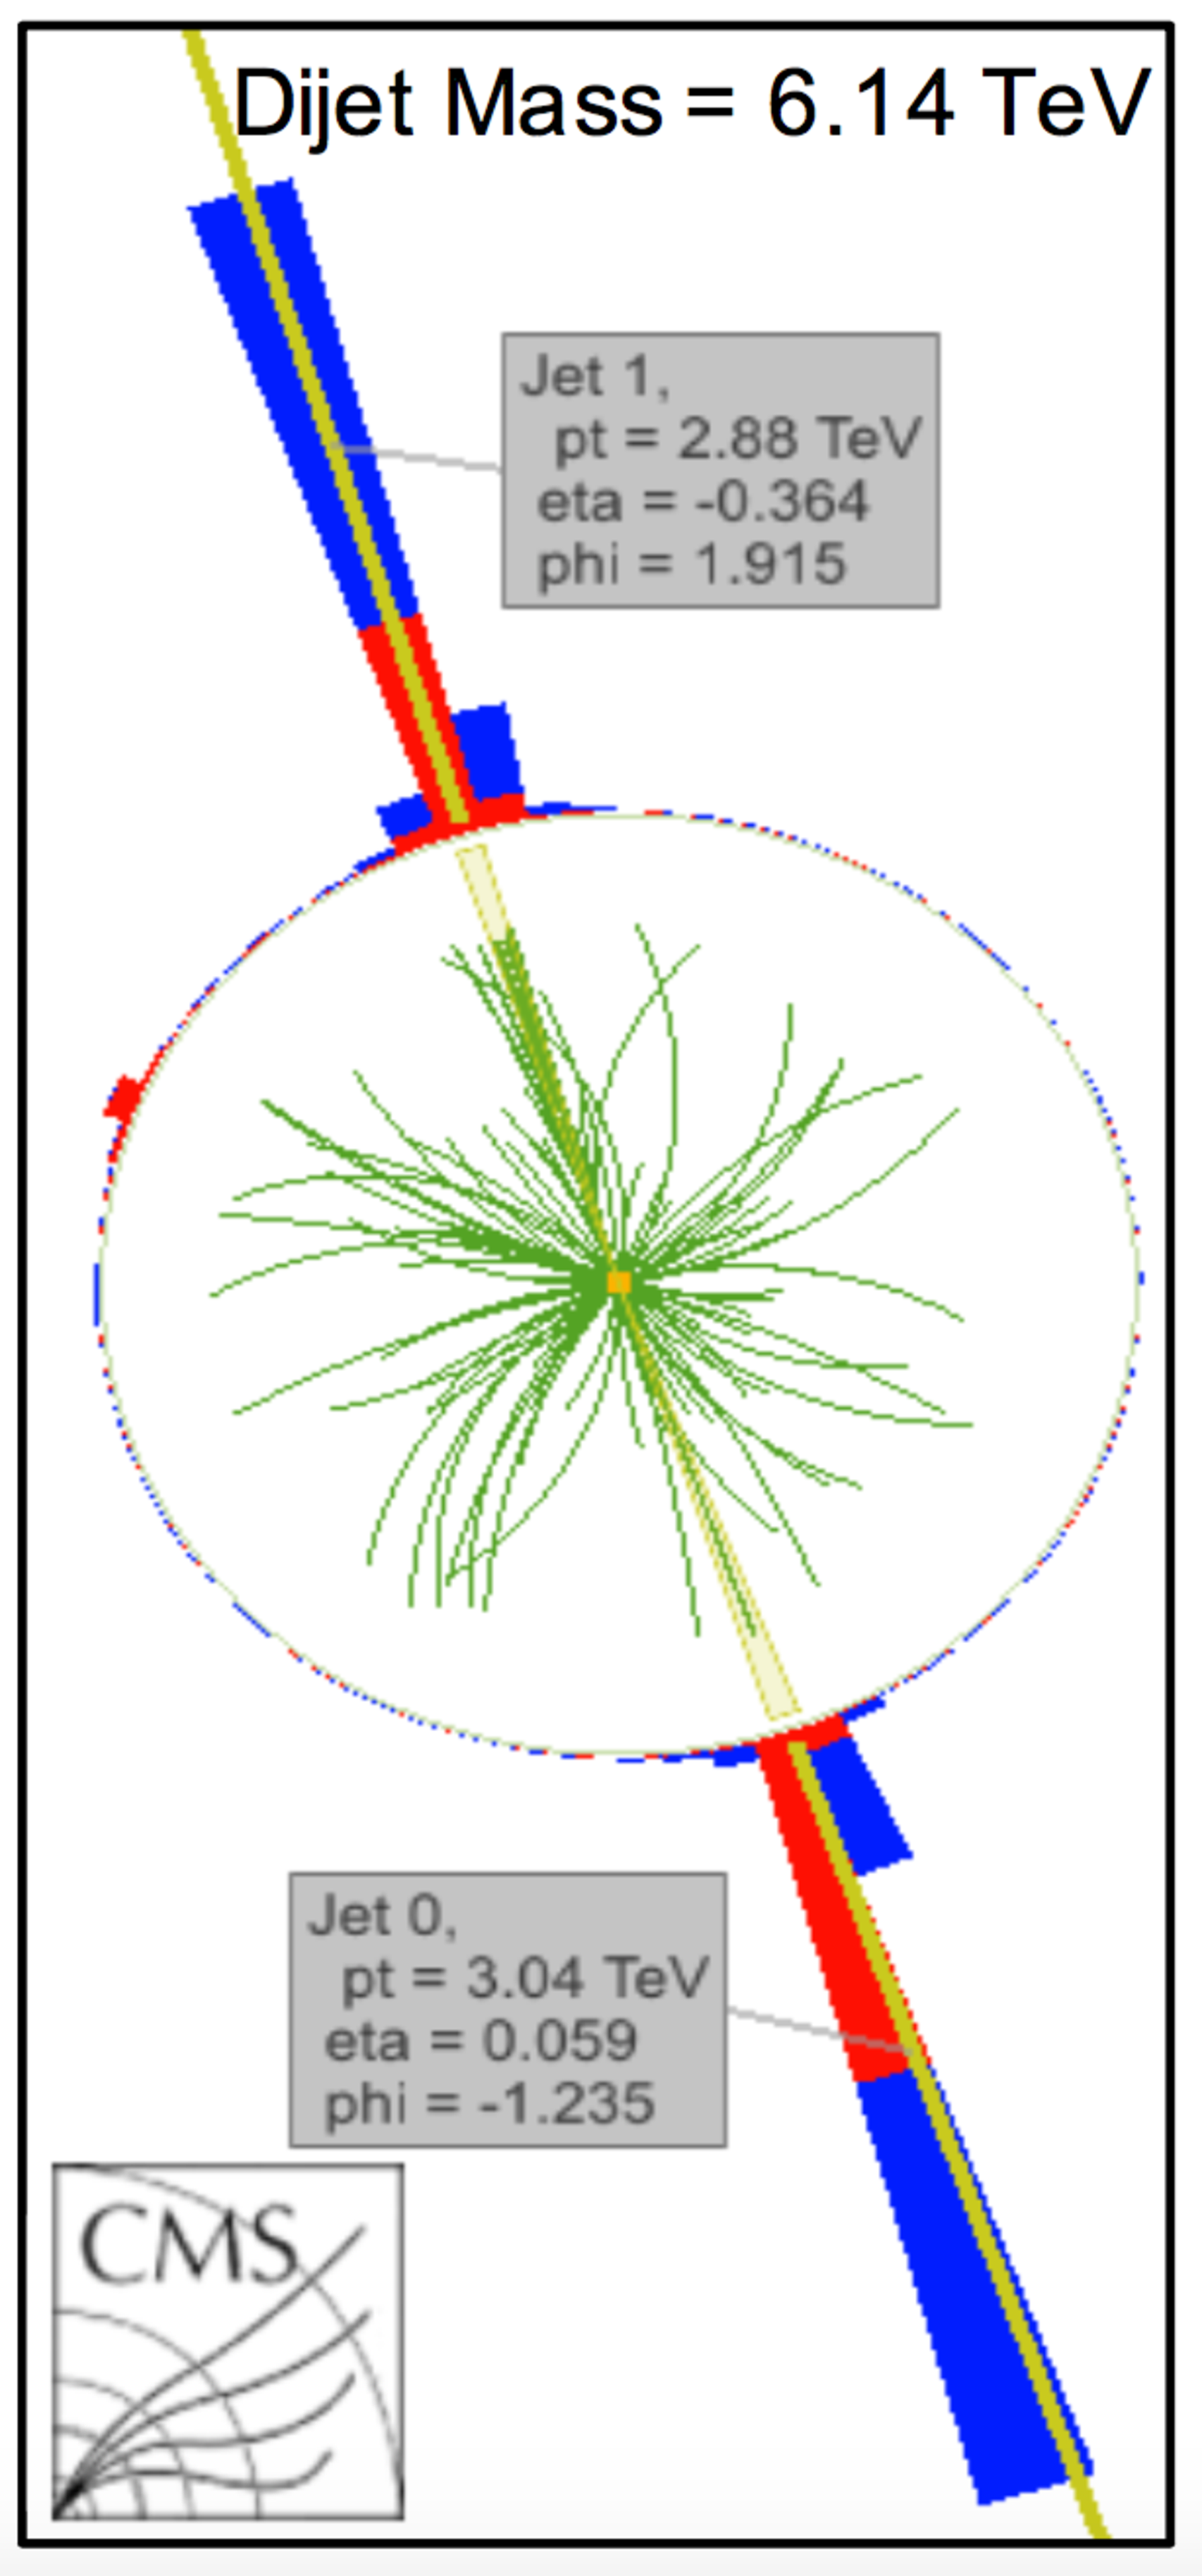
Additional Figure 9:
Reduced version - Display of the event with the highest dijet mass (6.14 TeV) after the full selection. The transverse view with respect to the beam axis is shown. The kinematic quantities of the two wide jets are reported. |
png pdf |
Additional Figure 10:
Display of the event with the highest dijet mass (6.14 TeV) after the full selection. The longitudinal view with respect to the beam axis is shown. The kinematic quantities of the two wide jets are reported. |
png pdf |
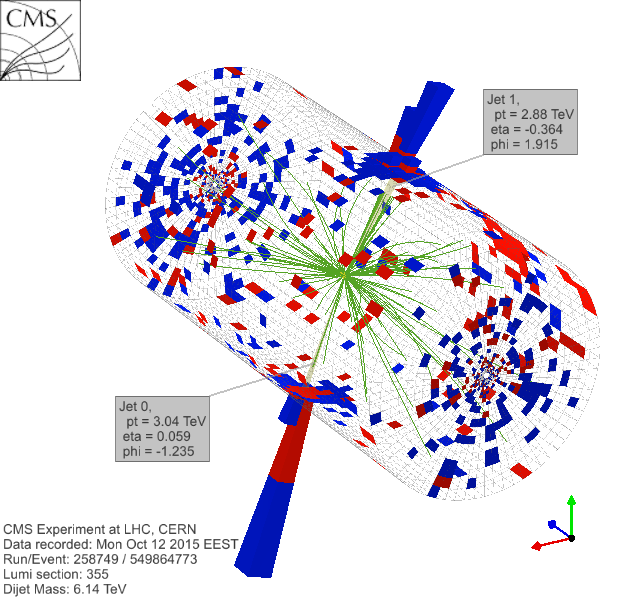
Additional Figure 11:
Display of the event with the highest dijet mass (6.14 TeV) after the full selection. The 3-dimensional view is shown. The kinematic quantities of the two wide jets are reported. |
png pdf |
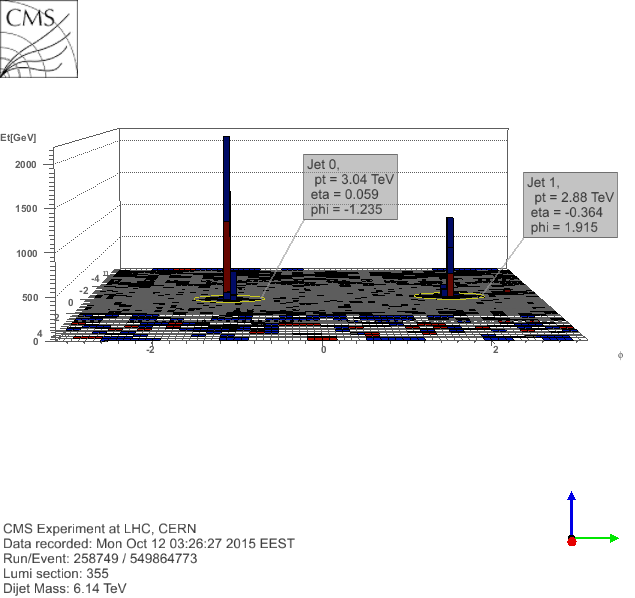
Additional Figure 12:
Display of the event with the highest dijet mass (6.14 TeV) after the full selection. The view reporting calorimeter tower energies in the $\eta $-$\phi $ plane ({\it lego}-view) is shown. The kinematic quantities of the two wide jets are reported. |

png pdf |
Additional Figure 13:
Observed 95%CL lower limits on resonance mass for the listed models obtained by the CMS experiment in Run 1 (green) and Run 2 (red) analyses. The Run 1 limits are derived from CMS searches at $\sqrt {s}= $ 8 TeV [1,2]. [1] ''Search for resonances decaying to dijet final states at $\sqrt {s}= $ 8 TeV with scouting data'', CMS Physics Analysis Summary CMS-PAS-EXO-14-005 (2015) [2] ``Search for resonances and quantum black holes using dijet mass spectra in proton-proton collisions at $\sqrt {s} =$ 8 TeV '' , Phys. Rev. D 91 (2015), doi:10.1103/PhysRevD.91.052009 |
| Additional Tables | |
png pdf |
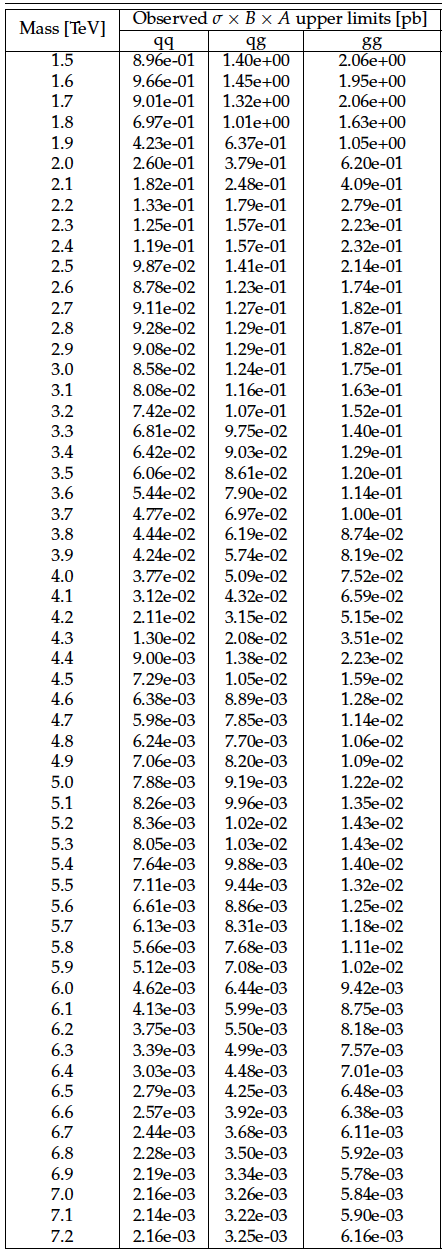
Additional Table 1:
Observed upper limits on $\sigma \times B \times A$, i.e., the product of the cross section ($\sigma $), the branching fraction ($B$), and the acceptance ($A$), for the kinematic requirements $ { {| \Delta \eta _{\text {jj}} | }} <$ 1.3 and $ {| \eta | } < $ 2.5, as a function of the resonance mass for quark-quark (qq), quark-gluon (qg), and gluon-gluon (gg) resonance types. |
|
|
Compact Muon Solenoid LHC, CERN |
|

|

|

|

|

|