Inclusive low mass Drell-Yan production in the forward region at $\sqrt{s}$ = 7 TeV
[to restricted-access page]Abstract
This note presents the measurement of the Drell-Yan cross-section in dimuon final states for muons within pseudorapidities of 2 to 4.5, in the mass range $5<M_{\mu\mu}<120$ $ {\mathrm{ Ge V /}c^2}$ . The muons are required to have a momentum larger than $10$ $ {\mathrm{ Ge V /}c}$ and a transverse momentum larger that $3$ $ {\mathrm{ Ge V /}c}$ . For masses above $40$ $ {\mathrm{ Ge V /}c^2}$ the transverse momentum needs to be larger than $15$ $ {\mathrm{ Ge V /}c}$ . The cross section is measured differentially, in mass, and in rapidity of the virtual photon ($\gamma^\star$) in two distinct mass regions. The analysis uses the full dataset collected by the LHCb experiment during 2010 with an integrated luminosity of $37$ $ pb^{-1}$ .
Figures and captions
|
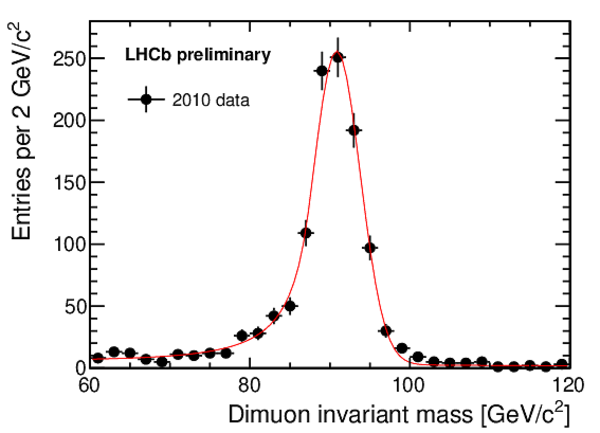
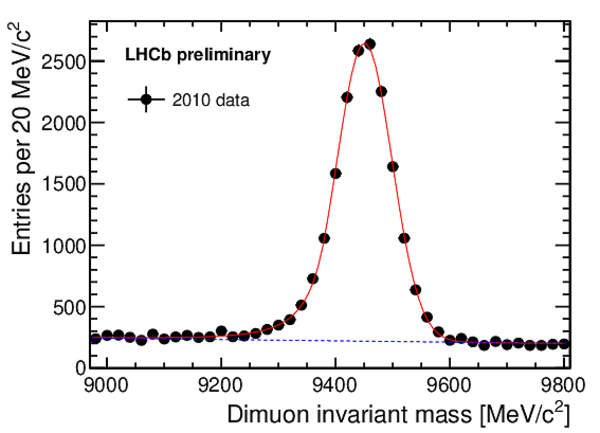
The top plots show the dimuon invariant mass for the $Z\rightarrow\mu\mu$ (left) and the $\Upsilon$ (right) samples. The lower plots show the dimuon invariant mass for $ { J \mskip -3mu/\mskip -2mu\psi \mskip 2mu}$ (left) and the $ { J \mskip -3mu/\mskip -2mu\psi \mskip 2mu}K$ (right) samples used to determine the muon identification and tracking efficiencies. A Crystal Ball function for the signal and an exponential for the background are fitted to all four distributions. |
ZMass.pdf [15 KiB] HiDef png [165 KiB] Thumbnail [143 KiB] *.C file |
|
|
Upsilo[..].pdf [17 KiB] HiDef png [195 KiB] Thumbnail [168 KiB] *.C file |
|
|
|
JpsiMa[..].pdf [16 KiB] HiDef png [196 KiB] Thumbnail [175 KiB] *.C file |

|
|
|
JpsiMa[..].pdf [16 KiB] HiDef png [182 KiB] Thumbnail [166 KiB] *.C file |
|
|
|
Misidentification probability for muons due to decay in flight as a function of the longitudinal momentum together with the fit for the misidentification probability. |
MuonMi[..].pdf [14 KiB] HiDef png [114 KiB] Thumbnail [65 KiB] *.C file |

|
|
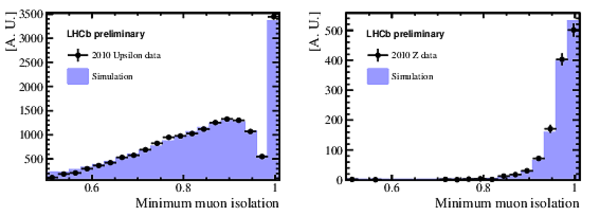
Comparison of data and simulation of the distribution of the minimum isolation for muons from $\Upsilon\rightarrow\mu\mu$ (left) and $Z\rightarrow\mu\mu$ (right) decays. |
MCdata[..].pdf [16 KiB] HiDef png [151 KiB] Thumbnail [121 KiB] *.C file |
|
|
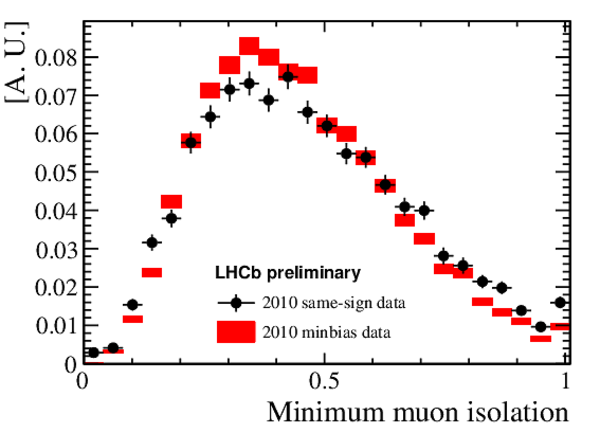
Comparison of data and simulation of the distribution of the minimum isolation for muons from the two heavy flavour templates (left) and the two templates for MisID (right). |
HF_tem[..].pdf [15 KiB] HiDef png [278 KiB] Thumbnail [144 KiB] *.C file |

|
|
ID_tem[..].pdf [15 KiB] HiDef png [266 KiB] Thumbnail [153 KiB] *.C file |
|
|
|
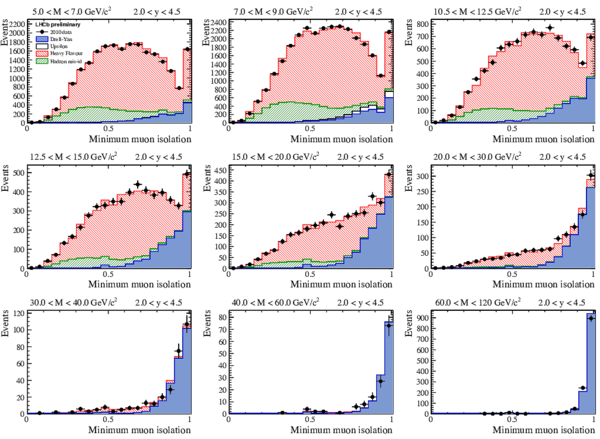
Template fit to the minimum muon isolation distribution for nine mass bins. The data (points) are compared to the fitted contributions from $\gamma^\star\rightarrow\mu\mu$ (blue) and backgrounds from heavy flavour decays (red) and muon misidentification(green). |
Mass.pdf [182 KiB] HiDef png [1 MiB] Thumbnail [467 KiB] *.C file |
|
|
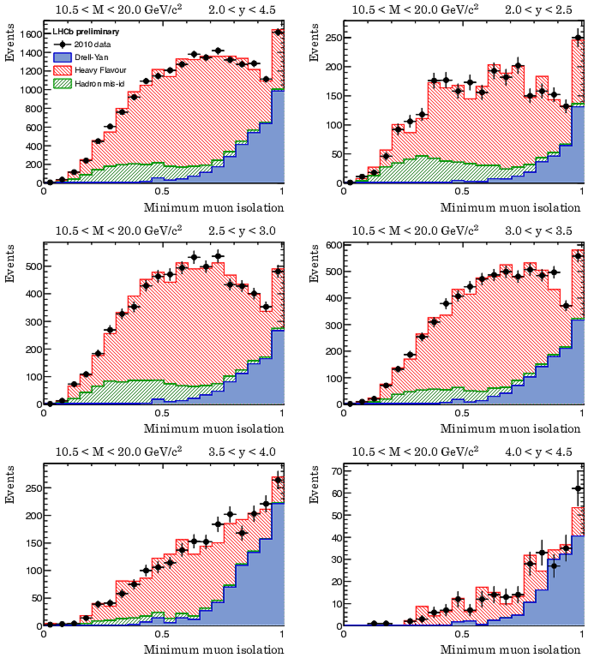
Template fit to the minimum muon isolation distribution for five rapidity bins and $10.5<M_{\mu\mu}<20$ $ {\mathrm{ Ge V /}c^2}$ . The first plot shows the fit for the full rapidity range. The data (points) are compared to the fitted contributions from $\gamma^\star\rightarrow\mu\mu$ (blue) and backgrounds from heavy flavour (red) decays and muon misidentification (green). |
Rap2.pdf [123 KiB] HiDef png [1 MiB] Thumbnail [472 KiB] *.C file |
|
|
Template fit to the minimum muon isolation distribution for five rapidity bins and $20<M_{\mu\mu}<40$ $ {\mathrm{ Ge V /}c^2}$ . The first plot shows the fit for the full rapidity range. The data (points) are compared to the fitted contributions from $\gamma^\star\rightarrow\mu\mu$ (blue) and backgrounds from heavy flavour (red) decays and muon misidentification (green). |
Rap3.pdf [125 KiB] HiDef png [591 KiB] Thumbnail [352 KiB] *.C file |

|
|
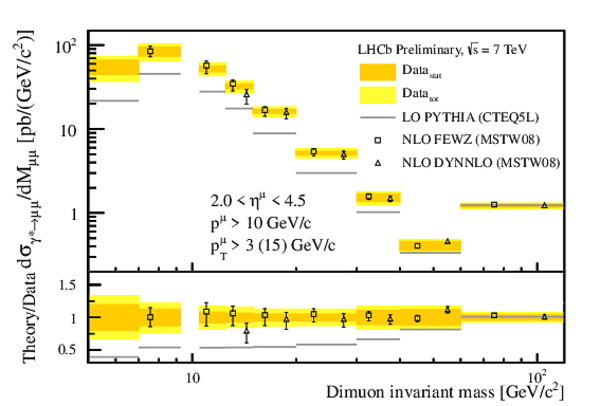
Differential cross-section for $\gamma^\star\rightarrow\mu\mu$ as a function of $M_{\mu\mu}$. The dark shaded (orange) bands correspond to the statistical uncertainties, the light shaded (yellow) band to the statistical and systematic uncertainties added in quadrature. Superimposed are the PYTHIA predictions and the NLO predictions from FEWZ and DYNNLO; they are displaced horizontally for presentation. The shaded vertical band corresponds to the mass region of the $\Upsilon$ which is not included in the measurement. The uncertainties of the NLO predictions contain the PDF uncertainties evaluated at the 68% confidence level and the theoretical errors added in quadrature. The two bins with $M_{\mu\mu}>40$ $ {\mathrm{ Ge V /}c}$ have a cut of $p^\mu_\mathrm{T}>15$ $ {\mathrm{ Ge V /}c}$ for the data and the predictions. The lower plot shows the ratio of the predictions or the uncertainties to the data. |
CSDYM1.pdf [17 KiB] HiDef png [345 KiB] Thumbnail [167 KiB] *.C file |
|
|
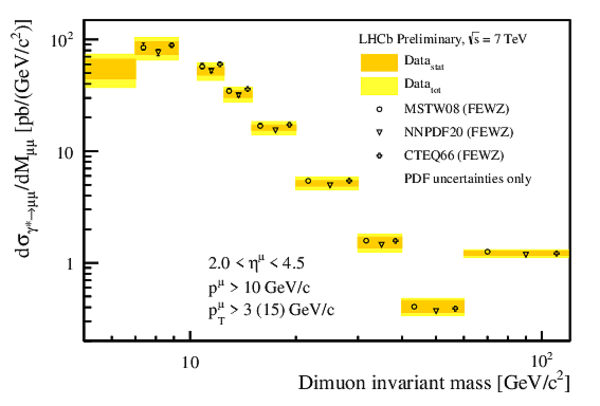
Differential cross-section for $\gamma^\star\rightarrow\mu\mu$ as a function of $M_{\mu\mu}$. The dark shaded (orange) bands correspond to the statistical uncertainties, the light shaded (yellow) band to the statistical and systematic uncertainties added in quadrature. Superimposed are NLO predictions from FEWZ with the PDF sets from MSTW08, NNPDF and CTEQ; they are displaced horizontally for presentation. The NLO uncertainties correspond to the PDF uncertainties evaluated at the 68% confidence level. The two bins with $M_{\mu\mu}>40$ $ {\mathrm{ Ge V /}c}$ have a cut of $p^\mu_\mathrm{T}>15$ $ {\mathrm{ Ge V /}c}$ for the data and the predictions. |
CSDYM2.pdf [15 KiB] HiDef png [271 KiB] Thumbnail [138 KiB] *.C file |
|
|
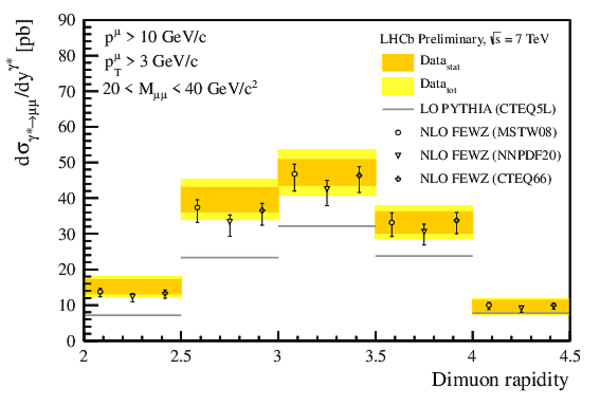
Differential cross-section for $\gamma^\star\rightarrow\mu\mu$ as a function of $y$ for two different mass regions of the dimuon system. The dark shaded (orange) bands correspond to the statistical uncertainties, the light shaded (yellow) band to the statistical and systematic uncertainties added in quadrature. The shaded vertical band corresponds to the mass region of the $\Upsilon$ which is not included in the measurement. Superimposed are NLO predictions from FEWZ with the PDF sets from MSTW08, NNPDF and CTEQ; they are displaced horizontally for presentation. The NLO uncertainties correspond to the PDF uncertainties evaluated at the 68% confidence level. |
CSDYE2.pdf [15 KiB] HiDef png [276 KiB] Thumbnail [159 KiB] *.C file |

|
|
CSDYE3.pdf [15 KiB] HiDef png [250 KiB] Thumbnail [154 KiB] *.C file |
|
|
|
Animated gif made out of all figures. |
CONF-2012-013.gif Thumbnail |

|
![HiDef png [165 KiB]](Directory_LHCb-CONF-2012-013/hidef_ZMass.png)
![HiDef png [195 KiB]](Directory_LHCb-CONF-2012-013/hidef_UpsilonMass.png)
![HiDef png [196 KiB]](Directory_LHCb-CONF-2012-013/hidef_JpsiMass_MuonID.png)
![HiDef png [182 KiB]](Directory_LHCb-CONF-2012-013/hidef_JpsiMass_Tracking.png)
![Thumbnail [166 KiB]](Directory_LHCb-CONF-2012-013/thumbnail_JpsiMass_Tracking.png)
![HiDef png [114 KiB]](Directory_LHCb-CONF-2012-013/hidef_MuonMisidRate2010.png)
![HiDef png [151 KiB]](Directory_LHCb-CONF-2012-013/hidef_MCdata_isoComparison.png)
![HiDef png [278 KiB]](Directory_LHCb-CONF-2012-013/hidef_HF_template_comp.png)
![HiDef png [266 KiB]](Directory_LHCb-CONF-2012-013/hidef_ID_template_comp.png)
![HiDef png [1 MiB]](Directory_LHCb-CONF-2012-013/hidef_Mass.png)
![HiDef png [1 MiB]](Directory_LHCb-CONF-2012-013/hidef_Rap2.png)
![HiDef png [591 KiB]](Directory_LHCb-CONF-2012-013/hidef_Rap3.png)
![HiDef png [345 KiB]](Directory_LHCb-CONF-2012-013/hidef_CSDYM1.png)
![HiDef png [271 KiB]](Directory_LHCb-CONF-2012-013/hidef_CSDYM2.png)
![HiDef png [276 KiB]](Directory_LHCb-CONF-2012-013/hidef_CSDYE2.png)
![HiDef png [250 KiB]](Directory_LHCb-CONF-2012-013/hidef_CSDYE3.png)
Tables and captions
|
Cross section in bins of the invariant mass of the muon pair. The two bins with $M_{\mu\mu}>40$ $ {\mathrm{ Ge V /}c}$ have a cut of $p^\mu_\mathrm{T}>15$ $ {\mathrm{ Ge V /}c}$ . |
Table_1.pdf [37 KiB] HiDef png [62 KiB] Thumbnail [29 KiB] tex code |

|
|
Cross section in bins of the rapidity of the dimuons for two different mass regions. |
Table_2.pdf [37 KiB] HiDef png [63 KiB] Thumbnail [29 KiB] tex code |

|
![HiDef png [62 KiB]](Directory_LHCb-CONF-2012-013/hidef_Table_1.png)
![HiDef png [63 KiB]](Directory_LHCb-CONF-2012-013/hidef_Table_2.png)
Created on 27 April 2024.