Studies of $\Lambda^0_{\mathrm{b}} \rightarrow \mathrm{J}/\psi \Lambda$ production in $pp$ collisions at $\sqrt{s}$ = 7 TeV
[to restricted-access page]Abstract
The $\Lambda ^0_ b \rightarrow { J \mskip -3mu/\mskip -2mu\psi \mskip 2mu} \Lambda $ production cross-section is measured with the LHCb detector in inelastic $pp$ collisions at a centre-of-mass energy of $\sqrt{s} = 7 \mathrm{ Te V} .$ Using 36.4 $ pb^{-1}$ of data recorded in 2010, the cross-section for the region with rapidity $2.2 <y< 4.5$ and transverse momentum $ p_{\rm T} < 13.0$ $ {\mathrm{ Ge V /}c}$ is found to be $\sigma(pp\rightarrow \Lambda ^0_ b X)\cal B ( \Lambda ^0_ b \rightarrow { J \mskip -3mu/\mskip -2mu\psi \mskip 2mu} \Lambda )=4.19\pm 0.61\mathrm{(stat)} \pm 0.37\mathrm{(syst)} \rm nb $ for the baryon and $\sigma(pp\rightarrow \overline{\Lambda} ^0_ b X)\cal B ( \overline{\Lambda} ^0_ b \rightarrow { J \mskip -3mu/\mskip -2mu\psi \mskip 2mu} \overline{\Lambda} )=2.63\pm0.48\mathrm{(stat)} \pm 0.27\mathrm{(syst)} \rm nb $ for the antibaryon decay.
Figures and captions
|
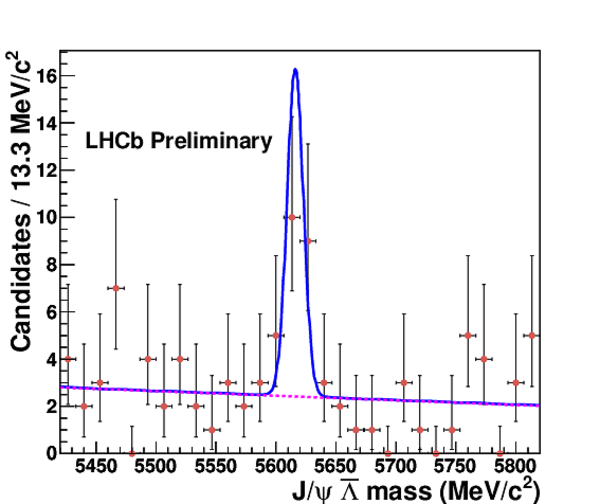
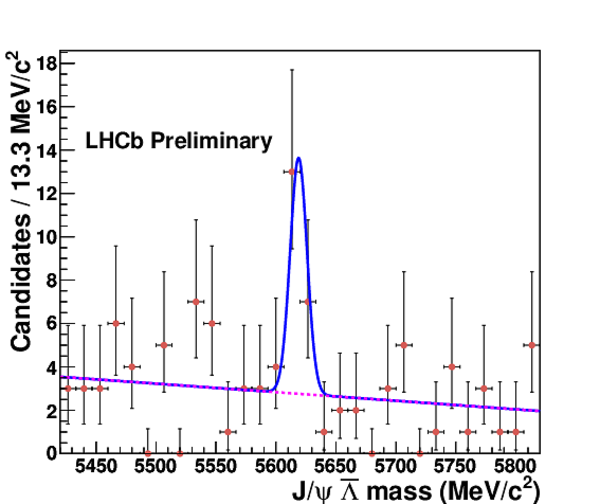
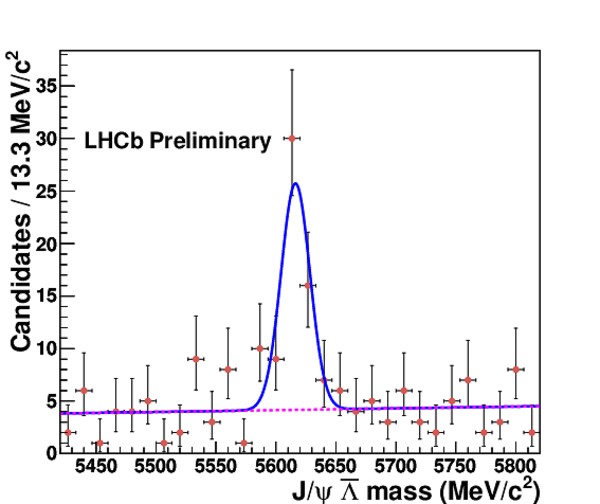
$\bar{\Lambda ^0_ b } \rightarrow { J \mskip -3mu/\mskip -2mu\psi \mskip 2mu} \overline{\Lambda} $ mass fit. Top: $\overline{\Lambda}$ is reconstructed using long tracks. Bottom: using the downstream tracks. The plots on the left and on the right used data recorded with different magnet polarities. |
Fig1a.pdf [16 KiB] HiDef png [230 KiB] Thumbnail [185 KiB] *.C file |
|
|
Fig1b.pdf [16 KiB] HiDef png [226 KiB] Thumbnail [183 KiB] *.C file |
|
|
|
Fig1c.pdf [16 KiB] HiDef png [218 KiB] Thumbnail [178 KiB] *.C file |

|
|
|
Fig1d.pdf [16 KiB] HiDef png [218 KiB] Thumbnail [184 KiB] *.C file |
|
|
|
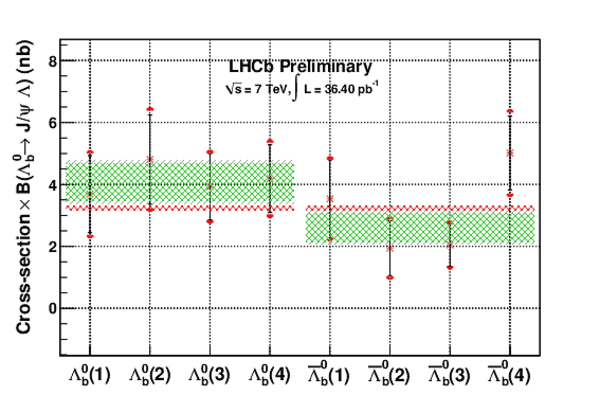
The measured $\sigma(pp\rightarrow \Lambda ^0_ b X)\cal B ( \Lambda ^0_ b \rightarrow { J \mskip -3mu/\mskip -2mu\psi \mskip 2mu} \Lambda )$ in $\rm nb$ for the eight samples. The black vertical bars represent the statistical error, the red limits represent the systematic uncertainty. The green horizontal band represents the average for the two species $\Lambda ^0_ b $ and $\overline{\Lambda} ^0_ b $ . The red horizontal line represent the predictions from the LHCb simulated sample. (1)&(2) stand for the measurement using $\Lambda ^0_ b $ reconstructed with $\Lambda$ daughters as long tracks using data recorded with different polarity of the magnetic field, while (3)&(4) stand for the case in which the $\Lambda$ daughters are reconstructed as downstream tracks. |
Fig2.pdf [14 KiB] HiDef png [430 KiB] Thumbnail [287 KiB] *.C file |
|
|
Animated gif made out of all figures. |
CONF-2012-031.gif Thumbnail |

|
![HiDef png [230 KiB]](Directory_LHCb-CONF-2012-031/hidef_Fig1a.png)
![HiDef png [226 KiB]](Directory_LHCb-CONF-2012-031/hidef_Fig1b.png)
![HiDef png [218 KiB]](Directory_LHCb-CONF-2012-031/hidef_Fig1c.png)
![HiDef png [218 KiB]](Directory_LHCb-CONF-2012-031/hidef_Fig1d.png)
![HiDef png [430 KiB]](Directory_LHCb-CONF-2012-031/hidef_Fig2.png)
Tables and captions
|
Requirements used to select first the $ { J \mskip -3mu/\mskip -2mu\psi \mskip 2mu}$ $\rightarrow$ $\mu ^+\mu ^-$ then the $\Lambda \rightarrow p \pi $ and finally the $\Lambda ^0_ b \rightarrow { J \mskip -3mu/\mskip -2mu\psi \mskip 2mu} \Lambda $ candidates. $M$ and $m$ are used to indicate the measured invariant masses and the nominal masses respectively. As the $\Lambda$ can be reconstructed from a pair of long tracks (LL) or downstream tracks (DD) different values are indicated where applied, $\tau$ is the decay time of the particle and IP$_{\chi^2}$ the difference in the $\chi^2$ of the primary vertex measured with and without the respective track. The $ K ^0_{\rm\scriptscriptstyle S}$ background is eliminated from the $\Lambda$ sample by applying a requirement on $|M_{\pi \pi }-m_{ K ^0_{\rm\scriptscriptstyle S} }|$. |
Table_1.pdf [80 KiB] HiDef png [84 KiB] Thumbnail [40 KiB] tex code |

|
|
Systematic uncertainties for the cross-section measurements in percent. Where the uncertainty is different for the eight sub-samples in which the candidates are divided, the smallest and the largest estimated values are are shown. The total systematic uncertainty is obtained assuming total correlation among the correlated variables. |
Table_2.pdf [20 KiB] HiDef png [168 KiB] Thumbnail [76 KiB] tex code |

|
![HiDef png [84 KiB]](Directory_LHCb-CONF-2012-031/hidef_Table_1.png)
![HiDef png [168 KiB]](Directory_LHCb-CONF-2012-031/hidef_Table_2.png)
Created on 26 April 2024.