Abstract
A first analysis of the data taken during the proton-lead pilot run is presented. The data sample corresponds to an integrated luminosity of $L_{\rm int}=0.93\pm 0.05 \mu$b$^{-1}$. A first measurement of the inelastic {\it p}{\rm Pb} cross-section at a nucleon-nucleon centre-of-mass energy $\sqrt{s_{NN}}=5.02$ TeV, with at least one charged particle in the region $2.5<\eta_{\rm CM}<4.5$\/ and $p_{\rm T}>0.2$ GeV/$c$, yields $\sigma_{\rm inel}=2.09\pm0.12$ b, where the uncertainty is purely systematic. Clean signals of strange and charm flavour production are observed. In {\it p}{\rm Pb} interactions the average multiplicity in the proton hemisphere is found to be about a factor two larger than in \it pp interactions when extrapolating to the same nucleon-nucleon centre-of-mass energy.
Figures and captions
|
Distribution of the $z_{\rm PV}$\/ positions of reconstructed primary vertices in {\it p}{\rm Pb} collisions without (left) and with (right) activated SMOG system. The distributions for only beam 1 (proton) and beam 2 (lead) are shown in red and blue, respectively. The magenta points are the weighted sums of the two, with weights adjusted to reproduce the integrals over the {\it p}{\rm Pb} distributions for $|z_{\rm PV}|>300$ mm. |
Fig1a.pdf [11 KiB] HiDef png [178 KiB] Thumbnail [114 KiB] *.C file |

|
|
Fig1b.pdf [12 KiB] HiDef png [155 KiB] Thumbnail [95 KiB] *.C file |

|
|
|
Distribution of the $z_{\rm PV}$\/ positions of reconstructed primary vertices in \it pp collisions (left) and comparison of the luminous region between \it pp and beam-gas-subtracted {\it p}{\rm Pb} interactions (right). For comparison the histograms are normalised to unit area. The background subtracted {\it p}{\rm Pb} data with SMOG are shown in red, the one without SMOG in blue. |
Fig2a.pdf [4 KiB] HiDef png [43 KiB] Thumbnail [21 KiB] *.C file |

|
|
Fig2b.pdf [8 KiB] HiDef png [123 KiB] Thumbnail [78 KiB] *.C file |

|
|
|
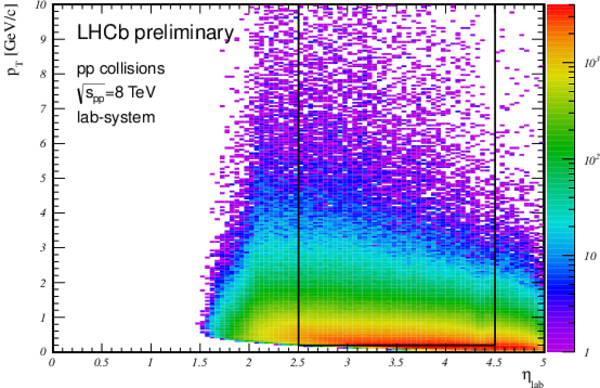
Transverse momentum versus pseudorapidity for charged particles originating from the luminous region. Distributions are shown for {\it p}{\rm Pb} interactions in the centre-of-mass system (left) and for \it pp collisions (right) in the laboratory frame, which is almost equivalent to the centre-of-mass frame. The boxes indicate the fiducial region used in the analysis. |
Fig3a.pdf [45 KiB] HiDef png [935 KiB] Thumbnail [587 KiB] *.C file |

|
|
Fig3b.pdf [47 KiB] HiDef png [982 KiB] Thumbnail [593 KiB] *.C file |
|
|
|
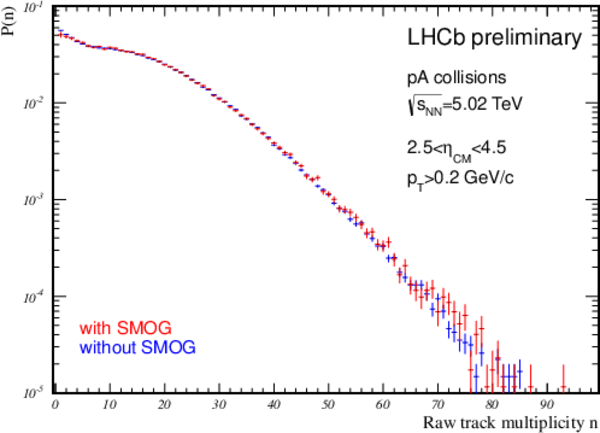
Probability distributions of uncorrected beam-gas subtracted track multiplicities in $2.5<\eta_{\rm CM}<4.5$\/ and $p_{\rm T}>0.2$ GeV/$c$. The probability $P(n)$\/ to observe $n\geq 1$\/ tracks within the fiducial cuts is shown as a function of $n$. The multiplicity distributions for data taken with (red) and without (blue) the SMOG system in operation show good agreement after beam-gas subtraction. |
Fig4.pdf [15 KiB] HiDef png [163 KiB] Thumbnail [106 KiB] *.C file |
|
|
Probability distributions of uncorrected beam-gas subtracted track multiplicities of \it pp (black) and {\it p}{\rm Pb} interactions (red and blue) in $2.5<\eta_{\rm CM}<4.5$\/ and $p_{\rm T}>0.2$ GeV/$c$. The probability $P(n)$\/ to observe $n$\/ tracks within the fiducial cuts is shown as a function of $n$. Only events with a single reconstructed primary vertex with at least five associated track segments contribute. The {\it p}{\rm Pb} distributions are shown for data taken with (red) and without (blue) the SMOG system in operation. |
Fig5.pdf [19 KiB] HiDef png [206 KiB] Thumbnail [132 KiB] *.C file |

|
|
Production of $K^0_S$-mesons in {\it p}{\rm Pb} collisions (left) and \it pp collisions (right). The points are the experimental data, the red line indicates the assumed background. |
Fig6a.pdf [10 KiB] HiDef png [177 KiB] Thumbnail [103 KiB] *.C file |

|
|
Fig6b.pdf [10 KiB] HiDef png [170 KiB] Thumbnail [99 KiB] *.C file |

|
|
|
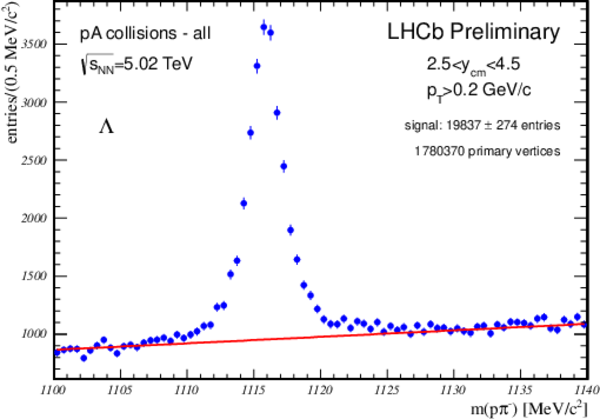
Production of $\Lambda$-hyperons in {\it p}{\rm Pb} collisions (left) and \it pp collisions (right). The points are the experimental data, the red line indicates the assumed background. |
Fig7a.pdf [11 KiB] HiDef png [173 KiB] Thumbnail [96 KiB] *.C file |
|
|
Fig7b.pdf [11 KiB] HiDef png [171 KiB] Thumbnail [94 KiB] *.C file |

|
|
|
Production of $\bar{\Lambda}$-hyperons in {\it p}{\rm Pb} collisions (left) and \it pp collisions (right). The points are the experimental data, the red line indicates the assumed background. |
Fig8a.pdf [11 KiB] HiDef png [175 KiB] Thumbnail [95 KiB] *.C file |

|
|
Fig8b.pdf [11 KiB] HiDef png [172 KiB] Thumbnail [94 KiB] *.C file |

|
|
|
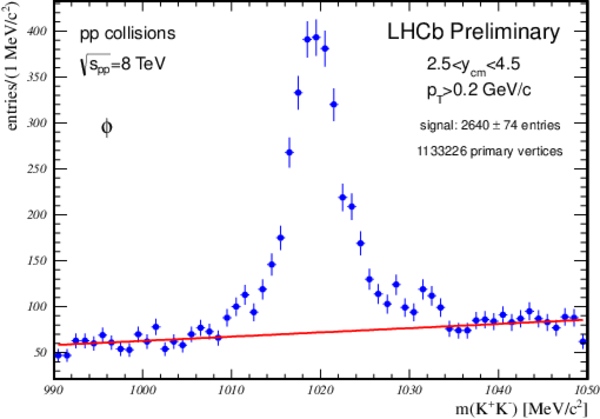
Production of $\phi$-mesons in {\it p}{\rm Pb} collisions (left) and \it pp collisions (right). The points are the experimental data, the red line indicates the assumed background. |
Fig9a.pdf [9 KiB] HiDef png [172 KiB] Thumbnail [98 KiB] *.C file |

|
|
Fig9b.pdf [9 KiB] HiDef png [173 KiB] Thumbnail [101 KiB] *.C file |
|
|
|
Production of $D^0$-mesons in {\it p}{\rm Pb} collisions (left) and \it pp collisions (right). The points are the experimental data, the red indicates the assumed background. Inclusion of charge conjugate modes is assumed. |
Fig10a.pdf [7 KiB] HiDef png [155 KiB] Thumbnail [88 KiB] *.C file |

|
|
Fig10b.pdf [6 KiB] HiDef png [154 KiB] Thumbnail [89 KiB] *.C file |

|
|
|
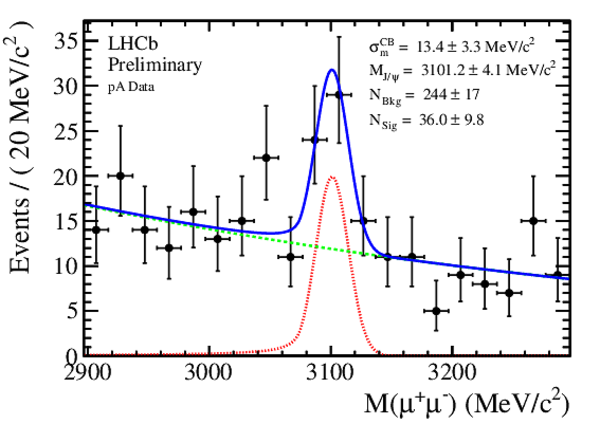
$J/\psi$-production in {\it p}{\rm Pb} collisions. The points are the experimental data, the green curve shows the assumed background, and the red curve the Crystal Ball function used to describe the signal. The sum of signal and background is given by the blue line. Also indicated are signal and background yields, $N_{\rm Sig}$\/ and $N_{\rm Bkg}$, the fitted mass $M_{J/\psi}$\/ of the signal and the width $\sigma_{\rm m}^{\rm CB}$\/ of the gaussian part of the Crystal ball function. |
Fig11.pdf [18 KiB] HiDef png [249 KiB] Thumbnail [219 KiB] *.C file |
|
|
Fixed target production of strange particles, $K^0_s$ (top, left) and $\phi$\/ (top, right), and $\Lambda$\/ (bottom, left) and $\bar{\Lambda}$\/ (bottom, right), in pNe collisions. The points are the experimental data, the red indicates the assumed background. |
Fig12a.pdf [11 KiB] HiDef png [157 KiB] Thumbnail [97 KiB] *.C file |

|
|
Fig12b.pdf [9 KiB] HiDef png [144 KiB] Thumbnail [81 KiB] *.C file |

|
|
|
Fig12c.pdf [11 KiB] HiDef png [150 KiB] Thumbnail [89 KiB] *.C file |

|
|
|
Fig12d.pdf [11 KiB] HiDef png [153 KiB] Thumbnail [87 KiB] *.C file |

|
|
|
Animated gif made out of all figures. |
CONF-2012-034.gif Thumbnail |

|
![HiDef png [178 KiB]](Directory_LHCb-CONF-2012-034/hidef_Fig1a.png)
![HiDef png [155 KiB]](Directory_LHCb-CONF-2012-034/hidef_Fig1b.png)
![HiDef png [43 KiB]](Directory_LHCb-CONF-2012-034/hidef_Fig2a.png)
![HiDef png [123 KiB]](Directory_LHCb-CONF-2012-034/hidef_Fig2b.png)
![HiDef png [935 KiB]](Directory_LHCb-CONF-2012-034/hidef_Fig3a.png)
![HiDef png [982 KiB]](Directory_LHCb-CONF-2012-034/hidef_Fig3b.png)
![HiDef png [163 KiB]](Directory_LHCb-CONF-2012-034/hidef_Fig4.png)
![HiDef png [206 KiB]](Directory_LHCb-CONF-2012-034/hidef_Fig5.png)
![HiDef png [177 KiB]](Directory_LHCb-CONF-2012-034/hidef_Fig6a.png)
![HiDef png [170 KiB]](Directory_LHCb-CONF-2012-034/hidef_Fig6b.png)
![HiDef png [173 KiB]](Directory_LHCb-CONF-2012-034/hidef_Fig7a.png)
![HiDef png [171 KiB]](Directory_LHCb-CONF-2012-034/hidef_Fig7b.png)
![HiDef png [175 KiB]](Directory_LHCb-CONF-2012-034/hidef_Fig8a.png)
![HiDef png [172 KiB]](Directory_LHCb-CONF-2012-034/hidef_Fig8b.png)
![HiDef png [172 KiB]](Directory_LHCb-CONF-2012-034/hidef_Fig9a.png)
![HiDef png [173 KiB]](Directory_LHCb-CONF-2012-034/hidef_Fig9b.png)
![HiDef png [155 KiB]](Directory_LHCb-CONF-2012-034/hidef_Fig10a.png)
![HiDef png [154 KiB]](Directory_LHCb-CONF-2012-034/hidef_Fig10b.png)
![HiDef png [249 KiB]](Directory_LHCb-CONF-2012-034/hidef_Fig11.png)
![HiDef png [157 KiB]](Directory_LHCb-CONF-2012-034/hidef_Fig12a.png)
![HiDef png [144 KiB]](Directory_LHCb-CONF-2012-034/hidef_Fig12b.png)
![HiDef png [150 KiB]](Directory_LHCb-CONF-2012-034/hidef_Fig12c.png)
![HiDef png [153 KiB]](Directory_LHCb-CONF-2012-034/hidef_Fig12d.png)
Created on 27 April 2024.