Abstract
A measurement of the cross section for the production of $b\bar{b}$ pairs based on $b$ inclusive final states is presented using LHCb data collected from $pp$ collisions at $\sqrt s$= 7 TeV in 2010, corresponding to an integrated luminosity of $\sim$18 pb$^{-1}$. The inclusive $b\bar{b}$ sample is selected on the basis of decay vertices displaced from the primary interaction. The measurement has been performed in a region of pseudorapidity 2.5 $<\eta<$ 4.0 and transverse momentum $p_{\rm T}$ $> 5$ GeV of the $b$ hadron candidate. The selected sample is a mixture of $b\bar{b}$ and $c\bar{c}$ events with a negligible contamination of light quarks, a measurement of the cross section for the production of $c\bar{c}$ can therefore be performed simultaneously. The results are $\sigma^{b\bar{b}} = 7.7\pm0.12 \rm{(stat)}\pm0.84 \rm{(syst)} \mu$b and $\sigma^{c\bar{c}} = 104.6\pm2.7 \rm{(stat)}\pm11.4 \rm{(syst)} \mu$b, inside the kinematic range defined above.
Figures and captions
|
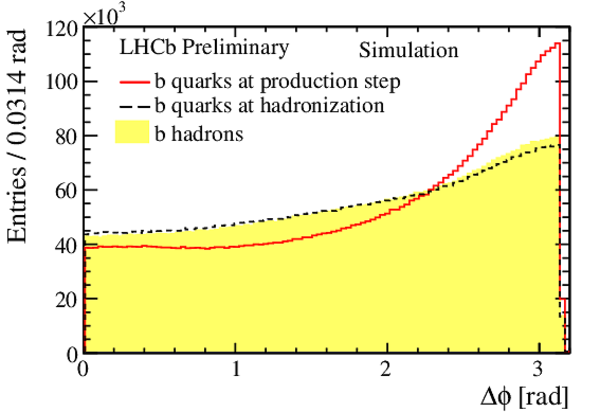
$\Delta\phi$ between the $b\bar{b}$ quark pairs: distributions are shown at the very first {\sc Pythia} production step (continuous red line) and at the last step before hadronization (dotted black line). The distribution for the $b$ hadron pairs is shown in the yellow filled histogram. |
Fig1.eps [11 KiB] HiDef png [191 KiB] Thumbnail [176 KiB] *.C file |
|
|
Difference in azimuthal angles of the two $b$ hadrons for {\sc Pythia} at the LO approximation (black line) and {\sc Powheg} at the NLO approximation (blue filled histogram) in the $b\bar{b}$-inclusive events. |
Fig2.eps [7 KiB] HiDef png [127 KiB] Thumbnail [116 KiB] *.C file |

|
|
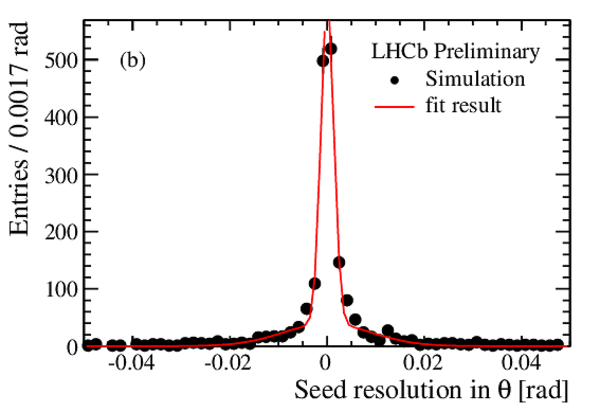
Resolution in (a) $\phi$ and (b) $\theta$ for the seed measured as described in the text for events with one $b$ hadron and one reconstructed seed. |
Fig3a.eps [9 KiB] HiDef png [174 KiB] Thumbnail [158 KiB] *.C file |

|
|
Fig3b.eps [9 KiB] HiDef png [179 KiB] Thumbnail [158 KiB] *.C file |
|
|
|
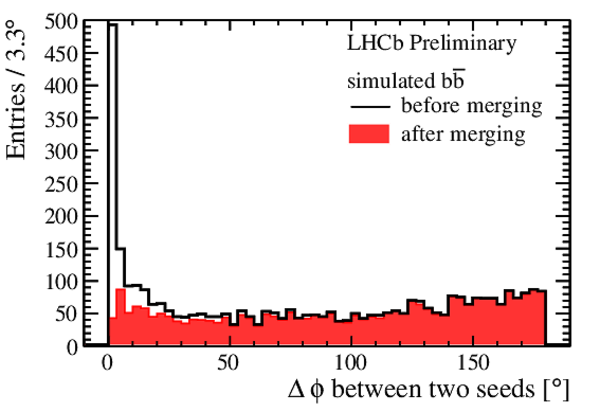
Distribution of $\Delta \phi$ of a seed pair before (black line) and after (red histogram) the merging procedure. |
Fig4.eps [14 KiB] HiDef png [169 KiB] Thumbnail [168 KiB] *.C file |
|
|
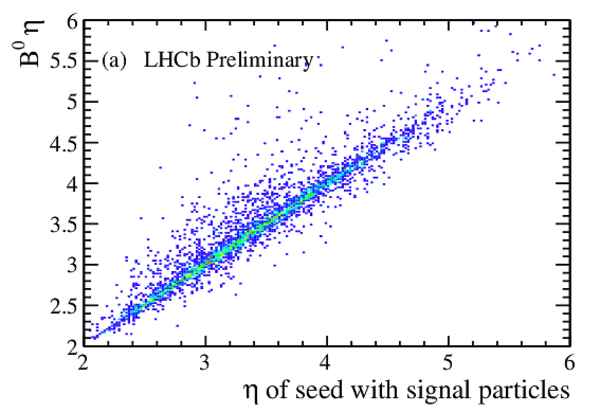
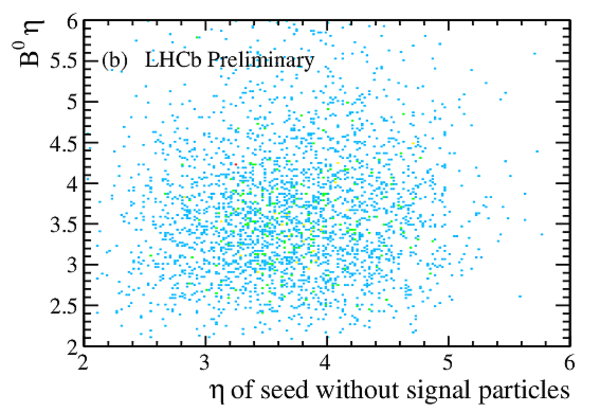
(a) Correlations in $\eta$ between the $B^{0} \rightarrow D^{-} \pi^{+}$ decay, and the seed reconstructed with the particles originating from the signal $B^{0}$. (b) Correlations in $\eta$ between the $B^{0} \rightarrow D^{-} \pi^{+}$ decay and the seed reconstructed without the particles originating from the signal $B^{0}$. |
Fig5a.eps [49 KiB] HiDef png [322 KiB] Thumbnail [205 KiB] *.C file |
|
|
Fig5b.eps [53 KiB] HiDef png [451 KiB] Thumbnail [313 KiB] *.C file |
|
|
|
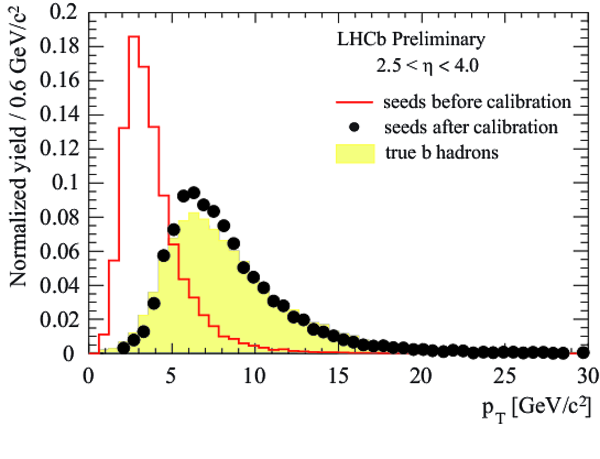
Comparison of the transverse momentum of the seed before and after calibration (red histogram and black points respectively), and with true $b$ hadrons (yellow filled histogram), in the fiducial region of the measurement. Distributions are normalized to unity. |
Fig6.eps [877 KiB] HiDef png [478 KiB] Thumbnail [191 KiB] *.C file |
|
|
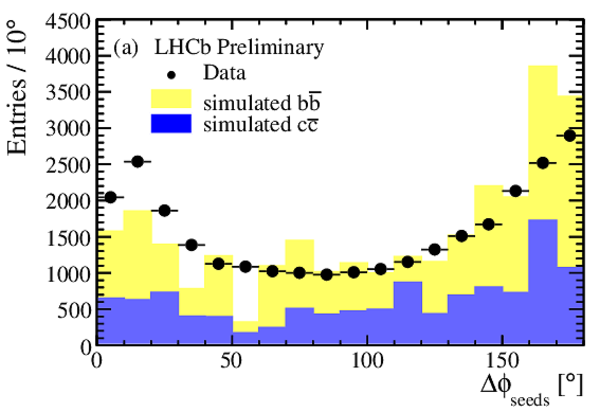
Distributions of (a) $\Delta\phi$ and (b) $p_{\rm T}$ of the seeds. Data (black dots), $b\bar{b}$ (yellow light histogram), $c\bar{c}$ (blue dark histogram). Expected contributions of $b\bar{b}$ and $c\bar{c}$ are subsequently added. |
Fig7a.eps [13 KiB] HiDef png [181 KiB] Thumbnail [174 KiB] *.C file |
|
|
Fig7b.eps [13 KiB] HiDef png [179 KiB] Thumbnail [171 KiB] *.C file |

|
|
|
Response of the BDTG (defined in the text) for data (black dots) fitted with shapes evaluated from simulated $b\bar{b}$ (red dotted line) and $c\bar{c}$ (green dashed line) events. The fit result is indicated by the solid blue line. |
Fig8.eps [888 KiB] HiDef png [533 KiB] Thumbnail [222 KiB] *.C file |

|
|
Animated gif made out of all figures. |
CONF-2013-002.gif Thumbnail |

|
![HiDef png [191 KiB]](Directory_LHCb-CONF-2013-002/hidef_Fig1.png)
![HiDef png [127 KiB]](Directory_LHCb-CONF-2013-002/hidef_Fig2.png)
![HiDef png [174 KiB]](Directory_LHCb-CONF-2013-002/hidef_Fig3a.png)
![HiDef png [179 KiB]](Directory_LHCb-CONF-2013-002/hidef_Fig3b.png)
![HiDef png [169 KiB]](Directory_LHCb-CONF-2013-002/hidef_Fig4.png)
![HiDef png [322 KiB]](Directory_LHCb-CONF-2013-002/hidef_Fig5a.png)
![HiDef png [451 KiB]](Directory_LHCb-CONF-2013-002/hidef_Fig5b.png)
![HiDef png [478 KiB]](Directory_LHCb-CONF-2013-002/hidef_Fig6.png)
![HiDef png [181 KiB]](Directory_LHCb-CONF-2013-002/hidef_Fig7a.png)
![HiDef png [179 KiB]](Directory_LHCb-CONF-2013-002/hidef_Fig7b.png)
![HiDef png [533 KiB]](Directory_LHCb-CONF-2013-002/hidef_Fig8.png)
Tables and captions
|
Requirements on the tracks to form two- or three-track seeds. |
Table_1.pdf [31 KiB] HiDef png [60 KiB] Thumbnail [28 KiB] tex code |

|
|
Requirements on the reconstructed secondary vertices of two or three tracks. The seed $p_{\rm T}$ is defined as the sum of the four-momenta of constituent tracks. DOCA indicates the distance of closest approach between two tracks. |
Table_2.pdf [40 KiB] HiDef png [39 KiB] Thumbnail [17 KiB] tex code |

|
|
Sources of systematic uncertainties. |
Table_3.pdf [31 KiB] HiDef png [87 KiB] Thumbnail [40 KiB] tex code |

|
![HiDef png [60 KiB]](Directory_LHCb-CONF-2013-002/hidef_Table_1.png)
![HiDef png [39 KiB]](Directory_LHCb-CONF-2013-002/hidef_Table_2.png)
![HiDef png [87 KiB]](Directory_LHCb-CONF-2013-002/hidef_Table_3.png)
Created on 27 April 2024.