Graphical comparison of the LHCb measurements of $W$ and $Z$ boson production with ATLAS and CMS
[to restricted-access page]Abstract
Differential production cross-sections for the $W$ boson as a function of the pseudorapidity of the lepton and for the $Z$ boson as a function of the rapidity of the $Z$ boson measured by LHCb are compared graphically to those measured by ATLAS and CMS. A similar comparison is made for the $W$ lepton charge asymmetry as a function of the lepton pseudorapidity for different thresholds on the transverse momentum of the lepton. Correction factors are calculated at next-to-leading order to account for differences in the definition of the fiducial volumes of the measurements. The comparison plots show good agreement between the ATLAS and LHCb results as well as the CMS and LHCb results in the overlapping kinematic regions.
Figures and captions
|
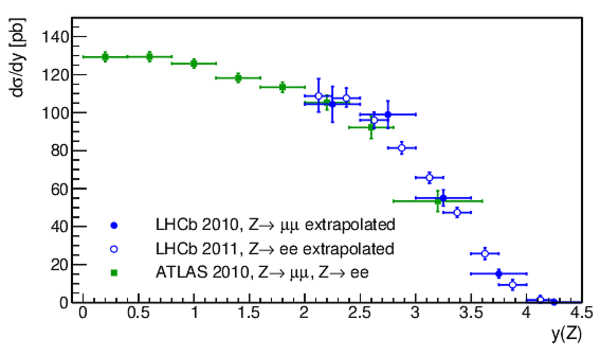
Differential production cross-section for $Z$ boson as a function of the rapidity of the $Z$ boson. The LHCb results in the muon and the electron channel are extrapolated to the fiducial volume of the ATLAS measurement ($66<M_\mathrm{ll}<116$ $ {\mathrm{ Ge V /}c^2}$ , $ p_\mathrm{T}^\mathrm{\ell}$ $>20$ $ {\mathrm{ Ge V /}c}$ ) which is shown in green. This plot is purely for illustrative purpose, the published LHCb results [1,2] should be used for all comparisons with theoretical predictions. |
Fig1.pdf [15 KiB] HiDef png [140 KiB] Thumbnail [120 KiB] *.C file |
|
|
Differential production cross-sections for $W^-$ and $W^+$ bosons as a function of the lepton pseudorapidity $\eta$. The LHCb results are extrapolated to the fiducial volume of the ATLAS measurement ( $ M_\mathrm{T}$ $>40$ $ {\mathrm{ Ge V /}c^2}$ , $ p_\mathrm{T}^\nu$ $>25$ $ {\mathrm{ Ge V /}c}$ ) which is shown in green. This plot is purely for illustrative purpose, the published LHCb results [1] should be used for all comparisons with theoretical predictions. |
Fig2.pdf [16 KiB] HiDef png [162 KiB] Thumbnail [134 KiB] *.C file |

|
|
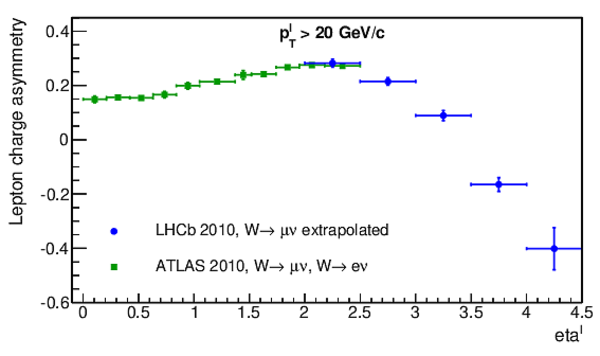
Lepton charge asymmetry as a function of the pseudorapidity of the lepton. The extrapolated LHCb result is shown in comparison to the result of ATLAS (top) for $ M_\mathrm{T}$ $>40$ $ {\mathrm{ Ge V /}c^2}$ . This plot is purely for illustrative purpose, the published LHCb results [1] should be used for all comparisons with theoretical predictions. |
Fig3.pdf [14 KiB] HiDef png [120 KiB] Thumbnail [107 KiB] *.C file |
|
|
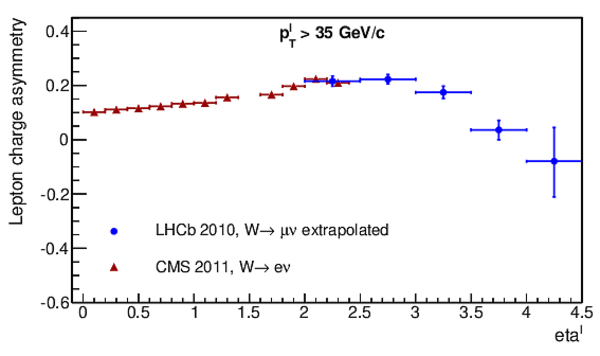
Lepton charge asymmetry as a function of the pseudorapidity of the lepton. The extrapolated LHCb result is shown in comparison to the CMS results with a $ p_\mathrm{T}^\mathrm{\ell}$ threshold of 35 $ {\mathrm{ Ge V /}c}$ . This plot is purely for illustrative purpose, the published LHCb results [1] should be used for all comparisons with theoretical predictions. |
Fig4.pdf [14 KiB] HiDef png [118 KiB] Thumbnail [103 KiB] *.C file |
|
|
Lepton charge asymmetry as a function of the pseudorapidity of the lepton. The measured LHCb result is shown in comparison to the CMS results for two different $ p_\mathrm{T}^\mathrm{\ell}$ thresholds. No extrapolation is applied here. |
Fig5.pdf [14 KiB] HiDef png [119 KiB] Thumbnail [102 KiB] *.C file |

|
|
Fig6.pdf [15 KiB] HiDef png [120 KiB] Thumbnail [103 KiB] *.C file |

|
|
|
Animated gif made out of all figures. |
CONF-2013-005.gif Thumbnail |

|
![HiDef png [140 KiB]](Directory_LHCb-CONF-2013-005/hidef_Fig1.png)
![HiDef png [162 KiB]](Directory_LHCb-CONF-2013-005/hidef_Fig2.png)
![HiDef png [120 KiB]](Directory_LHCb-CONF-2013-005/hidef_Fig3.png)
![HiDef png [118 KiB]](Directory_LHCb-CONF-2013-005/hidef_Fig4.png)
![HiDef png [119 KiB]](Directory_LHCb-CONF-2013-005/hidef_Fig5.png)
![HiDef png [120 KiB]](Directory_LHCb-CONF-2013-005/hidef_Fig6.png)
Tables and captions
|
Fiducial volumes for the measurements performed by LHCb, ATLAS and CMS. For the analysis of the $Z$ bosons the extrapolation factors include an extrapolation to the full $\eta$ range of the leptons. For the measurements of the $W$ bosons, no extrapolation in $\eta$ is performed. |
Table_1.pdf [58 KiB] HiDef png [63 KiB] Thumbnail [29 KiB] tex code |

|
![HiDef png [63 KiB]](Directory_LHCb-CONF-2013-005/hidef_Table_1.png)
Created on 27 April 2024.