Reference $pp$ cross-sections for $J/\psi$ studies in proton-lead collisions at $\sqrt{s_{NN}} = 5.02$ TeV and comparisons between ALICE and LHCb results
[to restricted-access page]Abstract
The ALICE and LHCb collaborations have studied $J/\psi$\/ production at forward rapidities in proton-lead collisions at $\sqrt{s}=5.02$ TeV using the dimuon channel. The evaluation of cold nuclear matter effects requires the knowledge of the corresponding $J/\psi$\/ cross-section in $ pp$ collisions at the same centre-of-mass energy and in the same kinematic range. In this note the interpolation procedure used to determine this quantity and the related consistency checks are described. Finally, the results from the two experiments on nuclear modification factors are shortly summarized and found to be in good agreement.
Figures and captions
|
Comparison of power-law (top left), linear (top right) and exponential (bottom) interpolations for the energy dependence of the $ { J \mskip -3mu/\mskip -2mu\psi \mskip 2mu} $\/ production cross-sections for the theoretical predictions given in Tab. 2. Ideally all curves should go through $\sigma(\sqrt{s}=5.02\mathrm{ Te V} )=5.3 {\rm \upmu b} $. |
checkPow.pdf [12 KiB] HiDef png [263 KiB] Thumbnail [134 KiB] *.C file |

|
|
checkLin.pdf [12 KiB] HiDef png [255 KiB] Thumbnail [130 KiB] *.C file |

|
|
|
checkExp.pdf [12 KiB] HiDef png [263 KiB] Thumbnail [136 KiB] *.C file |

|
|
|
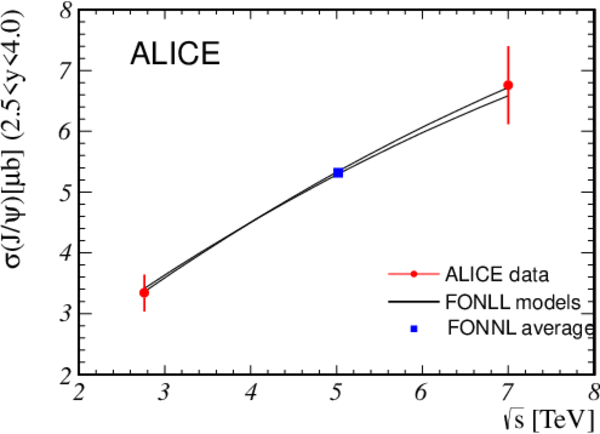
Cross-section interpolation for the ALICE data. The point at $\sqrt{s}=5.02$ TeV is the result of the interpolation procedure, the error bar shows the result from error propagation of the experimental uncertainties of the measurements at $\sqrt{s}=2.76$\/ and $7$ TeV. |
AliceInter.pdf [5 KiB] HiDef png [133 KiB] Thumbnail [83 KiB] *.C file |

|
|
Cross-section interpolation by fitting theoretical predictions to the ALICE data points. |
AliceCEM.pdf [5 KiB] HiDef png [159 KiB] Thumbnail [91 KiB] *.C file |

|
|
AliceFONLL.pdf [4 KiB] HiDef png [112 KiB] Thumbnail [70 KiB] *.C file |
|
|
|
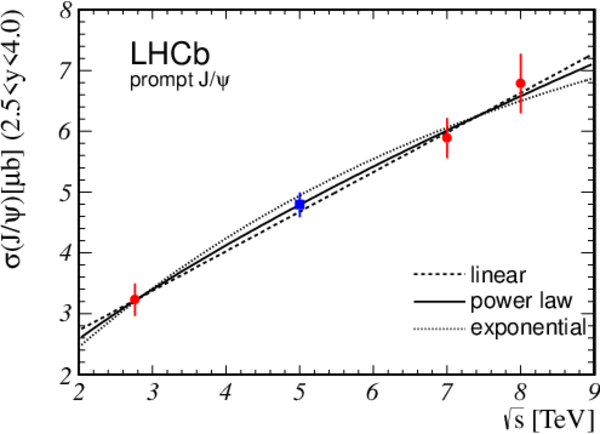
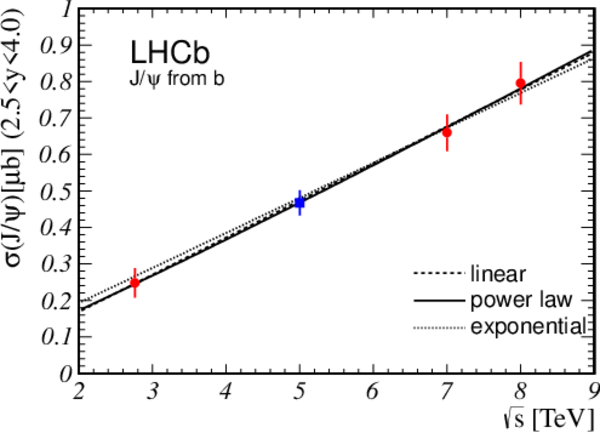
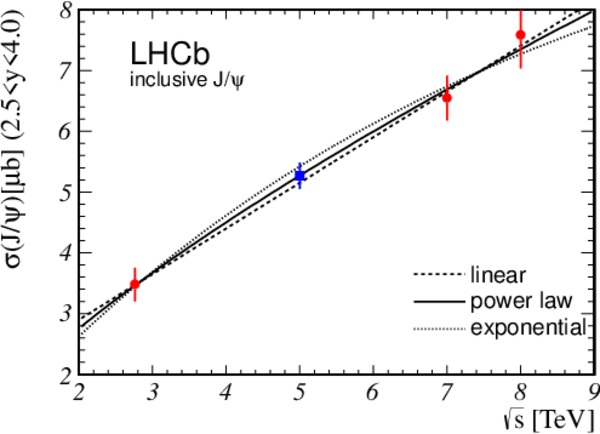
Cross-section interpolation for the LHCb data using three phenomenological models. The upper row shows the results for prompt $ { J \mskip -3mu/\mskip -2mu\psi \mskip 2mu} $ production (top left) and for $ { J \mskip -3mu/\mskip -2mu\psi \mskip 2mu} $ mesons from $b$-hadron decays (top right). The bottom row plot shows the interpolation for inclusive $ { J \mskip -3mu/\mskip -2mu\psi \mskip 2mu} $ production. The points at $\sqrt{s}=5.02$ TeV are the nominal results of the interpolation procedure, the error bar is the result from error propagation of the experimental uncertainties of the measurements at $\sqrt{s}=2.76$, $7$\/ and $8$ TeV. |
LHCbjpsip.pdf [5 KiB] HiDef png [141 KiB] Thumbnail [89 KiB] *.C file |
|
|
LHCbjpsib.pdf [6 KiB] HiDef png [150 KiB] Thumbnail [95 KiB] *.C file |
|
|
|
LHCbjpsii.pdf [5 KiB] HiDef png [142 KiB] Thumbnail [90 KiB] *.C file |
|
|
|
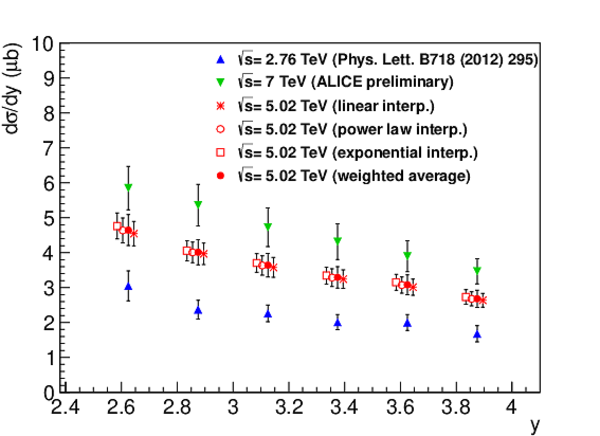
Differential cross-sections $\mathrm{d}\sigma/\mathrm{d} y$\/ at $\sqrt{s}=2.76$\/ and $7\mathrm{ Te V} $, as measured by ALICE. On the left hand plot the calculated values at $\sqrt{s}=5.02\mathrm{ Te V} $\/ are separately shown for each interpolation function (linear, power law and exponential), together with their weighted average. The right hand figure shows fits to the interpolated $\mathrm{d}\sigma/\mathrm{d} y$\/ values at $\sqrt{s}=5.02\mathrm{ Te V} $. See text for details. |
Interp[..].pdf [16 KiB] HiDef png [203 KiB] Thumbnail [185 KiB] *.C file |
|
|
Interp[..].pdf [27 KiB] HiDef png [326 KiB] Thumbnail [202 KiB] *.C file |

|
|
|
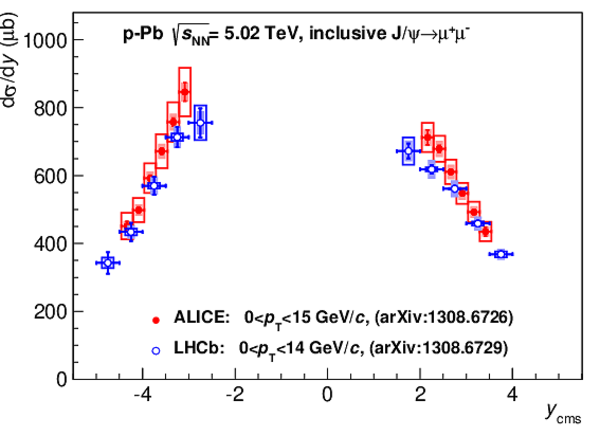
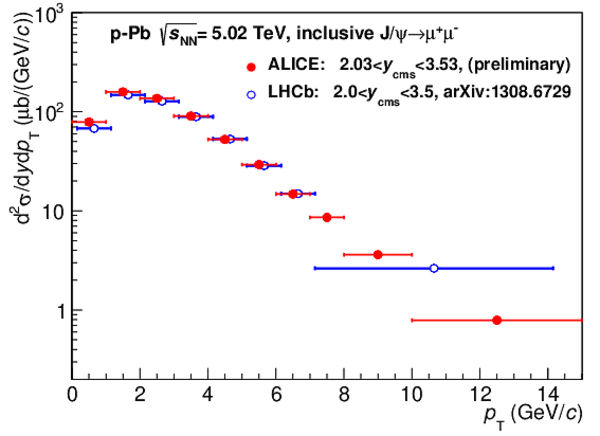
Differential cross-section for inclusive $ { J \mskip -3mu/\mskip -2mu\psi \mskip 2mu} $ production in $ p\mathrm{Pb}$ collisions as a function of rapidity $y$\/ (left) and transverse momentum $ p_{\rm T} $\/ (right). |
dsigma[..].pdf [17 KiB] HiDef png [182 KiB] Thumbnail [151 KiB] *.C file |
|
|
d2sigm[..].pdf [15 KiB] HiDef png [151 KiB] Thumbnail [139 KiB] *.C file |
|
|
|
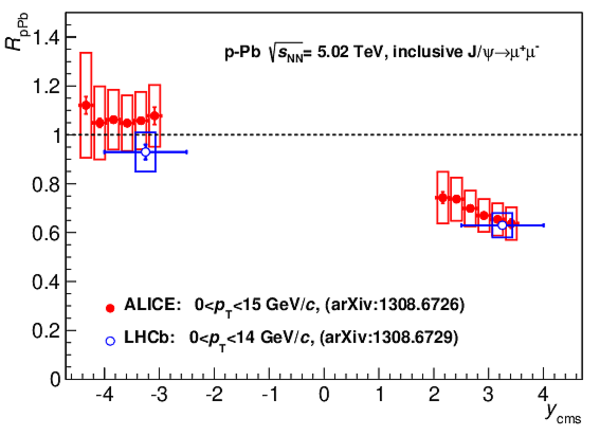
Nuclear modification factor as a function of rapidity. The left hand plot shows the measurements integrated over the accessible kinematic range of both experiments, the right hand plot displays the differential measurement by the ALICE collaboration. |
RpA_RA[..].pdf [14 KiB] HiDef png [142 KiB] Thumbnail [136 KiB] *.C file |

|
|
RpA_RA[..].pdf [15 KiB] HiDef png [161 KiB] Thumbnail [151 KiB] *.C file |
|
|
|
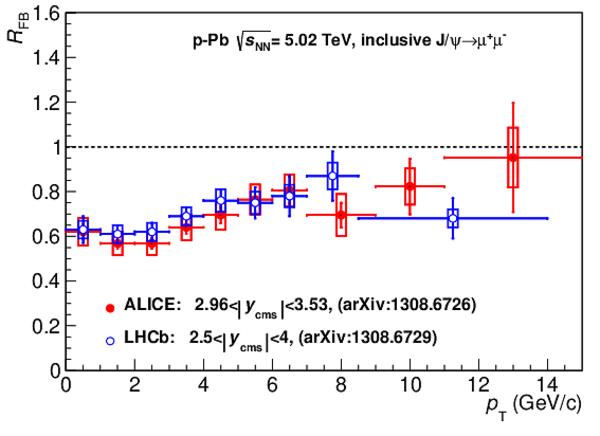
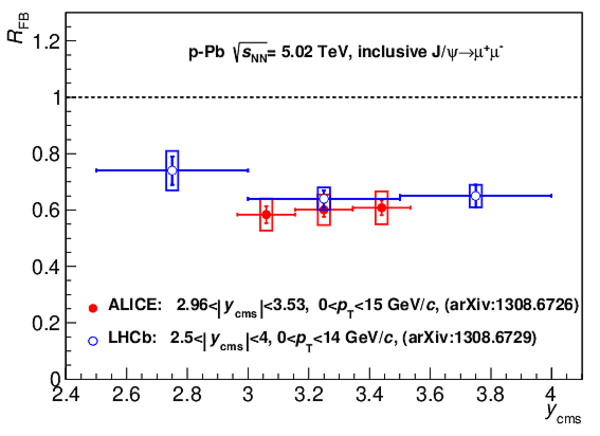
Forward-backward production ratio for inclusive $ { J \mskip -3mu/\mskip -2mu\psi \mskip 2mu} $\/ production in $ p\mathrm{Pb}$ collisions as a function of $ p_{\rm T} $\/ (left) and as a function of rapidity (right), for both experiments. |
RFB_pt_new.pdf [17 KiB] HiDef png [183 KiB] Thumbnail [164 KiB] *.C file |
|
|
RFB_y_new.pdf [14 KiB] HiDef png [168 KiB] Thumbnail [150 KiB] *.C file |
|
|
|
Animated gif made out of all figures. |
CONF-2013-013.gif Thumbnail |

|
![HiDef png [263 KiB]](Directory_LHCb-CONF-2013-013/hidef_checkPow.png)
![HiDef png [255 KiB]](Directory_LHCb-CONF-2013-013/hidef_checkLin.png)
![HiDef png [263 KiB]](Directory_LHCb-CONF-2013-013/hidef_checkExp.png)
![HiDef png [133 KiB]](Directory_LHCb-CONF-2013-013/hidef_AliceInter.png)
![HiDef png [159 KiB]](Directory_LHCb-CONF-2013-013/hidef_AliceCEM.png)
![HiDef png [112 KiB]](Directory_LHCb-CONF-2013-013/hidef_AliceFONLL.png)
![HiDef png [141 KiB]](Directory_LHCb-CONF-2013-013/hidef_LHCbjpsip.png)
![HiDef png [150 KiB]](Directory_LHCb-CONF-2013-013/hidef_LHCbjpsib.png)
![HiDef png [142 KiB]](Directory_LHCb-CONF-2013-013/hidef_LHCbjpsii.png)
![HiDef png [203 KiB]](Directory_LHCb-CONF-2013-013/hidef_InterpolEnergy_new.png)
![HiDef png [326 KiB]](Directory_LHCb-CONF-2013-013/hidef_InterpolRapidity_new.png)
![HiDef png [182 KiB]](Directory_LHCb-CONF-2013-013/hidef_dsigmady_new.png)
![HiDef png [151 KiB]](Directory_LHCb-CONF-2013-013/hidef_d2sigmadydpt_pA_new.png)
![HiDef png [142 KiB]](Directory_LHCb-CONF-2013-013/hidef_RpA_RAp_new.png)
![HiDef png [161 KiB]](Directory_LHCb-CONF-2013-013/hidef_RpA_RAp_Y_new.png)
![HiDef png [183 KiB]](Directory_LHCb-CONF-2013-013/hidef_RFB_pt_new.png)
![HiDef png [168 KiB]](Directory_LHCb-CONF-2013-013/hidef_RFB_y_new.png)
Tables and captions
|
Existing $ { J \mskip -3mu/\mskip -2mu\psi \mskip 2mu} $\/ cross-section measurements in $2.5<y<4.0$\/ from ALICE [10,9] and LHCb [11,12,13]. The LHCb cross-section at $\sqrt{s}=2.76$ TeV was obtained by rescaling the measured value to the rapidity interval $2.5<y<4.0$. At the other centre-of-mass energies the cross-sections were calculated by integrating the published double differential measurements over the same rapidity range. The first quoted uncertainty is statistical and the second is systematic. |
Table_1.pdf [35 KiB] HiDef png [114 KiB] Thumbnail [26 KiB] tex code |

|
|
Cross-sections in units of $\mu$b for prompt $ { J \mskip -3mu/\mskip -2mu\psi \mskip 2mu} $\/ production at $\sqrt{s}=2.76$, $5.02$ and $7\mathrm{ Te V} $ as predicted by the LO-CEM and FONLL models. The LO-CEM/CTEQ6L predictions for factorization scales $\mu_{\rm F}=m_c/2$\/ and $\mu_{\rm F}=m_c$\/ are identical and listed only once. The minimum and maximum values for FONLL result from varying the renormalization scale $\mu_{\rm R}$\/ and the factorization scale $\mu_{\rm F}$\/ in the range $\mu_0/2 < \mu_{\rm R},\mu_{\rm F} <2\mu_0$\/ with the constraint $1/2<\mu_R/\mu_F<2$, having defined $\mu_0$\/ by $\mu^2_0 = p_{\rm T} ^2 +m_c^2$. |
Table_2.pdf [33 KiB] HiDef png [150 KiB] Thumbnail [68 KiB] tex code |

|
|
Cross-section interpolation of the ALICE data. See text for details on the assignment of the uncertainties. |
Table_3.pdf [32 KiB] HiDef png [84 KiB] Thumbnail [36 KiB] tex code |

|
|
Interpolated values of $\sigma(J/\psi)$ ($\mu$b) at $\sqrt{s}=5.02\mathrm{ Te V} $\/ for LHCb. The quoted uncertainties are experimental. |
Table_4.pdf [31 KiB] HiDef png [61 KiB] Thumbnail [29 KiB] tex code |

|
|
Interpolation of $\mathrm{d}\sigma/\mathrm{d} y$, using ALICE data. The quoted uncertainties for the experimental data are statistical and systematic, respectively. For the interpolated values, the first uncertainty is related to the total uncertainties of the 2.76 and $7\mathrm{ Te V} $ data, while the second is extracted from the dispersion of the results corresponding to the various fitting functions. |
Table_5.pdf [33 KiB] HiDef png [84 KiB] Thumbnail [48 KiB] tex code |

|
|
Interpolated $\mathrm{d}\sigma/\mathrm{d} y$\/ at $\sqrt{s}=5.02\mathrm{ Te V} $, for the rapidity intervals corresponding to the binning adopted by ALICE in $ p\mathrm{Pb}$ studies. The first quoted uncertainty is related to the uncorrelated uncertainty obtained in the first step of the interpolation procedure. The second one is the $y$-correlated uncertainty, while the third one comes from the maximum spread between the results obtained with the three interpolating functions. The last uncertainty represent the theory-related contribution. |
Table_6.pdf [31 KiB] HiDef png [220 KiB] Thumbnail [113 KiB] tex code |

|
![HiDef png [114 KiB]](Directory_LHCb-CONF-2013-013/hidef_Table_1.png)
![HiDef png [150 KiB]](Directory_LHCb-CONF-2013-013/hidef_Table_2.png)
![HiDef png [84 KiB]](Directory_LHCb-CONF-2013-013/hidef_Table_3.png)
![HiDef png [61 KiB]](Directory_LHCb-CONF-2013-013/hidef_Table_4.png)
![HiDef png [84 KiB]](Directory_LHCb-CONF-2013-013/hidef_Table_5.png)
![HiDef png [220 KiB]](Directory_LHCb-CONF-2013-013/hidef_Table_6.png)
Created on 27 April 2024.