Reference pp cross-sections for $\Upsilon(1S)$ studies in proton-lead collisions at $\sqrt{s_{NN}} = 5.02$ TeV and comparisons between ALICE and LHCb results
[to restricted-access page]Abstract
The ALICE and LHCb collaborations have studied \Y1S production at large rapidities in proton-lead collisions at $\sqrt{s_{ NN}}=5.02\mathrm{ Te V} $\/ at the LHC using di-muon final states. The evaluation of cold nuclear matter effects requires knowledge of the corresponding \Y1S production cross section in $ pp$ collisions at the same centre-of-mass energy and in the same kinematic range. In this note the interpolation procedures used to determine this quantity and the related consistency checks are described. Finally, the results from the two experiments on nuclear modification factors are briefly summarized and found to be in good agreement.
Figures and captions
|
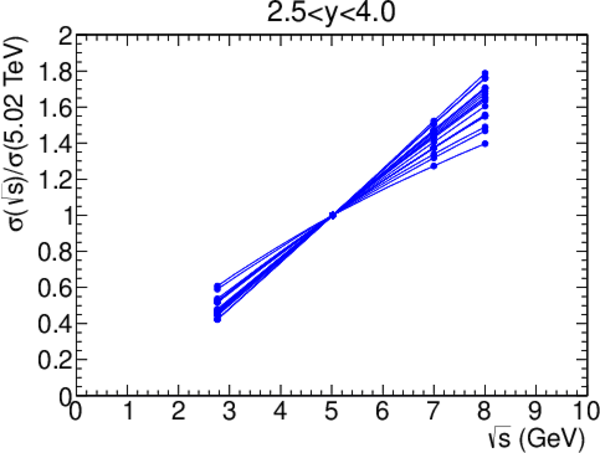
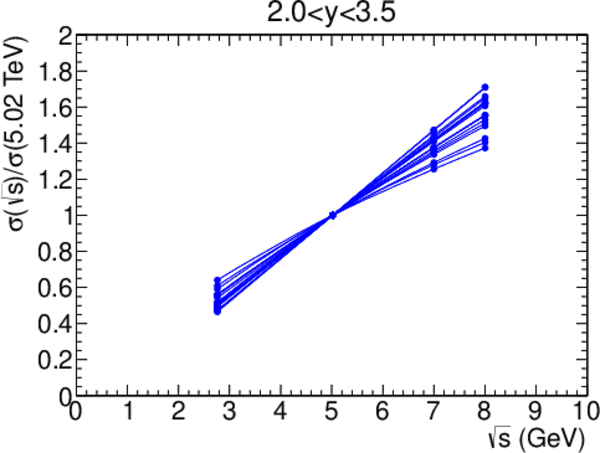
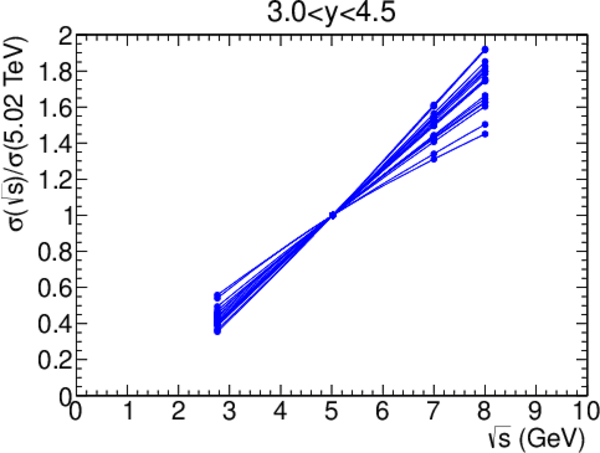
Model predictions for \Y1S production in different rapidity ranges. The relative cross sections normalized to the prediction at $\sqrt{s_{ NN}}=5.02$ TeV are shown. The lines are spline functions through the model points, drawn to guide the eye. The numerical values are given in tables 8, 9, and 10. |
Fig1a.pdf [7 KiB] HiDef png [207 KiB] Thumbnail [138 KiB] |
|
|
Fig1b.pdf [7 KiB] HiDef png [203 KiB] Thumbnail [135 KiB] |
|
|
|
Fig1c.pdf [7 KiB] HiDef png [220 KiB] Thumbnail [143 KiB] |
|
|
|
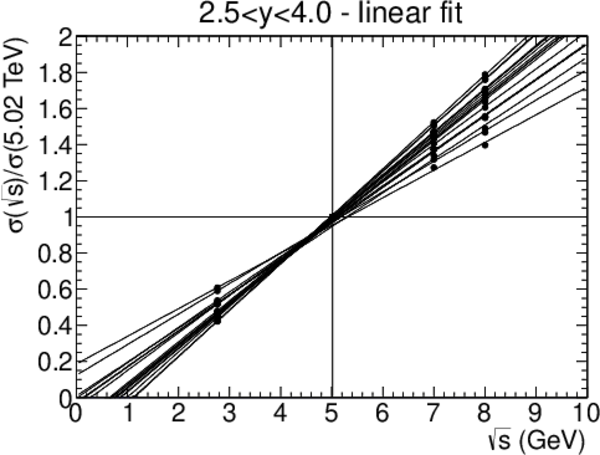
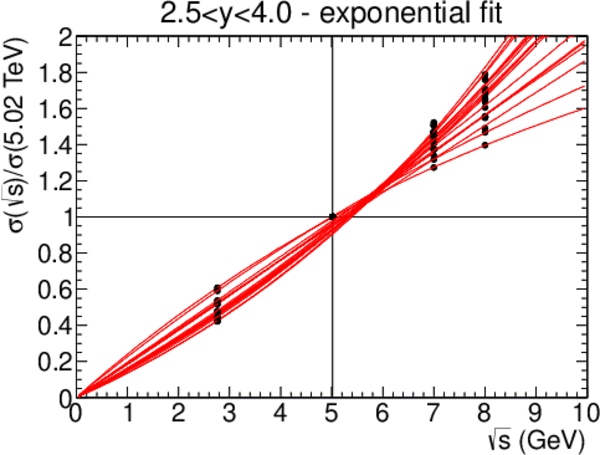
Comparison of (top left) linear, (top right) power law and (bottom) exponential interpolations for the energy dependence of the \Y1S production cross sections for the theoretical predictions given in Table 9 for the rapidity range $2.5<y<4.0$. The points at $\sqrt{s}=5.02$ TeV are excluded from the fit. |
Fig2a.pdf [13 KiB] HiDef png [264 KiB] Thumbnail [221 KiB] |
|
|
Fig2b.pdf [13 KiB] HiDef png [325 KiB] Thumbnail [192 KiB] |

|
|
|
Fig2c.pdf [12 KiB] HiDef png [319 KiB] Thumbnail [189 KiB] |
|
|
|
Cross-section interpolation for the LHCb data in the range $2.5<y<4.0$\/ using three phenomenological models. The point at $\sqrt{s}=5.02$ TeV is the nominal result of the interpolation procedure, the uncertainty band is the result from error propagation of the experimental uncertainties of the measurements at $\sqrt{s}=2.76$, $7$, and $8$ TeV, scaled by $\sqrt{\tilde{\chi}^2}$. |
LHCbIn[..].pdf [17 KiB] HiDef png [405 KiB] Thumbnail [287 KiB] |

|
|
Cross section for \Y1S production in $2.0<y<3.5$\/ as a function of energy [12,13,14]. The lines are fits according to three different shapes. |
Range2fit.pdf [15 KiB] HiDef png [173 KiB] Thumbnail [144 KiB] |

|
|
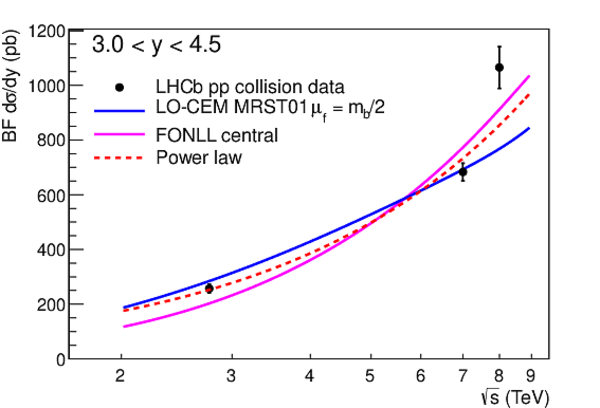
Cross section for \Y1S production in $3.0<y<4.5$\/ as a function of energy [12,13,14]. The lines are fits according to three different shapes. |
Range4fit.pdf [15 KiB] HiDef png [167 KiB] Thumbnail [135 KiB] |
|
|
Cross section for \Y1S production in the range $2.0<y<3.5$ at $\sqrt{s}=5.02$ TeV for fitting shapes passing the $\tilde{\chi}^2 \leq 3 \tilde{\chi}^2_{\min}$\/ selection. The line marks the position of the weighted average value. |
Range2.pdf [14 KiB] HiDef png [203 KiB] Thumbnail [165 KiB] |

|
|
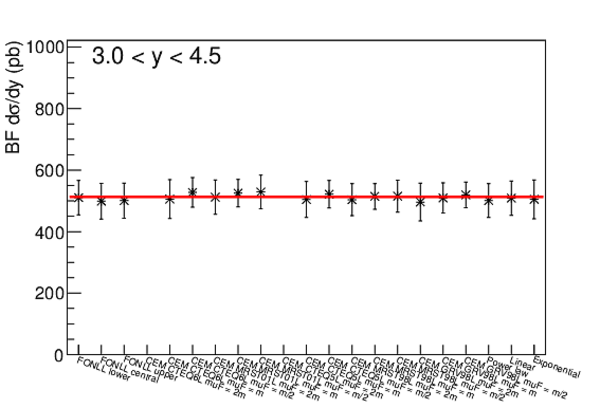
Cross section for \Y1S production in the range $3.0<y<4.5$\/ at $\sqrt{s}=5.02$ TeV for fitting shapes passing the $\tilde{\chi}^2 \leq 3 \tilde{\chi}^2_{\min}$\/ selection. The line marks the position of the weighted average value. |
Range4.pdf [15 KiB] HiDef png [209 KiB] Thumbnail [162 KiB] |
|
|
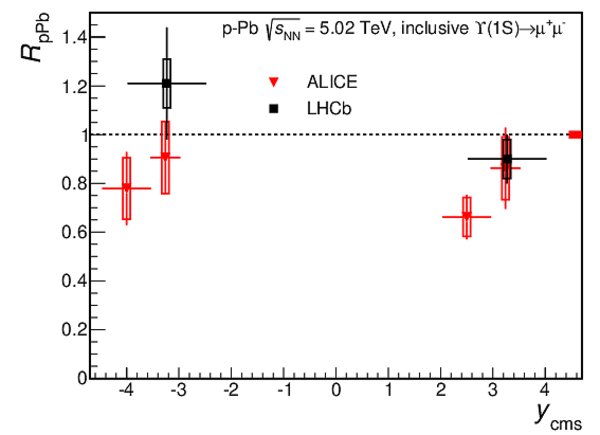
Nuclear modification factor as a function of rapidity as measured by ALICE and LHCb. In the left plot, the ALICE results are integrated over the full acceptance; in the right plot, a finer binning is used. The vertical error bars represent the statistical uncertainties and the open boxes the uncorrelated systematic uncertainties. |
RpPb_A[..].pdf [14 KiB] HiDef png [100 KiB] Thumbnail [96 KiB] |

|
|
RpPb_A[..].pdf [14 KiB] HiDef png [106 KiB] Thumbnail [100 KiB] |
|
|
|
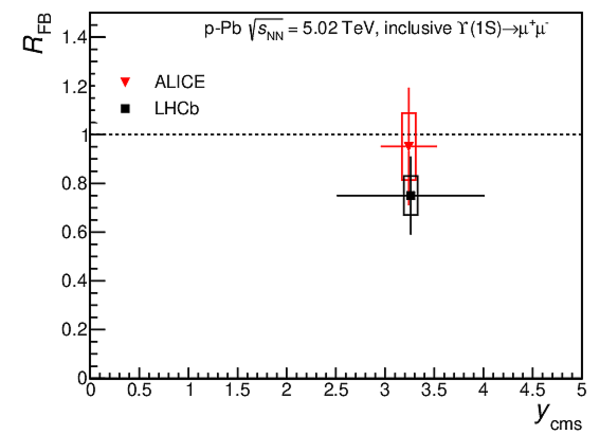
Forward-backward asymmetry for \Y1S production as a function of rapidity as measured by ALICE and LHCb. The vertical error bars represent the statistical uncertainties and the open boxes the uncorrelated systematic uncertainties. |
RFB_AL[..].pdf [13 KiB] HiDef png [107 KiB] Thumbnail [101 KiB] |
|
|
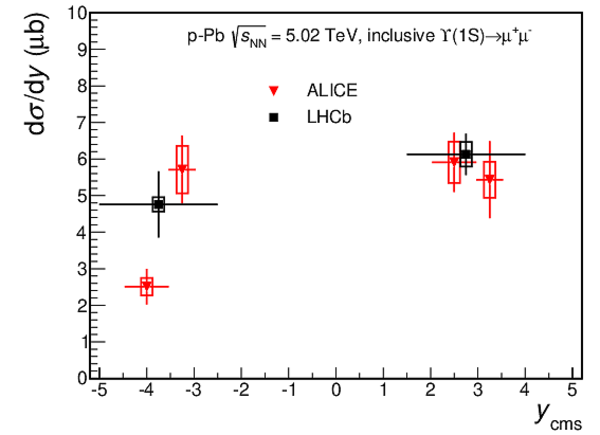
Rapidity differential cross section as a function of rapidity as measured by ALICE and LHCb. The horizontal error bars indicate the rapidity ranges of the individual measurements. The vertical error bars represent the statistical uncertainties and the open boxes the uncorrelated systematic uncertainties. |
Sigmap[..].pdf [14 KiB] HiDef png [104 KiB] Thumbnail [99 KiB] |
|
|
Animated gif made out of all figures. |
CONF-2014-003.gif Thumbnail |

|
![HiDef png [207 KiB]](Directory_LHCb-CONF-2014-003/hidef_Fig1a.png)
![HiDef png [203 KiB]](Directory_LHCb-CONF-2014-003/hidef_Fig1b.png)
![HiDef png [220 KiB]](Directory_LHCb-CONF-2014-003/hidef_Fig1c.png)
![HiDef png [264 KiB]](Directory_LHCb-CONF-2014-003/hidef_Fig2a.png)
![HiDef png [325 KiB]](Directory_LHCb-CONF-2014-003/hidef_Fig2b.png)
![HiDef png [319 KiB]](Directory_LHCb-CONF-2014-003/hidef_Fig2c.png)
![HiDef png [405 KiB]](Directory_LHCb-CONF-2014-003/hidef_LHCbInterpol.png)
![HiDef png [173 KiB]](Directory_LHCb-CONF-2014-003/hidef_Range2fit.png)
![HiDef png [167 KiB]](Directory_LHCb-CONF-2014-003/hidef_Range4fit.png)
![HiDef png [203 KiB]](Directory_LHCb-CONF-2014-003/hidef_Range2.png)
![HiDef png [209 KiB]](Directory_LHCb-CONF-2014-003/hidef_Range4.png)
![HiDef png [100 KiB]](Directory_LHCb-CONF-2014-003/hidef_RpPb_ALICELHCb.png)
![HiDef png [106 KiB]](Directory_LHCb-CONF-2014-003/hidef_RpPb_ALICELHCb4p2.png)
![HiDef png [107 KiB]](Directory_LHCb-CONF-2014-003/hidef_RFB_ALICELHCb.png)
![HiDef png [104 KiB]](Directory_LHCb-CONF-2014-003/hidef_SigmapPb_ALICELHCb4p2.png)
Tables and captions
|
Existing \Y1S $ pp$ cross-section measurements in different rapidity ranges from ALICE and LHCb. The ALICE value, integrated over $ p_{\rm T} <12 {\mathrm{ Ge V /}c} $, is obtained by multiplying the published cross section $\sigma=54.2 \pm 5.0 \pm 6.7$ nb by the branching fraction ${\rm BF}(\mu^+\mu^-)=2.48\pm 0.05\%$. The LHCb cross sections are integrated over $ p_{\rm T} <15$ GeV/$c$\/ and are calculated by integrating the published double differential measurements over the considered rapidity ranges. The first uncertainty is statistical and the second systematic. |
Table_1.pdf [47 KiB] HiDef png [88 KiB] Thumbnail [44 KiB] tex code |

|
|
Bias and RMS-spread in percent at $\sqrt{s}=5.02$ TeV. The interpolation is based on unweighted least squares fits to the predictions at $\sqrt{s}=2.76, 7,\; and\;8$ TeV. |
Table_2.pdf [29 KiB] HiDef png [39 KiB] Thumbnail [20 KiB] tex code |

|
|
Interpolated values of $\sigma(\Y1S)$ at $\sqrt{s}=5.02\mathrm{ Te V} $\/ in the range $2.5<y<4.0$ for LHCb. The quoted uncertainties are obtained by propagation of the unscaled experimental uncertainties. |
Table_3.pdf [37 KiB] HiDef png [43 KiB] Thumbnail [20 KiB] tex code |

|
|
Rapidity ranges for the ALICE interpolation and measurement of the \Y1S nuclear modification factor. The central value of each range is also reported. |
Table_4.pdf [44 KiB] HiDef png [55 KiB] Thumbnail [25 KiB] tex code |

|
|
Minimum value $\tilde{\chi}^2_{\min}$\/ and number of shapes satisfying the criterion $\tilde{\chi}^2 \leq 3\tilde{\chi}^2_{\min}$\/ for all rapidity ranges used in the interpolation. The numbering of ranges is as defined in Table 4. |
Table_5.pdf [37 KiB] HiDef png [37 KiB] Thumbnail [17 KiB] tex code |

|
|
Interpolated \Y1S cross sections used for the ALICE $R_{ p\mathrm{Pb} }$ measurement. The experimental, interpolation and range contributions to the uncertainty (see text) are also reported. |
Table_6.pdf [31 KiB] HiDef png [54 KiB] Thumbnail [26 KiB] tex code |

|
|
Results of the interpolation of the \Y1S cross sections at a nucleon-nucleon centre-of-mass energy $\sqrt{s}=5.02$ TeV for different rapidity ranges by the ALICE and LHCb methods. |
Table_7.pdf [29 KiB] HiDef png [51 KiB] Thumbnail [25 KiB] tex code |

|
|
Relative cross-sections for \Y1S production in $ pp$ collisions normalised to the prediction at $\sqrt{s}=5.02\mathrm{ Te V} $\/ in the rapidity range $2.0<y<3.5$\/ at $\sqrt{s}=2.76$, $7$\/ and $8\mathrm{ Te V} $\/ as predicted by different models. The minimum and maximum values for the FONLL result are obtained from varying the renormalization scale $\mu_{\rm R}$\/ and the factorization scale $\mu_{\rm F}$\/ in the range $\mu_0/2 < \mu_{\rm R},\mu_{\rm F} <2\mu_0$\/ with the constraint $1/2<\mu_R/\mu_F<2$, having defined $\mu_0$\/ by $\mu^2_0 = p_{\rm T} ^2 +m_b^2$. |
Table_8.pdf [48 KiB] HiDef png [179 KiB] Thumbnail [84 KiB] tex code |

|
|
Relative cross-sections for \Y1S production in $ pp$ collisions normalised to the prediction at $\sqrt{s}=5.02\mathrm{ Te V} $\/ in the rapidity range $2.5<y<4.0$\/ at $\sqrt{s}=2.76$, $7$\/ and $8\mathrm{ Te V} $\/ as predicted by different models. The minimum and maximum values for the FONLL result are obtained from varying the renormalization scale $\mu_{\rm R}$\/ and the factorization scale $\mu_{\rm F}$\/ in the range $\mu_0/2 < \mu_{\rm R},\mu_{\rm F} <2\mu_0$\/ with the constraint $1/2<\mu_R/\mu_F<2$, having defined $\mu_0$\/ by $\mu^2_0 = p_{\rm T} ^2 +m_b^2$. |
Table_9.pdf [48 KiB] HiDef png [179 KiB] Thumbnail [84 KiB] tex code |

|
|
Relative cross-sections for \Y1S production in $ pp$ collisions normalised to the prediction at $\sqrt{s}=5.02\mathrm{ Te V} $\/ in the rapidity range $3.0<y<4.5$\/ at $\sqrt{s}=2.76$, $7$\/ and $8\mathrm{ Te V} $\/ as predicted by different models. The minimum and maximum values for the FONLL result are obtained from varying the renormalization scale $\mu_{\rm R}$\/ and the factorization scale $\mu_{\rm F}$\/ in the range $\mu_0/2 < \mu_{\rm R},\mu_{\rm F} <2\mu_0$\/ with the constraint $1/2<\mu_R/\mu_F<2$, having defined $\mu_0$\/ by $\mu^2_0 = p_{\rm T} ^2 +m_b^2$. |
Table_10.pdf [48 KiB] HiDef png [178 KiB] Thumbnail [84 KiB] tex code |

|
![HiDef png [88 KiB]](Directory_LHCb-CONF-2014-003/hidef_Table_1.png)
![HiDef png [39 KiB]](Directory_LHCb-CONF-2014-003/hidef_Table_2.png)
![HiDef png [43 KiB]](Directory_LHCb-CONF-2014-003/hidef_Table_3.png)
![HiDef png [55 KiB]](Directory_LHCb-CONF-2014-003/hidef_Table_4.png)
![HiDef png [37 KiB]](Directory_LHCb-CONF-2014-003/hidef_Table_5.png)
![HiDef png [54 KiB]](Directory_LHCb-CONF-2014-003/hidef_Table_6.png)
![HiDef png [51 KiB]](Directory_LHCb-CONF-2014-003/hidef_Table_7.png)
![HiDef png [179 KiB]](Directory_LHCb-CONF-2014-003/hidef_Table_8.png)
![HiDef png [179 KiB]](Directory_LHCb-CONF-2014-003/hidef_Table_9.png)
![HiDef png [178 KiB]](Directory_LHCb-CONF-2014-003/hidef_Table_10.png)
Created on 27 April 2024.