Abstract
This analysis investigates the capability of LHCb to study the decay mode $ B ^+ \rightarrow K ^+ \pi ^0 $ {}. This serves as a prototype analysis for decay channels with similar topologies, such as the $ B ^0 \rightarrow K ^0_{\rm\scriptscriptstyle S} \pi ^0 $ , the $\Lambda ^0_ b \rightarrow \Lambda \gamma $ , and the $ B ^0 \rightarrow K ^0_{\rm\scriptscriptstyle S} \pi ^0 \gamma $ decays, which involve photons in the final state and lack a reconstructed decay vertex. There is significant interest in these channels due to their sensitivity to effects of physics beyond the standard model. The proton-proton collision data set collected in 2011--2012, corresponding to 3.0 $ fb^{-1}$ of integrated luminosity, is studied. An analysis strategy is developed to mitigate the effects of low trigger efficiency and large combinatorial background leading to the reconstruction of $72\pm26$ signal events with a statistical significance of $3.7\sigma.$ Based on the findings of this study, a dedicated software trigger is being developed for use in the next data-taking period scheduled for later this year, when the LHC centre-of-mass energy will be increased.
Figures and captions
|
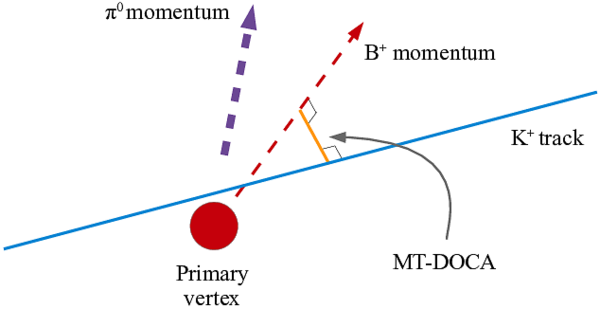
MT-DOCA and the reconstructed $ B ^+ \rightarrow K ^+ \pi ^0 $ {} decay topology. |
MTD_with.pdf [28 KiB] HiDef png [147 KiB] Thumbnail [86 KiB] *.C file |
|
|
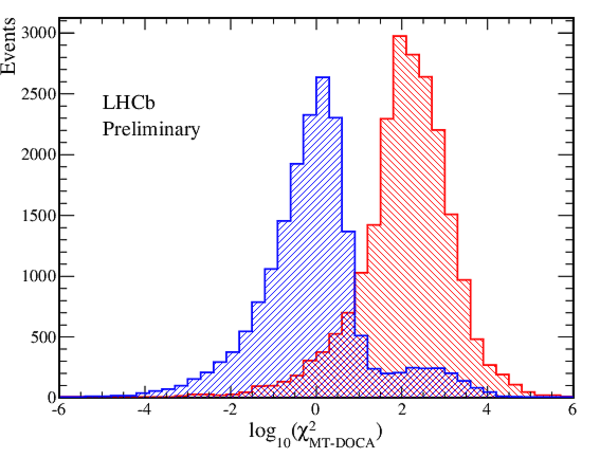
Signal and background distributions of $\log_{10}(\chi^2 _{\text{MT-DOCA}})$ for 2012 conditions. The signal contribution from simulated data is shown in hatched blue, and the background contribution from mass sidebands in the recorded data is shown in hatched red. |
mtdChi[..].pdf [14 KiB] HiDef png [448 KiB] Thumbnail [307 KiB] *.C file |
|
|
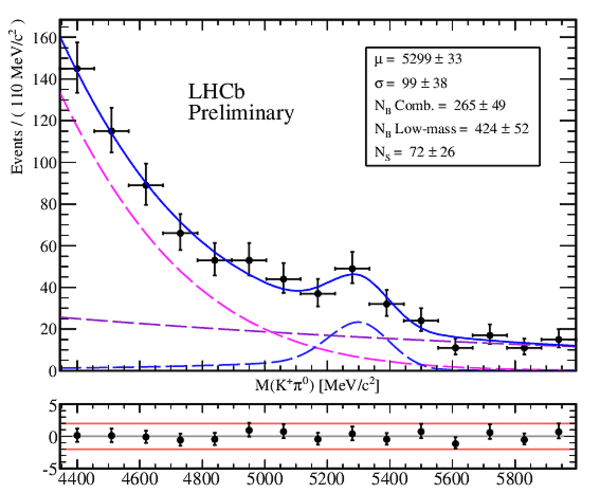
Mass distribution of the reconstructed candidates, selected from the entire data set. The data are drawn as black points. The fit to the $ B ^+$ reconstructed mass is drawn as a solid blue line. The signal component is drawn in dashed blue, the combinatorial background is drawn in dashed purple, and the low-mass background is drawn in dashed magenta. |
massFit.pdf [18 KiB] HiDef png [285 KiB] Thumbnail [239 KiB] *.C file |
|
|
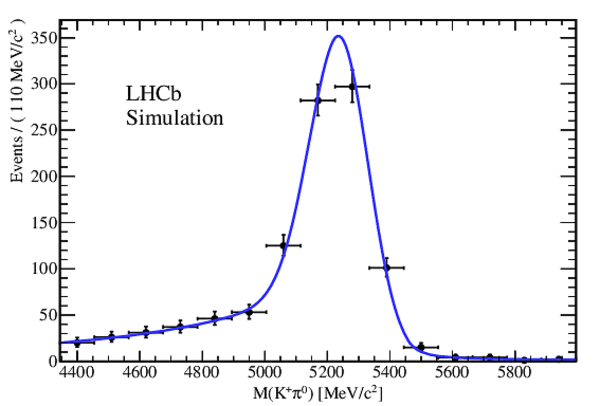
Reconstructed $ B ^+$ mass distribution from simulated data of $ B ^+ \rightarrow K ^+ \pi ^0 $ {} decays that pass the selection requirements. |
mgdMass.pdf [16 KiB] HiDef png [187 KiB] Thumbnail [144 KiB] *.C file |
|
|
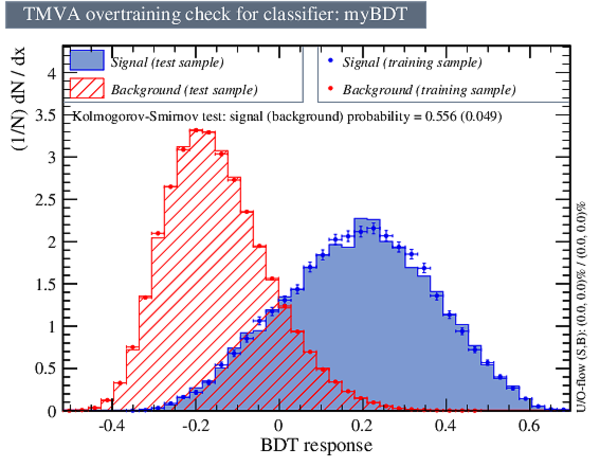
Distribution of the classifier response variable. The signal contribution from simulated data is shown in solid blue, and the background contribution from experimental data is shown in hatched red. |
BDTRes[..].pdf [22 KiB] HiDef png [531 KiB] Thumbnail [349 KiB] *.C file |
|
|
Animated gif made out of all figures. |
CONF-2015-001.gif Thumbnail |

|
![HiDef png [147 KiB]](Directory_LHCb-CONF-2015-001/hidef_MTD_with.png)
![HiDef png [448 KiB]](Directory_LHCb-CONF-2015-001/hidef_mtdChi2LogPlot.png)
![HiDef png [285 KiB]](Directory_LHCb-CONF-2015-001/hidef_massFit.png)
![HiDef png [187 KiB]](Directory_LHCb-CONF-2015-001/hidef_mgdMass.png)
![HiDef png [531 KiB]](Directory_LHCb-CONF-2015-001/hidef_BDTResponseLarge.png)
Created on 27 April 2024.