Prompt $\Lambda^+_{\mathrm{c}}$ production in $p\mathrm{Pb}$ collisions at $\sqrt{s_{_{\mathrm{NN}}}} = 5.02\mathrm{ Te V}$
[to restricted-access page]Abstract
Production of prompt $\Lambda ^+_ c $ baryons is studied in proton-lead and lead-proton collisions collected with the LHCb detector at the LHC. The data sample corresponds to an integrated luminosity of $1.58\pm0.02 nb^{-1} $ recorded at a nucleon-nucleon centre-of-mass energy of $\sqrt{ s_{ {NN}}}=5.02\mathrm{ Te V} $. Measurements of the differential cross-section and the forward-backward production ratio are reported using $\Lambda ^+_ c $ candidates with transverse momenta in the range $2-10 {\mathrm{ Ge V /}c} $ and rapidities in the ranges of $1.5-4.0$ and $-4.5- -2.5$ in the nucleon-nucleon centre-of-mass system. The ratio of cross-sections of $\Lambda ^+_ c $ baryons and $ D ^0$ mesons is also reported. The results are compared with next-to-leading order theoretical calculations using nuclear parton distribution functions.
Figures and captions
|
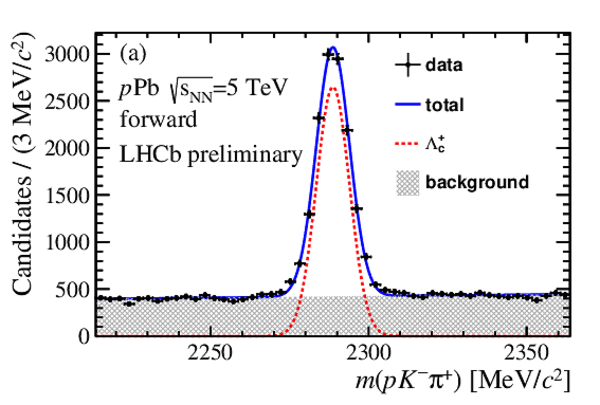
Distributions of the invariant mass, $m( p K ^- \pi ^+ )$, for (a) the forward data sample with $2 < p_{\mathrm{ T}} < 10 {\mathrm{ Ge V /}c} $ and $1.5 < y^* < 4.0$ and (b) the backward data sample with $2 < p_{\mathrm{ T}} < 10 {\mathrm{ Ge V /}c} $ and $-4.5 < y^* < -2.5$. The red dotted line is the inclusive $\Lambda ^+_ c $ candidates, the grey shaded area the combinatorial background while the blue solid line is the sum of the two. |
mass_pA.pdf [28 KiB] HiDef png [430 KiB] Thumbnail [305 KiB] *.C file |
|
|
mass_Ap.pdf [28 KiB] HiDef png [702 KiB] Thumbnail [461 KiB] *.C file |

|
|
|
Distributions of $\log_{10}\chi^2_{\text{IP}} (\Lambda ^+_ c ) $ distribution with the fit results overlaid for (a) the forward data sample with $2 < p_{\mathrm{ T}} < 10 {\mathrm{ Ge V /}c} $ and $1.5 < y^* < 4.0$, and (b) the backward data sample with $2 < p_{\mathrm{ T}} < 10 {\mathrm{ Ge V /}c} $ and $-4.5 < y^* < -2.5$. The solid blue curve is the sum. The red dotted line is the prompt component, the green is the $\Lambda ^+_ c \mathrm{\text{-}from\text{-}}b $ component while the grey shaded area denotes the combinatorial background. |
ipchi2_pA.pdf [23 KiB] HiDef png [370 KiB] Thumbnail [288 KiB] *.C file |

|
|
ipchi2_Ap.pdf [23 KiB] HiDef png [461 KiB] Thumbnail [345 KiB] *.C file |

|
|
|
Double-differential cross-section of prompt $\Lambda ^+_ c $ baryons in $ p\mathrm{Pb} $ collisions in the (a) forward and (b) backward collision samples. The error bars represent the quadratic sum of the statistical and the systematic uncertainties. |
cpt0.pdf [19 KiB] HiDef png [199 KiB] Thumbnail [168 KiB] *.C file |

|
|
cpt1.pdf [18 KiB] HiDef png [194 KiB] Thumbnail [165 KiB] *.C file |

|
|
|
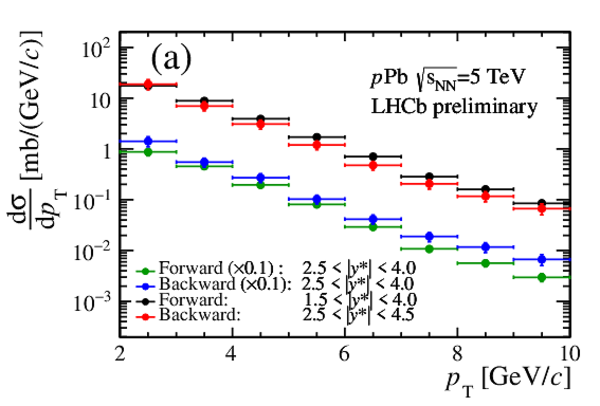
Differential cross-section of prompt $\Lambda ^+_ c $ baryons in $ p\mathrm{Pb} $ collisions as a function of (a) $ p_{\mathrm{ T}} $ and (b) $y^{*}$ in the forward and backward sample. The error bars represent the quadratic sum of the statistical and the systematic uncertainties. |
cpt2.pdf [17 KiB] HiDef png [196 KiB] Thumbnail [191 KiB] *.C file |
|
|
cy.pdf [14 KiB] HiDef png [131 KiB] Thumbnail [126 KiB] *.C file |

|
|
|
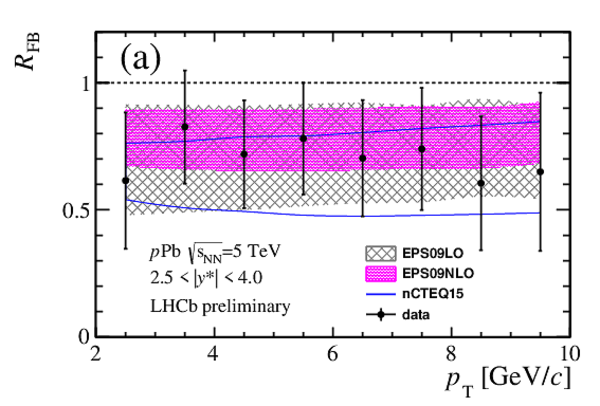
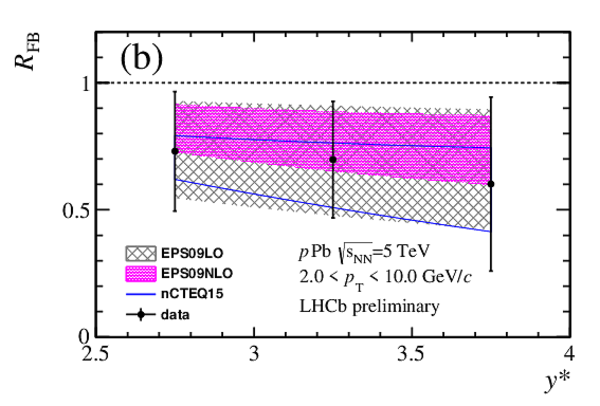
Forward-backward production ratios $R_\mathrm{FB}$ as functions of (a) $ p_{\mathrm{ T}} $ integrated over $2.5<y^*<4$ and (b) $y^*$ integrated over $2< p_{\mathrm{ T}} <10 {\mathrm{ Ge V /}c} $. The error bars represent the quadratic sum of the statistical and the systematic uncertainties. |
rfb_pt.pdf [16 KiB] HiDef png [729 KiB] Thumbnail [346 KiB] *.C file |
|
|
rfb_y.pdf [15 KiB] HiDef png [596 KiB] Thumbnail [298 KiB] *.C file |
|
|
|
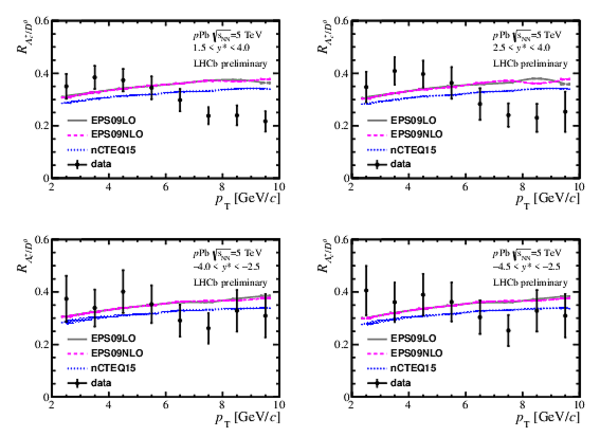
Production ratio $ R_{\Lambda ^+_ c / D ^0 }$ between $\Lambda ^+_ c $ baryons to $ D ^0$ mesons as a function of $ p_{\mathrm{ T}} $ integrated over four different rapidity regions. The error bars represent the quadratic sum of the statistical and the systematic uncertainties. |
lc2d0_pt.pdf [32 KiB] HiDef png [321 KiB] Thumbnail [251 KiB] *.C file |
|
|
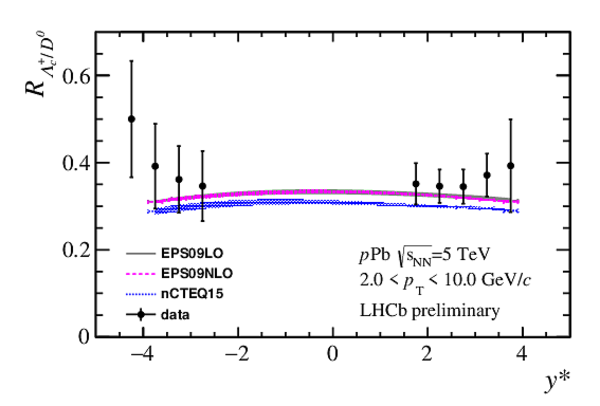
Production ratio $ R_{\Lambda ^+_ c / D ^0 }$ between $\Lambda ^+_ c $ baryons and $ D ^0$ mesons as a function of $y^*$ integrated over $2 < p_{\mathrm{ T}} < 10 {\mathrm{ Ge V /}c} $. The error bars represent the quadratic sum of the statistical and the systematic uncertainties. |
lc2d0_y.pdf [19 KiB] HiDef png [177 KiB] Thumbnail [127 KiB] *.C file |
|
|
Animated gif made out of all figures. |
CONF-2017-005.gif Thumbnail |

|
![HiDef png [430 KiB]](Directory_LHCb-CONF-2017-005/hidef_mass_pA.png)
![HiDef png [702 KiB]](Directory_LHCb-CONF-2017-005/hidef_mass_Ap.png)
![HiDef png [370 KiB]](Directory_LHCb-CONF-2017-005/hidef_ipchi2_pA.png)
![HiDef png [461 KiB]](Directory_LHCb-CONF-2017-005/hidef_ipchi2_Ap.png)
![HiDef png [199 KiB]](Directory_LHCb-CONF-2017-005/hidef_cpt0.png)
![HiDef png [194 KiB]](Directory_LHCb-CONF-2017-005/hidef_cpt1.png)
![HiDef png [196 KiB]](Directory_LHCb-CONF-2017-005/hidef_cpt2.png)
![HiDef png [131 KiB]](Directory_LHCb-CONF-2017-005/hidef_cy.png)
![HiDef png [729 KiB]](Directory_LHCb-CONF-2017-005/hidef_rfb_pt.png)
![HiDef png [596 KiB]](Directory_LHCb-CONF-2017-005/hidef_rfb_y.png)
![HiDef png [321 KiB]](Directory_LHCb-CONF-2017-005/hidef_lc2d0_pt.png)
![HiDef png [177 KiB]](Directory_LHCb-CONF-2017-005/hidef_lc2d0_y.png)
Tables and captions
|
Summary of systematic and statistic uncertainties for differential cross-sections. The ranges indicate the variations between bins. |
Table_1.pdf [81 KiB] HiDef png [101 KiB] Thumbnail [46 KiB] tex code |

|
|
Measured differential cross-sections (in units of $\mathrm{ mb} /( {\mathrm{ Ge V /}c} )$) of prompt $\Lambda ^+_ c $ baryons as functions of $ p_{\mathrm{ T}} $ in $ p\mathrm{Pb} $ forward and backward data in different rapidity regions. The right column shows the results for $ p_{\mathrm{ T}} > 7 {\mathrm{ Ge V /}c} $ and $2.5<|y^*|<3.5$, which are used to compute the $ R_\mathrm{FB} $ values at $ p_{\mathrm{ T}} > 7 {\mathrm{ Ge V /}c} $. The first uncertainties are statistical and the second are systematic. |
Table_3.pdf [60 KiB] HiDef png [132 KiB] Thumbnail [63 KiB] tex code |

|
|
Differential cross-sections (in units of $\mathrm{ mb} $) for prompt $\Lambda ^+_ c $ baryons as functions of $y^{*}$ in $ p\mathrm{Pb} $ forward and backward data. The first uncertainties are statistical and the second are systematic. |
Table_4.pdf [59 KiB] HiDef png [153 KiB] Thumbnail [78 KiB] tex code |

|
|
Forward-backward prompt $\Lambda ^+_ c $ production ratio $ R_\mathrm{FB} $ as a function of $ p_{\mathrm{ T}} $ in the common $|y^*|$ range between 2.5 and 4. The first uncertainty is statistical and the second is systematic. |
Table_5.pdf [49 KiB] HiDef png [140 KiB] Thumbnail [67 KiB] tex code |

|
|
$ R_\mathrm{FB} $ ratio as a function of $y^*$ in $2 < p_{\mathrm{ T}} < 10 {\mathrm{ Ge V /}c} $. The first uncertainty is statistical and the second is systematic. |
Table_6.pdf [55 KiB] HiDef png [69 KiB] Thumbnail [32 KiB] tex code |

|
|
Production ratio $ R_{\Lambda ^+_ c / D ^0 } $ as a function of $ p_{\mathrm{ T}} $ in the forward and backward rapidity regions. The first uncertainty is statistical and the second is systematic. |
Table_7.pdf [58 KiB] HiDef png [225 KiB] Thumbnail [116 KiB] tex code |

|
|
Production ratio $ R_{\Lambda ^+_ c / D ^0 } $ as a function of $y^*$ in $2 < p_{\mathrm{ T}} < 10 {\mathrm{ Ge V /}c} $. The first uncertainty is statistical and the second is systematic. |
Table_8.pdf [56 KiB] HiDef png [167 KiB] Thumbnail [80 KiB] tex code |

|
|
Measured differential cross-sections (in units of $\mathrm{ mb} /( {\mathrm{ Ge V /}c} )$) of prompt $\Lambda ^+_ c $ baryons as functions of $ p_{\mathrm{ T}} $ in $ p\mathrm{Pb} $ forward and backward data in different rapidity regions. The right column shows the results for $ p_{\mathrm{ T}} > 7 {\mathrm{ Ge V /}c} $ and $2.5<|y^*|<3.5$, which are used to compute the $ R_\mathrm{FB} $ values at $ p_{\mathrm{ T}} > 7 {\mathrm{ Ge V /}c} $. The first uncertainties are statistical and the second are systematic. |
Table_3.pdf [60 KiB] HiDef png [132 KiB] Thumbnail [63 KiB] tex code |
|
|
Differential cross-sections (in units of $\mathrm{ mb} $) for prompt $\Lambda ^+_ c $ baryons as functions of $y^{*}$ in $ p\mathrm{Pb} $ forward and backward data. The first uncertainties are statistical and the second are systematic. |
Table_4.pdf [59 KiB] HiDef png [153 KiB] Thumbnail [78 KiB] tex code |
|
|
Forward-backward prompt $\Lambda ^+_ c $ production ratio $ R_\mathrm{FB} $ as a function of $ p_{\mathrm{ T}} $ in the common $|y^*|$ range between 2.5 and 4. The first uncertainty is statistical and the second is systematic. |
Table_5.pdf [49 KiB] HiDef png [140 KiB] Thumbnail [67 KiB] tex code |
|
|
$ R_\mathrm{FB} $ ratio as a function of $y^*$ in $2 < p_{\mathrm{ T}} < 10 {\mathrm{ Ge V /}c} $. The first uncertainty is statistical and the second is systematic. |
Table_6.pdf [55 KiB] HiDef png [69 KiB] Thumbnail [32 KiB] tex code |
|
|
Production ratio $ R_{\Lambda ^+_ c / D ^0 } $ as a function of $ p_{\mathrm{ T}} $ in the forward and backward rapidity regions. The first uncertainty is statistical and the second is systematic. |
Table_7.pdf [58 KiB] HiDef png [225 KiB] Thumbnail [116 KiB] tex code |
|
|
Production ratio $ R_{\Lambda ^+_ c / D ^0 } $ as a function of $y^*$ in $2 < p_{\mathrm{ T}} < 10 {\mathrm{ Ge V /}c} $. The first uncertainty is statistical and the second is systematic. |
Table_8.pdf [56 KiB] HiDef png [167 KiB] Thumbnail [80 KiB] tex code |
|
![HiDef png [101 KiB]](Directory_LHCb-CONF-2017-005/hidef_Table_1.png)
![HiDef png [132 KiB]](Directory_LHCb-CONF-2017-005/hidef_Table_3.png)
![HiDef png [153 KiB]](Directory_LHCb-CONF-2017-005/hidef_Table_4.png)
![HiDef png [140 KiB]](Directory_LHCb-CONF-2017-005/hidef_Table_5.png)
![HiDef png [69 KiB]](Directory_LHCb-CONF-2017-005/hidef_Table_6.png)
![HiDef png [225 KiB]](Directory_LHCb-CONF-2017-005/hidef_Table_7.png)
![HiDef png [167 KiB]](Directory_LHCb-CONF-2017-005/hidef_Table_8.png)
Created on 27 April 2024.