Study of coherent $J/\psi$ production in lead-lead collisions at $\sqrt{s_{\rm NN}} =5\ \rm{TeV}$ with the LHCb experiment
[to restricted-access page]Abstract
Coherent production of $ { J \mskip -3mu/\mskip -2mu\psi \mskip 2mu}$ mesons is studied in lead-lead collision data at a nucleon-nucleon centre-of-mass energy of $5\mathrm{ Te V} $ collected by the LHCb experiment. The data set corresponds to an integrated luminosity of about $ 10 {\mathrm{ \upmu b}^{-1}} $. The $ { J \mskip -3mu/\mskip -2mu\psi \mskip 2mu}$ mesons are reconstructed in the dimuon final state, where the muons are detected within the pseudorapidity region $2.0 < \eta < 4.5$. The $ { J \mskip -3mu/\mskip -2mu\psi \mskip 2mu}$ mesons are required to have transverse momentum $ p_{\mathrm{ T}} <1\mathrm{ Ge V} $ and rapidity $2.0 < {y} < 4.5$. The cross-section times branching fraction within this fiducial region is measured to be $\sigma= 5.3 \pm {0.2} (stat) \pm {0.5} (syst) \pm {0.7} (lumi)\mathrm{ mb} $. The cross-section is also measured in five bins of $ { J \mskip -3mu/\mskip -2mu\psi \mskip 2mu}$ rapidity. The results are compared to predictions from phenomenological models.
Figures and captions
|
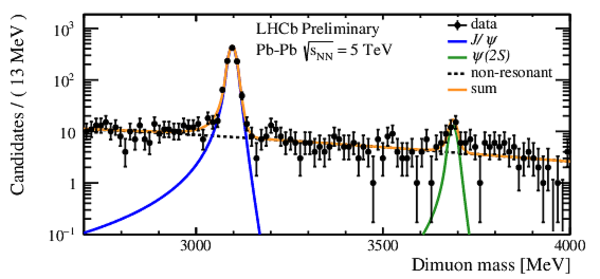
Dimuon invariant mass spectrum in the range between $2.7$ and $4.0\mathrm{ Ge V} $. The contribution of (solid blue line) $ { J \mskip -3mu/\mskip -2mu\psi \mskip 2mu}$ , (solid green line) $\psi {(2S)}$ and (black dashed line) nonresonant are shown individually and the sum of all contributions is represented by the orange curve. |
Fig1.pdf [22 KiB] HiDef png [228 KiB] Thumbnail [189 KiB] *.C file |
|
|
Distribution of $\log( p_{\mathrm{ T}}^{2} )$ of dimuon candidates after all requirements have been applied. The orange line represents the fit to the data points; the blue line shows the coherent contribution and the green (black) line shows the incoherent and feed-down (nonresonant) component. A fit is performed to data using three different templates obtained from the STARlight event generator. |
Fig2.pdf [247 KiB] HiDef png [229 KiB] Thumbnail [189 KiB] *.C file |

|
|
Differential cross-section for coherent $ { J \mskip -3mu/\mskip -2mu\psi \mskip 2mu}$ production compared to different phenomenological predictions. The LHCb measurements are shown as points, where inner and outer error bars represent the statistical and the total uncertainties respectively. |
Fig3.pdf [16 KiB] HiDef png [366 KiB] Thumbnail [239 KiB] *.C file |

|
|
Distribution of $\log( p_{\mathrm{ T}} )$ for dimuon candidates after all cuts have been applied before (black) and after (red) using HeRSCheL information. |
Fig4.pdf [16 KiB] HiDef png [128 KiB] Thumbnail [128 KiB] *.C file |

|
|
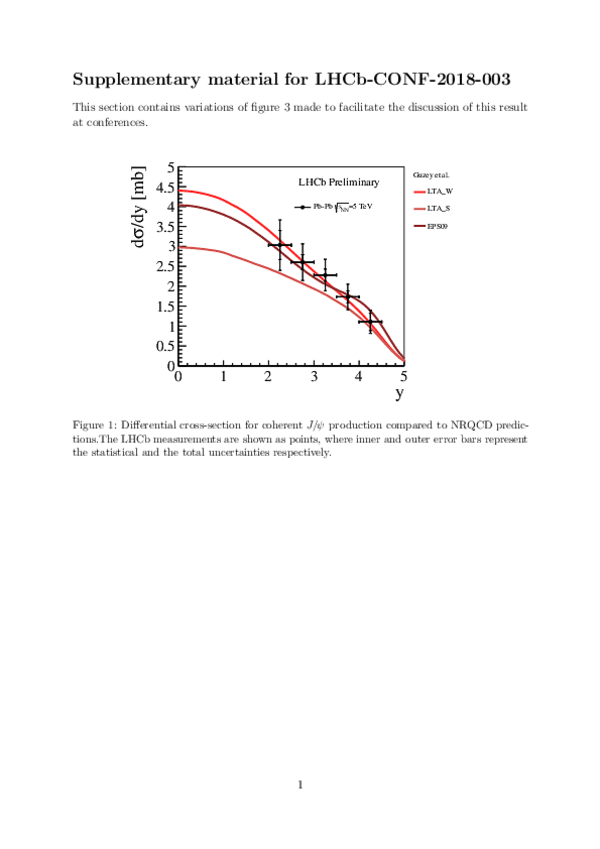
Differential cross-section for coherent $ { J \mskip -3mu/\mskip -2mu\psi \mskip 2mu}$ production compared to NRQCD predictions \cite{Guzey:2016piu}. The LHCb measurements are shown as points, where inner and outer error bars represent the statistical and the total uncertainties respectively. |
Fig3-guzey.pdf [15 KiB] HiDef png [215 KiB] Thumbnail [150 KiB] *.C file |

|
|
Differential cross-section for coherent $ { J \mskip -3mu/\mskip -2mu\psi \mskip 2mu}$ production compared to Colour-Dipole based predictions using the boosted Gaussian (BG) wave function \cite{PhysRevC.84.011902,Goncalves:2017wgg} and the Gauss-LC (GLC) wave function \cite{PhysRevC.84.011902,Goncalves:2017wgg}. The LHCb measurements are shown as points, where inner and outer error bars represent the statistical and the total uncertainties respectively. |
Fig3-g[..].pdf [15 KiB] HiDef png [257 KiB] Thumbnail [176 KiB] *.C file |

|
|
Differential cross-section for coherent $ { J \mskip -3mu/\mskip -2mu\psi \mskip 2mu}$ production compared to Colour-Dipole based predictions from Ref. \cite{Cepila:2017nef}. The LHCb measurements are shown as points, where inner and outer error bars represent the statistical and the total uncertainties respectively. |
Fig3-c[..].pdf [14 KiB] HiDef png [143 KiB] Thumbnail [121 KiB] *.C file |

|
|
Differential cross-section for coherent $ { J \mskip -3mu/\mskip -2mu\psi \mskip 2mu}$ production compared to Colour-Dipole based predictions with and without taking into account initial state fluctuations \cite{Mantysaari:2017dwh}. The LHCb measurements are shown as points, where inner and outer error bars represent the statistical and the total uncertainties respectively. |
Fig3-m[..].pdf [14 KiB] HiDef png [151 KiB] Thumbnail [127 KiB] *.C file |

|
|
Animated gif made out of all figures. |
CONF-2018-003.gif Thumbnail |

|
Tables and captions
|
Relative systematic uncertainties considered for the cross-section measurement of coherent $ { J \mskip -3mu/\mskip -2mu\psi \mskip 2mu}$ production. The first two contributions are taken from Ref. \cite{LHCb-PAPER-2018-011}. |
Table_1.pdf [41 KiB] HiDef png [92 KiB] Thumbnail [41 KiB] tex code |

|
|
Cross-section measured differentially in $ { J \mskip -3mu/\mskip -2mu\psi \mskip 2mu}$ rapidity. The first quoted uncertainty is statistical and the second systematic, where the luminosity component (correlated across all bins) has been removed. |
Table_2.pdf [44 KiB] HiDef png [96 KiB] Thumbnail [48 KiB] tex code |

|
Supplementary Material [file]


![HiDef png [228 KiB]](Directory_LHCb-CONF-2018-003/hidef_Fig1.png)
![HiDef png [229 KiB]](Directory_LHCb-CONF-2018-003/hidef_Fig2.png)
![HiDef png [366 KiB]](Directory_LHCb-CONF-2018-003/hidef_Fig3.png)
![HiDef png [128 KiB]](Directory_LHCb-CONF-2018-003/hidef_Fig4.png)
![HiDef png [215 KiB]](Directory_LHCb-CONF-2018-003/hidef_Fig3-guzey.png)
![HiDef png [257 KiB]](Directory_LHCb-CONF-2018-003/hidef_Fig3-goncalves.png)
![HiDef png [143 KiB]](Directory_LHCb-CONF-2018-003/hidef_Fig3-cepila.png)
![HiDef png [151 KiB]](Directory_LHCb-CONF-2018-003/hidef_Fig3-maentysaari.png)
![HiDef png [92 KiB]](Directory_LHCb-CONF-2018-003/hidef_Table_1.png)
![HiDef png [96 KiB]](Directory_LHCb-CONF-2018-003/hidef_Table_2.png)
![HiDef png [215 KiB]](Directory_LHCb-CONF-2018-003/supplementary/hidef_Fig1-S.png)
![HiDef png [257 KiB]](Directory_LHCb-CONF-2018-003/supplementary/hidef_Fig2-S.png)
![HiDef png [143 KiB]](Directory_LHCb-CONF-2018-003/supplementary/hidef_Fig3-S.png)
![HiDef png [145 KiB]](Directory_LHCb-CONF-2018-003/supplementary/hidef_Fig4-S.png)
Created on 27 April 2024.