Search for time-dependent $CP$ violation in $D^0 \to K^+ K^-$ and $D^0 \to \pi^+ \pi^-$ decays
[to restricted-access page]Abstract
A search for charge-parity ( $ C P$ ) violation in the time-dependent decay rates of $ D ^0 \rightarrow K ^+ K ^- $ and $ D ^0 \rightarrow \pi ^+ \pi ^- $ decays is reported. The data correspond to an integrated luminosity of $1.9\text{ fb} ^{-1} $ collected by the LHCb detector in 2015--2016 in $ p $ $ p $ collisions at a centre-of-mass energy of $13\text{ Te V} $. The flavour of the $ D ^0$ meson is inferred from the charge of the pion in $ D ^{*}(2010)^{+} \rightarrow D ^0 \pi ^+ $ decays. The asymmetries of the time-dependent decay rates of $ D ^0$ and $\overline{ D }{} {}^0$ decays, sensitive to $ C P$ violation in the mixing and in the interference between mixing and decay, are measured to be $ A_{\Gamma} ( K ^+ K ^- ) = (1.3 \pm 3.5 \pm 0.7)\times 10^{-4}$ and $ A_{\Gamma} (\pi ^+ \pi ^- ) = (11.3 \pm 6.9 \pm 0.8)\times 10^{-4}$, where the first uncertainties are statistical and the second are systematic.
Figures and captions
|
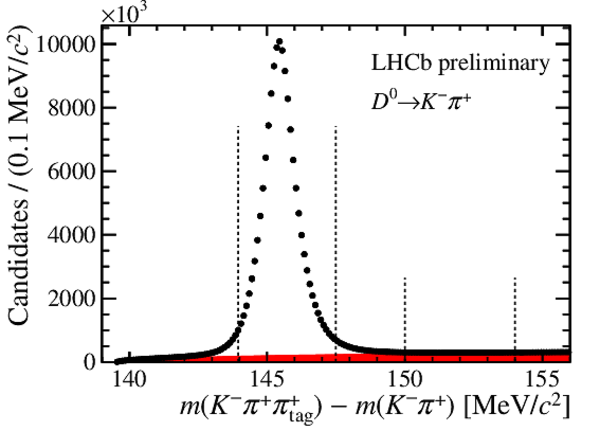
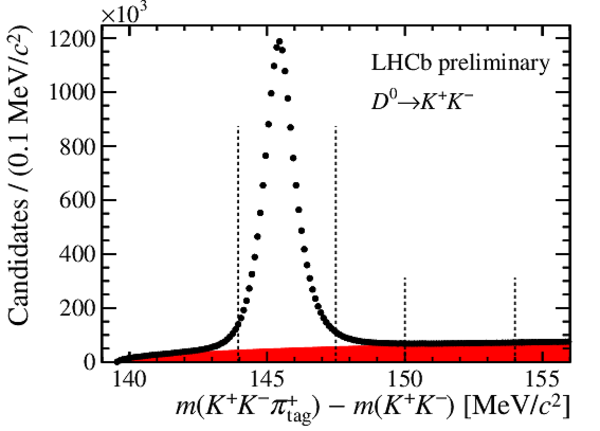
Distributions of $\Delta m$ for the (a) $ D ^0 \rightarrow K ^- \pi ^+ $ , (b) $ D ^0 \rightarrow K ^+ K ^- $ and (c) $ D ^0 \rightarrow \pi ^+ \pi ^- $ samples. The signal region and the region used for the sideband subtraction to remove the combinatorial background (red filled area) are delimited by the vertical dashed lines. |
Fig1a.pdf [32 KiB] HiDef png [171 KiB] Thumbnail [170 KiB] *.C file |
|
|
Fig1b.pdf [32 KiB] HiDef png [173 KiB] Thumbnail [172 KiB] *.C file |
|
|
|
Fig1c.pdf [32 KiB] HiDef png [172 KiB] Thumbnail [176 KiB] *.C file |

|
|
|
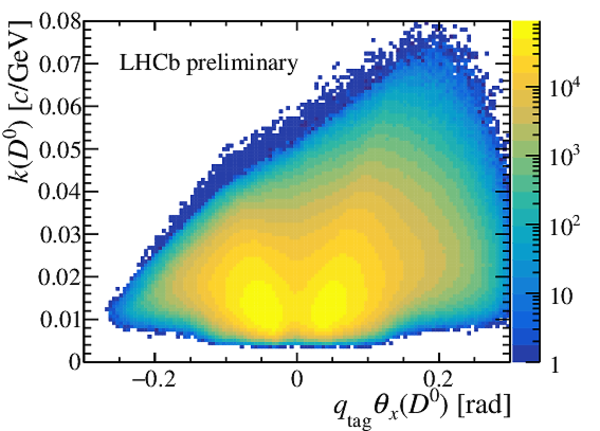
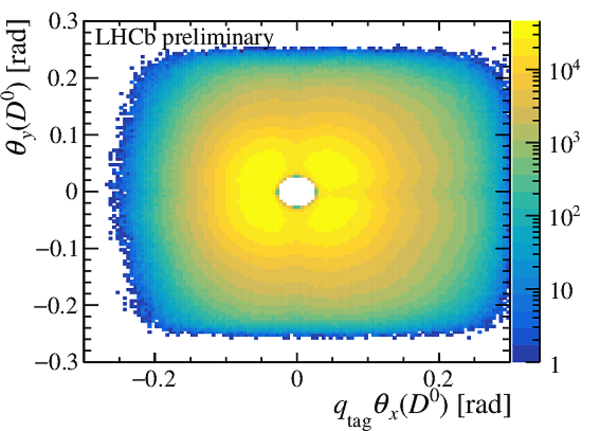
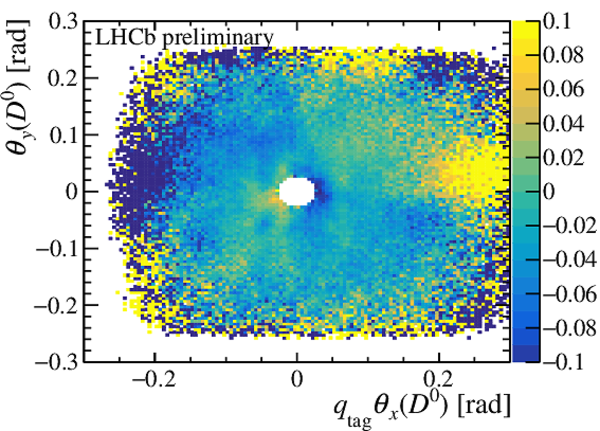
(Left) sum and (right) asymmetry of the distributions of $ D ^0$ and $\overline{ D }{} {}^0$ candidates, in (top) $ q_\text{tag} \theta_x$ versus $k$ and (bottom) $ q_\text{tag} \theta_x$ versus $\theta_y$ planes, for the 2016 Mag Up $ D ^0 \rightarrow K ^- \pi ^+ $ subsample. The angle $\theta_{x(y)} \equiv \arctan(p_{x(y)} / p_z)$ is the emission angle of the $ D ^0$ in the bending (vertical) plane, $k \equiv 1/\sqrt{p_x^2 + p_z^2}$ and $ q_\text{tag}$ is the sign of the charge of the tagging pion. |
Fig2a.pdf [46 KiB] HiDef png [840 KiB] Thumbnail [552 KiB] *.C file |
|
|
Fig2b.pdf [48 KiB] HiDef png [1 MiB] Thumbnail [652 KiB] *.C file |

|
|
|
Fig2c.pdf [59 KiB] HiDef png [1 MiB] Thumbnail [630 KiB] *.C file |
|
|
|
Fig2d.pdf [65 KiB] HiDef png [1 MiB] Thumbnail [771 KiB] *.C file |
|
|
|
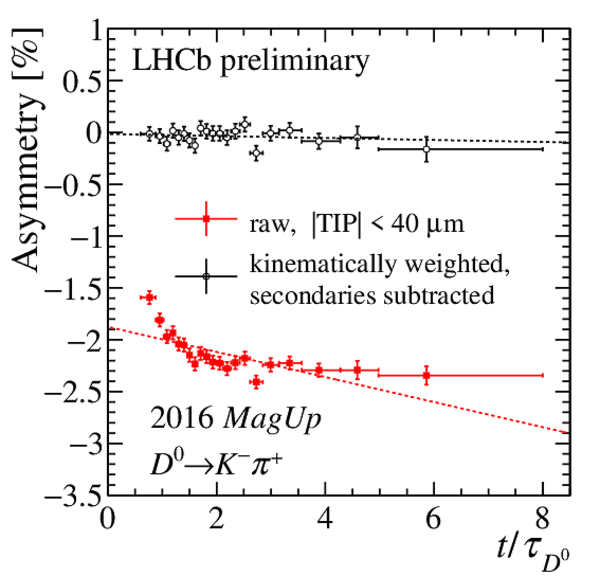
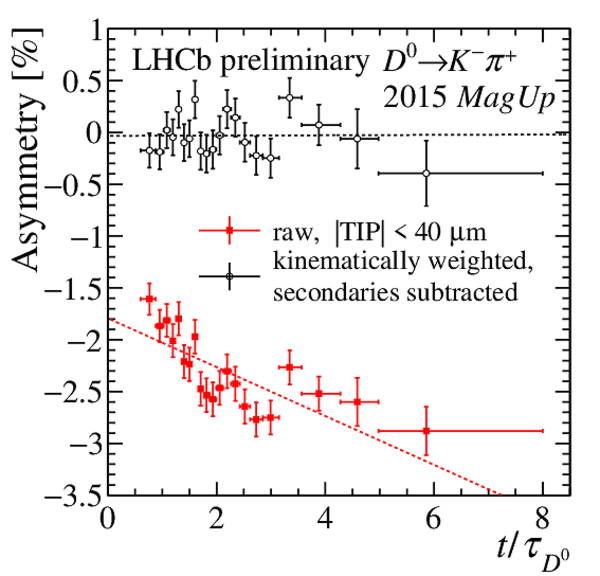
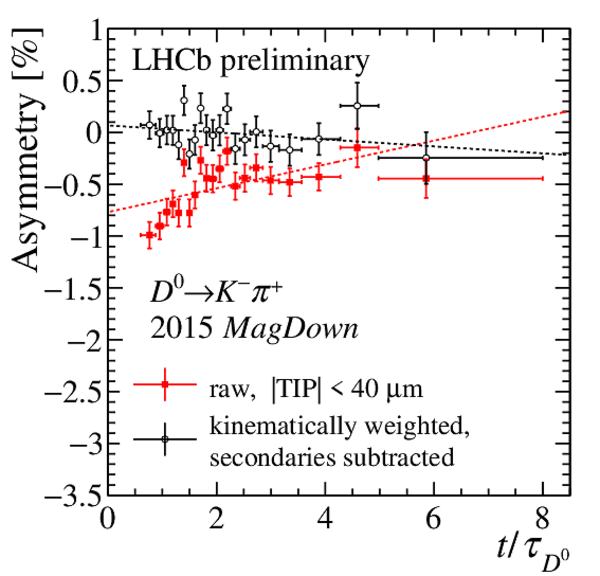
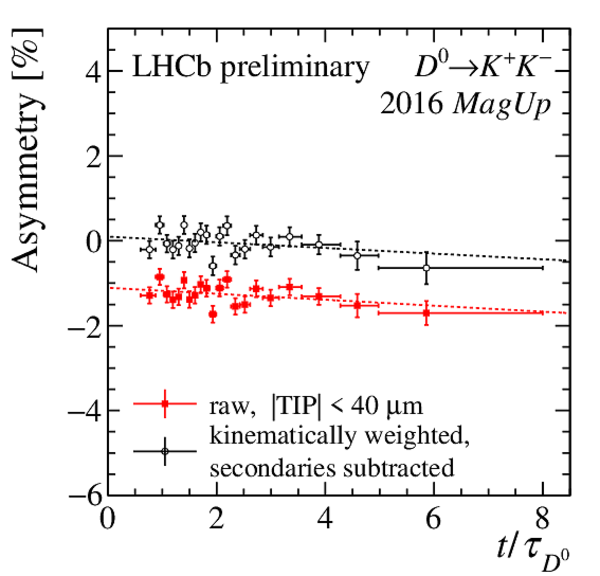
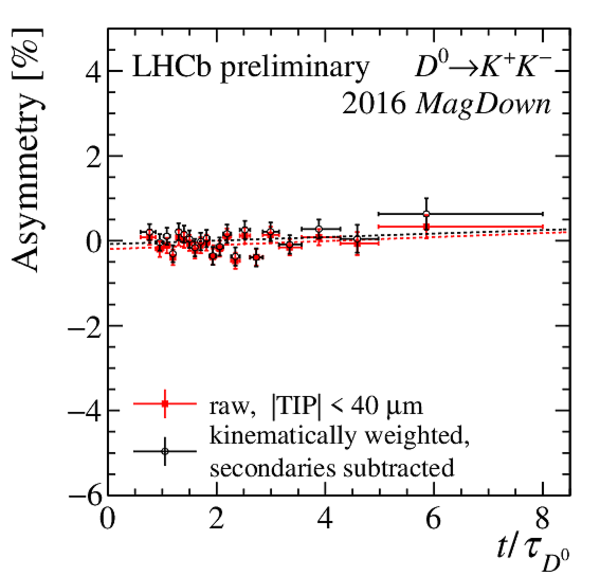
Fit to the time-dependent asymmetry of the $ D ^0 \rightarrow K ^- \pi ^+ $ sample (red) before the kinematic weighting of $ D ^0$ and $\overline{ D }{} {}^0$ candidates and the subtraction of secondary decays, but with a cut $\lvert\text{TIP}\rvert < 40 \upmu\text{m} $ to reduce their amount, and (black) after the kinematic weighting and the subtraction of secondary decays, for the (left) 2016 Mag Up and (right) 2016 MagDown subsamples. |
Fig3a.pdf [19 KiB] HiDef png [254 KiB] Thumbnail [246 KiB] *.C file |
|
|
Fig3b.pdf [19 KiB] HiDef png [250 KiB] Thumbnail [243 KiB] *.C file |

|
|
|
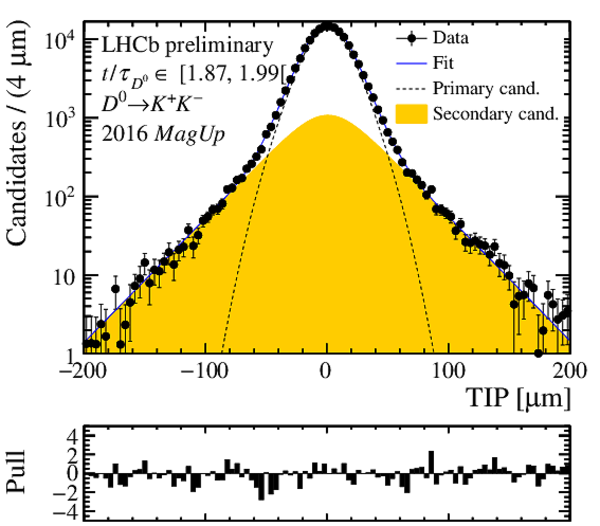
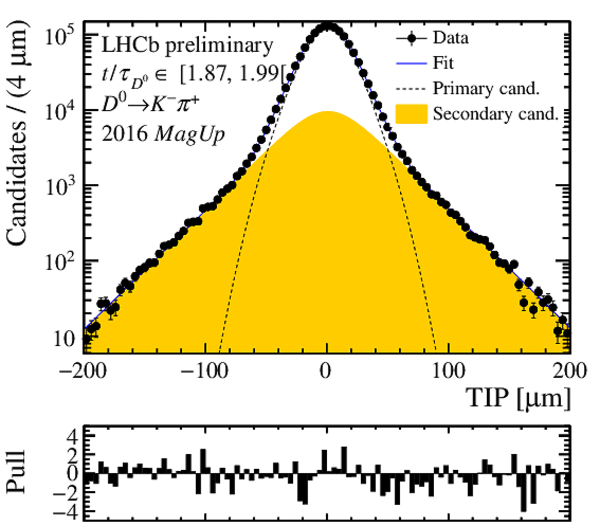
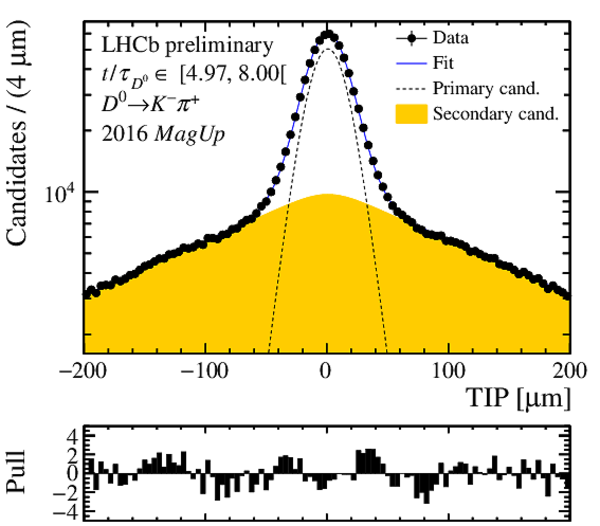
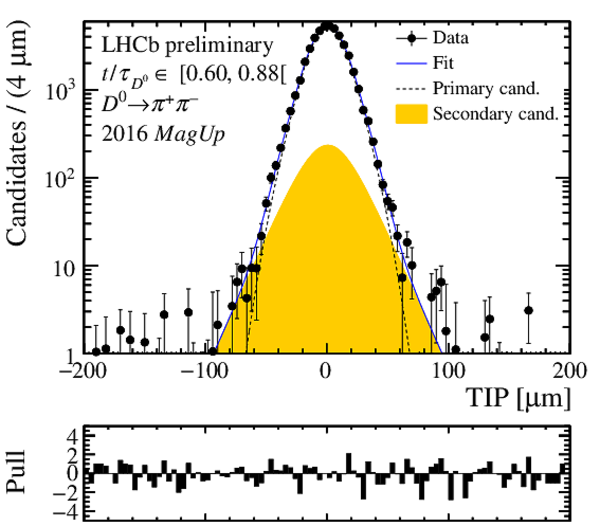
Transverse IP distributions of the $ D ^0 \rightarrow K ^+ K ^- $ 2016 Mag Up subsample for the $(a)$ first, $(b)$ middle and $(c)$ last time bin. The results of the fit are superimposed. |
Fig4a.pdf [25 KiB] HiDef png [262 KiB] Thumbnail [248 KiB] *.C file |

|
|
Fig4b.pdf [29 KiB] HiDef png [291 KiB] Thumbnail [268 KiB] *.C file |
|
|
|
Fig4c.pdf [28 KiB] HiDef png [252 KiB] Thumbnail [234 KiB] *.C file |

|
|
|
Fraction of secondary decays fitted to the TIP distribution (within the $\lvert \text{TIP} \rvert < 200 \upmu\text{m} $ range) as a function of decay time, for the $ D ^0 \rightarrow K ^- \pi ^+ $ 2016 Mag Up subsample. Black dots are the fractions of secondary decays returned by the baseline fit model, whereas other points correspond to alternative models used to assess systematic uncertainties on the measurement of $ A_{\Gamma}$ . Splines are drawn through the points. |
Fig5.pdf [18 KiB] HiDef png [198 KiB] Thumbnail [162 KiB] *.C file |

|
|
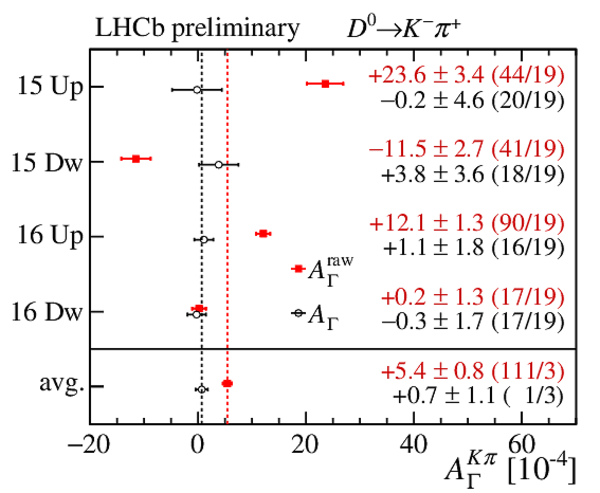
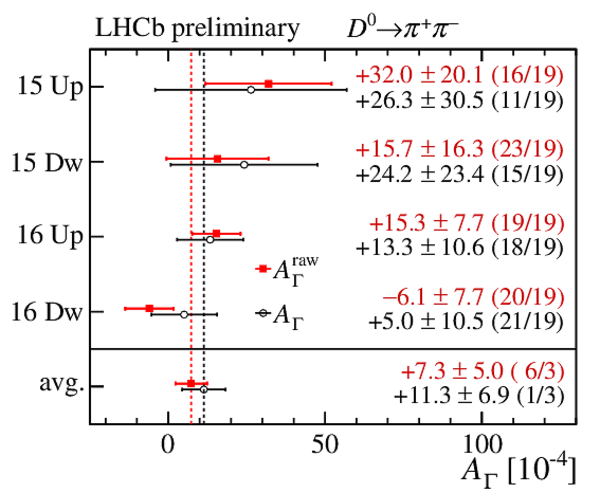
Results of the fits to the time-dependent asymmetry for each subsample, including their weighted average, labelled "avg.". In the labels, 2015 (2016) is abbreviated as 15 (16) and Mag Up ( MagDown ) is abbreviated as Up (Dw). Numerical values and fit qualities ( $\chi^2/\mathrm{ndf}$ ) are reported on the right of each plot. Solid red squares correspond to asymmetries measured before the kinematic weighting of $ D ^0$ and $\overline{ D }{} {}^0$ candidates and without the subtraction of secondary decays, which are suppressed with a cut $\lvert \text{TIP} \rvert < 40 \upmu\text{m} $ instead. Empty black dots correspond to asymmetries measured after the kinematic weighting and disentangling the asymmetry of primary decays in the fit to the TIP distributions in the $\lvert \text{TIP} \rvert < 200 \upmu\text{m} $ range. |
Fig6a.pdf [14 KiB] HiDef png [286 KiB] Thumbnail [227 KiB] *.C file |
|
|
Fig6b.pdf [14 KiB] HiDef png [282 KiB] Thumbnail [223 KiB] *.C file |

|
|
|
Fig6c.pdf [14 KiB] HiDef png [292 KiB] Thumbnail [233 KiB] *.C file |
|
|
|
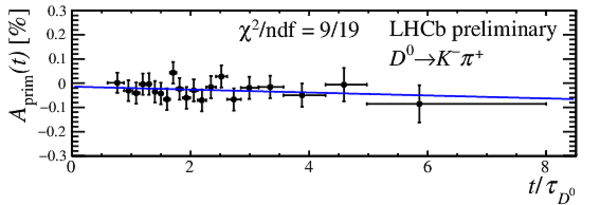
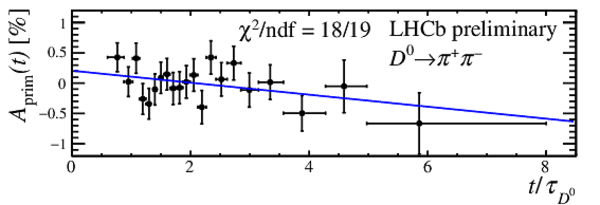
Measured asymmetry of the primary decays in bins of $t/\tau_{ D ^0 } $, where $\tau_{ D ^0 } = 0.410\text{ ps} $ \cite{PDG2018}, for (top) the $ D ^0 \rightarrow K ^- \pi ^+ $ , (centre) $ D ^0 \rightarrow K ^+ K ^- $ and (bottom) $ D ^0 \rightarrow \pi ^+ \pi ^- $ decay channels, averaged over the full 2015--2016 data sample. The solid lines show the linear fit, whose slope is equal to $- A_{\Gamma} $. |
Fig7a.pdf [16 KiB] HiDef png [107 KiB] Thumbnail [101 KiB] *.C file |
|
|
Fig7b.pdf [16 KiB] HiDef png [93 KiB] Thumbnail [90 KiB] *.C file |

|
|
|
Fig7c.pdf [16 KiB] HiDef png [106 KiB] Thumbnail [101 KiB] *.C file |
|
|
|
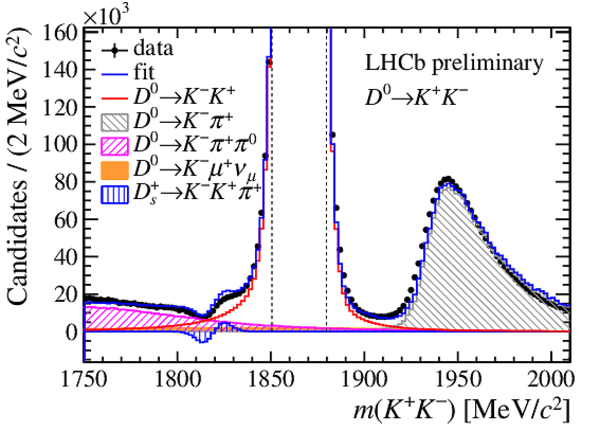
Template fit to the $m( h ^+ h ^- )$ distribution for the (left) $ D ^0 \rightarrow K ^+ K ^- $ and (right) $ D ^0 \rightarrow \pi ^+ \pi ^- $ samples after the $\Delta m$ sideband subtraction. The vertical dashed lines delimit the signal region. The $m( h ^+ h ^- )$ template of the $ D ^+_ s \rightarrow K ^+ K ^- \pi ^+ $ decay has a negative contribution to the left of the known $ D ^0$ mass due to the sideband subtraction. For $ D ^+_ s \rightarrow K ^+ K ^- \pi ^+ $ decays, $m( h ^+ h ^- )$ is nearly linearly correlated with $\Delta m$ . |
Fig8a.pdf [27 KiB] HiDef png [369 KiB] Thumbnail [328 KiB] *.C file |
|
|
Fig8b.pdf [22 KiB] HiDef png [335 KiB] Thumbnail [304 KiB] *.C file |

|
|
|
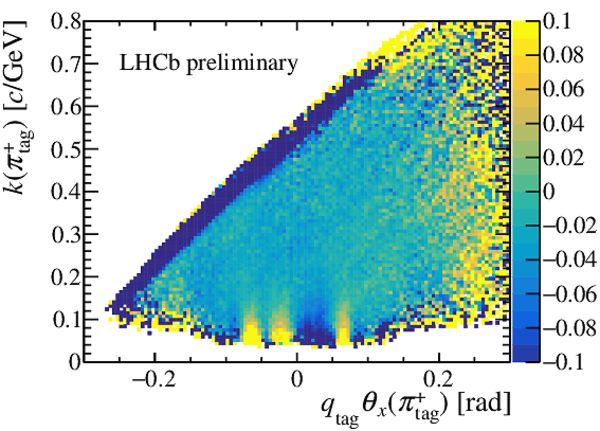
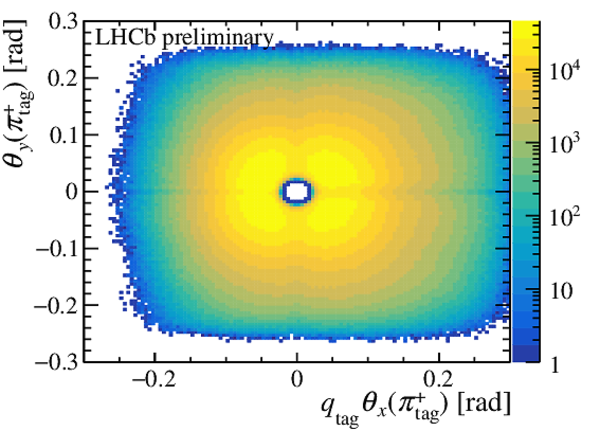
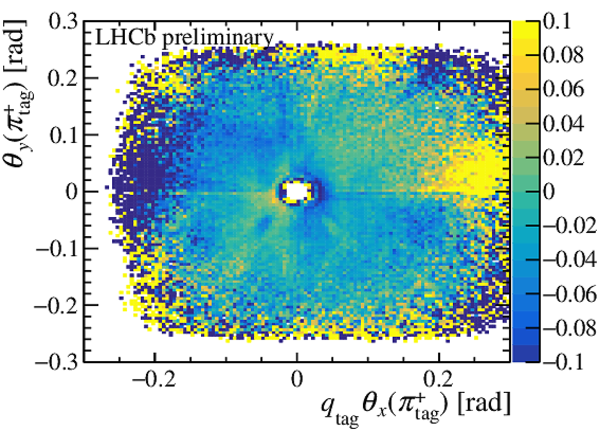
(Left) sum and (right) asymmetry of the distributions of the tagging pion of $ D ^0$ and $\overline{ D }{} {}^0$ candidates, in (top) $ q_\text{tag} \theta_x$ versus $k$ and (bottom) $ q_\text{tag} \theta_x$ versus $\theta_y$ planes, for the 2016 Mag Up $ D ^0 \rightarrow K ^- \pi ^+ $ subsample. The angle $\theta_{x(y)} \equiv \arctan(p_{x(y)} / p_z)$ is the emission angle of the $\pi ^{+}_{\mathrm{ \scriptscriptstyle tag}}$ in the bending (vertical) plane, $k \equiv 1/\sqrt{p_x^2 + p_z^2}$ is proportional to the curvature of the $\pi ^{+}_{\mathrm{ \scriptscriptstyle tag}}$ , and $ q_\text{tag}$ is the sign of its charge. |
Fig9a.pdf [46 KiB] HiDef png [799 KiB] Thumbnail [522 KiB] *.C file |

|
|
Fig9b.pdf [49 KiB] HiDef png [1 MiB] Thumbnail [633 KiB] *.C file |
|
|
|
Fig9c.pdf [60 KiB] HiDef png [1 MiB] Thumbnail [643 KiB] *.C file |
|
|
|
Fig9d.pdf [66 KiB] HiDef png [1 MiB] Thumbnail [785 KiB] *.C file |
|
|
|
Normalised distribution and asymmetry of the $ D ^0$ transverse momentum for (left) the 2016 Mag Up and (right) 2016 MagDown sample, for the $ D ^0 \rightarrow K ^- \pi ^+ $ decay mode. |
Fig10a.pdf [24 KiB] HiDef png [259 KiB] Thumbnail [256 KiB] *.C file |

|
|
Fig10b.pdf [24 KiB] HiDef png [262 KiB] Thumbnail [254 KiB] *.C file |

|
|
|
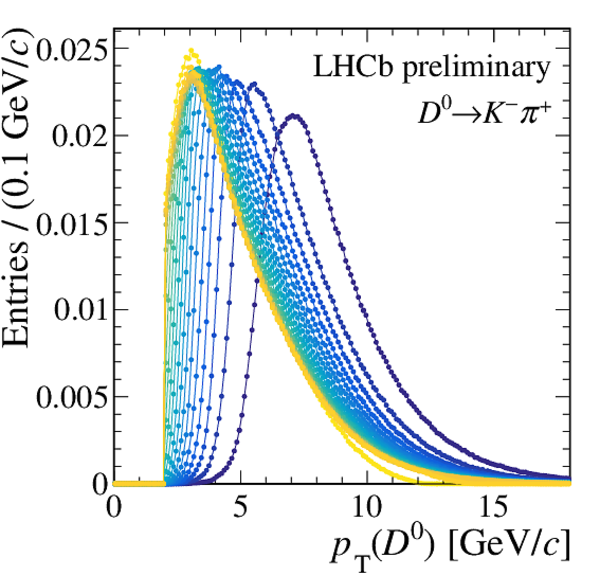
Normalised distributions of the measured transverse momentum of the $ D ^0$ in all bins of decay time. |
Fig11a.pdf [122 KiB] HiDef png [1 MiB] Thumbnail [459 KiB] *.C file |
|
|
Fig11b.pdf [14 KiB] HiDef png [271 KiB] Thumbnail [248 KiB] *.C file |
|
|
|
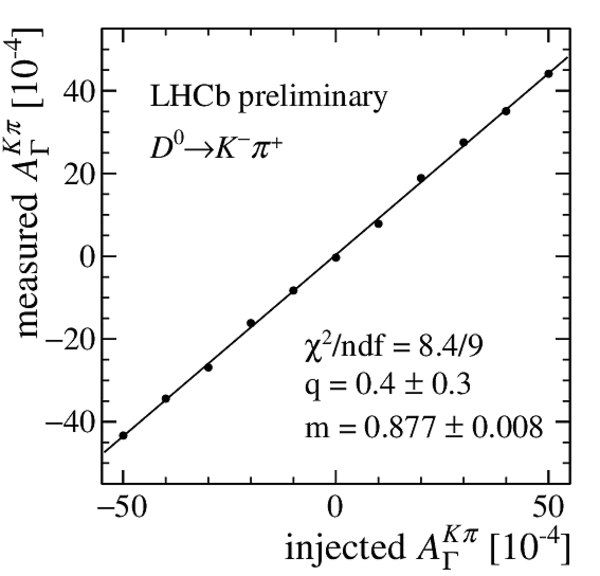
Effect of the kinematic weighting on the measured value of $ A_{\Gamma}$ . The measured value corresponds to $(87.7 \pm 0.8)\%$ of the artificial value injected in the $ D ^0 \rightarrow K ^- \pi ^+ $ sample. |
Fig12.pdf [14 KiB] HiDef png [141 KiB] Thumbnail [80 KiB] *.C file |
|
|
Transverse IP distributions of the $ D ^0 \rightarrow K ^- \pi ^+ $ 2016 Mag Up subsample for the (left) first, (centre) middle and (right) last time bin. The results of the fit are superimposed. |
Fig13a.pdf [27 KiB] HiDef png [278 KiB] Thumbnail [263 KiB] *.C file |

|
|
Fig13b.pdf [29 KiB] HiDef png [269 KiB] Thumbnail [254 KiB] *.C file |
|
|
|
Fig13c.pdf [28 KiB] HiDef png [230 KiB] Thumbnail [225 KiB] *.C file |
|
|
|
Transverse IP distributions of the $ D ^0 \rightarrow \pi ^+ \pi ^- $ 2016 Mag Up subsample for the (left) first, (centre) middle and (right) last time bin. The results of the fit are superimposed. |
Fig14a.pdf [24 KiB] HiDef png [261 KiB] Thumbnail [245 KiB] *.C file |
|
|
Fig14b.pdf [27 KiB] HiDef png [291 KiB] Thumbnail [272 KiB] *.C file |

|
|
|
Fig14c.pdf [28 KiB] HiDef png [306 KiB] Thumbnail [274 KiB] *.C file |

|
|
|
Fit to the time-dependent asymmetry of the $ D ^0 \rightarrow K ^- \pi ^+ $ sample (red) before the kinematic weighting of $ D ^0$ and $\overline{ D }{} {}^0$ candidates and the subtraction of secondary decays, but with a cut $\lvert\text{TIP}\rvert < 40 \upmu\text{m} $ to reduce their amount, and (black) after the kinematic weighting and the subtraction of secondary decays. The figures correspond to the (top) 2015 and (bottom) 2016 subsamples, and to the (left) Mag Up and (right) 2016 MagDown subsamples. |
Fig15a.pdf [19 KiB] HiDef png [259 KiB] Thumbnail [257 KiB] *.C file |
|
|
Fig15b.pdf [19 KiB] HiDef png [263 KiB] Thumbnail [258 KiB] *.C file |
|
|
|
Fig15c.pdf [19 KiB] HiDef png [254 KiB] Thumbnail [246 KiB] *.C file |

|
|
|
Fig15d.pdf [19 KiB] HiDef png [250 KiB] Thumbnail [243 KiB] *.C file |

|
|
|
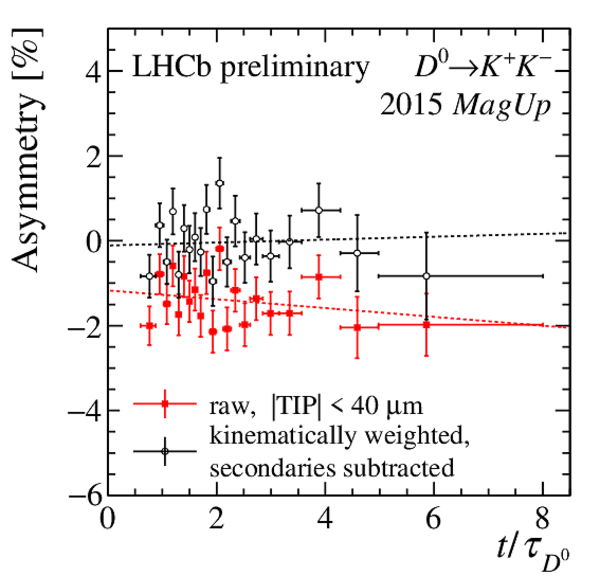
Fit to the time-dependent asymmetry of the $ D ^0 \rightarrow K ^+ K ^- $ sample (red) before the kinematic weighting of $ D ^0$ and $\overline{ D }{} {}^0$ candidates and the subtraction of secondary decays, but with a cut $\lvert\text{TIP}\rvert < 40 \upmu\text{m} $ to reduce their amount, and (black) after the kinematic weighting and the subtraction of secondary decays. The figures correspond to the (top) 2015 and (bottom) 2016 subsamples, and to the (left) Mag Up and (right) 2016 MagDown subsamples. |
Fig16a.pdf [18 KiB] HiDef png [248 KiB] Thumbnail [232 KiB] *.C file |
|
|
Fig16b.pdf [18 KiB] HiDef png [249 KiB] Thumbnail [227 KiB] *.C file |

|
|
|
Fig16c.pdf [18 KiB] HiDef png [240 KiB] Thumbnail [224 KiB] *.C file |
|
|
|
Fig16d.pdf [18 KiB] HiDef png [240 KiB] Thumbnail [211 KiB] *.C file |
|
|
|
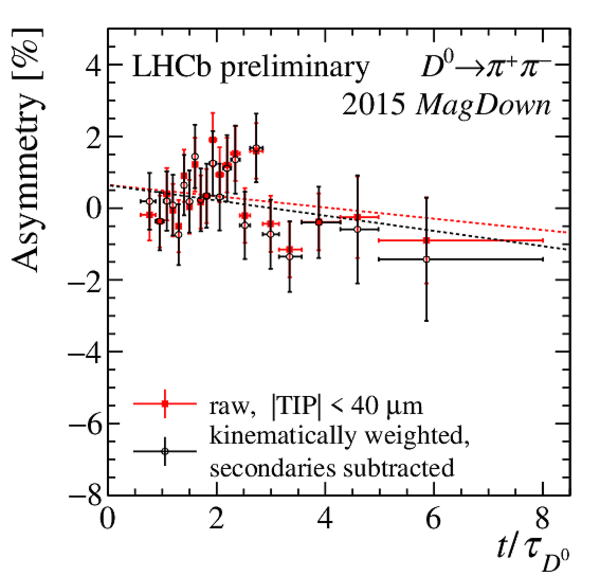
Fit to the time-dependent asymmetry of the $ D ^0 \rightarrow \pi ^+ \pi ^- $ sample (red) before the kinematic weighting of $ D ^0$ and $\overline{ D }{} {}^0$ candidates and the subtraction of secondary decays, but with a cut $\lvert\text{TIP}\rvert < 40 \upmu\text{m} $ to reduce their amount, and (black) after the kinematic weighting and the subtraction of secondary decays. The figures correspond to the (top) 2015 and (bottom) 2016 subsamples, and to the (left) Mag Up and (right) 2016 MagDown subsamples. |
Fig17a.pdf [19 KiB] HiDef png [257 KiB] Thumbnail [236 KiB] *.C file |

|
|
Fig17b.pdf [18 KiB] HiDef png [256 KiB] Thumbnail [230 KiB] *.C file |
|
|
|
Fig17c.pdf [18 KiB] HiDef png [243 KiB] Thumbnail [229 KiB] *.C file |

|
|
|
Fig17d.pdf [18 KiB] HiDef png [249 KiB] Thumbnail [221 KiB] *.C file |

|
|
|
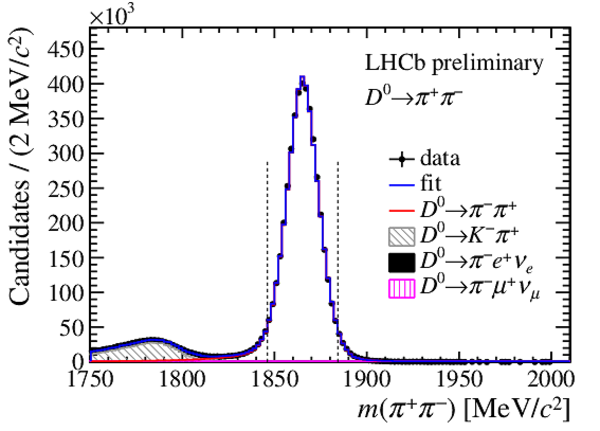
Template fit to the $m( h ^+ h ^- )$ distribution for the (top) $ D ^0 \rightarrow K ^+ K ^- $ and (bottom) $ D ^0 \rightarrow \pi ^+ \pi ^- $ samples. The vertical dashed lines delimit the signal region. |
Fig18a.pdf [24 KiB] HiDef png [269 KiB] Thumbnail [251 KiB] *.C file |

|
|
Fig18b.pdf [23 KiB] HiDef png [245 KiB] Thumbnail [235 KiB] *.C file |
|
|
|
Animated gif made out of all figures. |
CONF-2019-001.gif Thumbnail |

|
![HiDef png [171 KiB]](Directory_LHCb-CONF-2019-001/hidef_Fig1a.png)
![HiDef png [173 KiB]](Directory_LHCb-CONF-2019-001/hidef_Fig1b.png)
![HiDef png [172 KiB]](Directory_LHCb-CONF-2019-001/hidef_Fig1c.png)
![HiDef png [840 KiB]](Directory_LHCb-CONF-2019-001/hidef_Fig2a.png)
![HiDef png [1 MiB]](Directory_LHCb-CONF-2019-001/hidef_Fig2b.png)
![HiDef png [1 MiB]](Directory_LHCb-CONF-2019-001/hidef_Fig2c.png)
![HiDef png [1 MiB]](Directory_LHCb-CONF-2019-001/hidef_Fig2d.png)
![HiDef png [254 KiB]](Directory_LHCb-CONF-2019-001/hidef_Fig3a.png)
![HiDef png [250 KiB]](Directory_LHCb-CONF-2019-001/hidef_Fig3b.png)
![HiDef png [262 KiB]](Directory_LHCb-CONF-2019-001/hidef_Fig4a.png)
![HiDef png [291 KiB]](Directory_LHCb-CONF-2019-001/hidef_Fig4b.png)
![HiDef png [252 KiB]](Directory_LHCb-CONF-2019-001/hidef_Fig4c.png)
![HiDef png [198 KiB]](Directory_LHCb-CONF-2019-001/hidef_Fig5.png)
![HiDef png [286 KiB]](Directory_LHCb-CONF-2019-001/hidef_Fig6a.png)
![HiDef png [282 KiB]](Directory_LHCb-CONF-2019-001/hidef_Fig6b.png)
![HiDef png [292 KiB]](Directory_LHCb-CONF-2019-001/hidef_Fig6c.png)
![HiDef png [107 KiB]](Directory_LHCb-CONF-2019-001/hidef_Fig7a.png)
![HiDef png [93 KiB]](Directory_LHCb-CONF-2019-001/hidef_Fig7b.png)
![HiDef png [106 KiB]](Directory_LHCb-CONF-2019-001/hidef_Fig7c.png)
![HiDef png [369 KiB]](Directory_LHCb-CONF-2019-001/hidef_Fig8a.png)
![HiDef png [335 KiB]](Directory_LHCb-CONF-2019-001/hidef_Fig8b.png)
![HiDef png [799 KiB]](Directory_LHCb-CONF-2019-001/hidef_Fig9a.png)
![HiDef png [1 MiB]](Directory_LHCb-CONF-2019-001/hidef_Fig9b.png)
![HiDef png [1 MiB]](Directory_LHCb-CONF-2019-001/hidef_Fig9c.png)
![HiDef png [1 MiB]](Directory_LHCb-CONF-2019-001/hidef_Fig9d.png)
![HiDef png [259 KiB]](Directory_LHCb-CONF-2019-001/hidef_Fig10a.png)
![HiDef png [262 KiB]](Directory_LHCb-CONF-2019-001/hidef_Fig10b.png)
![HiDef png [1 MiB]](Directory_LHCb-CONF-2019-001/hidef_Fig11a.png)
![HiDef png [271 KiB]](Directory_LHCb-CONF-2019-001/hidef_Fig11b.png)
![HiDef png [141 KiB]](Directory_LHCb-CONF-2019-001/hidef_Fig12.png)
![HiDef png [278 KiB]](Directory_LHCb-CONF-2019-001/hidef_Fig13a.png)
![HiDef png [269 KiB]](Directory_LHCb-CONF-2019-001/hidef_Fig13b.png)
![HiDef png [230 KiB]](Directory_LHCb-CONF-2019-001/hidef_Fig13c.png)
![HiDef png [261 KiB]](Directory_LHCb-CONF-2019-001/hidef_Fig14a.png)
![HiDef png [291 KiB]](Directory_LHCb-CONF-2019-001/hidef_Fig14b.png)
![HiDef png [306 KiB]](Directory_LHCb-CONF-2019-001/hidef_Fig14c.png)
![HiDef png [259 KiB]](Directory_LHCb-CONF-2019-001/hidef_Fig15a.png)
![HiDef png [263 KiB]](Directory_LHCb-CONF-2019-001/hidef_Fig15b.png)
![HiDef png [254 KiB]](Directory_LHCb-CONF-2019-001/hidef_Fig15c.png)
![HiDef png [250 KiB]](Directory_LHCb-CONF-2019-001/hidef_Fig15d.png)
![HiDef png [248 KiB]](Directory_LHCb-CONF-2019-001/hidef_Fig16a.png)
![HiDef png [249 KiB]](Directory_LHCb-CONF-2019-001/hidef_Fig16b.png)
![HiDef png [240 KiB]](Directory_LHCb-CONF-2019-001/hidef_Fig16c.png)
![HiDef png [240 KiB]](Directory_LHCb-CONF-2019-001/hidef_Fig16d.png)
![HiDef png [257 KiB]](Directory_LHCb-CONF-2019-001/hidef_Fig17a.png)
![HiDef png [256 KiB]](Directory_LHCb-CONF-2019-001/hidef_Fig17b.png)
![HiDef png [243 KiB]](Directory_LHCb-CONF-2019-001/hidef_Fig17c.png)
![HiDef png [249 KiB]](Directory_LHCb-CONF-2019-001/hidef_Fig17d.png)
![HiDef png [269 KiB]](Directory_LHCb-CONF-2019-001/hidef_Fig18a.png)
![HiDef png [245 KiB]](Directory_LHCb-CONF-2019-001/hidef_Fig18b.png)
Tables and captions
|
Systematic uncertainties on the measurement of $ A_{\Gamma}$ , in units of $10^{-4}$. |
Table_1.pdf [63 KiB] HiDef png [43 KiB] Thumbnail [20 KiB] tex code |

|
![HiDef png [43 KiB]](Directory_LHCb-CONF-2019-001/hidef_Table_1.png)
Created on 27 April 2024.