Abstract
A search for the decay $ K ^0_{\mathrm{S}} \rightarrow\mu^{+}\mu^{-}$ is performed using proton-proton collision data, corresponding to an integrated luminosity of $5.6\text{ fb} ^{-1} $, collected with the LHCb experiment during 2016, 2017 and 2018 at a center-of-mass energy of $13 \mathrm{TeV}$. The observed number of signal decays is consistent with zero, yielding an upper limit of $ {\cal B}( K ^0_{\mathrm{S}} \rightarrow \mu^+\mu^-) < 2.2 (2.6)\times 10^{-10}$ at 90 (95)% CL. The limit reduces to $ {\cal B}( K ^0_{\mathrm{S}} \rightarrow \mu^+\mu^-) < 2.1 (2.4)\times 10^{-10}$ at 90 (95)% CL once combined with the full Run I dataset.
Figures and captions
|
Diagrams representing SM contributions to the $ K ^0_{\mathrm{S}} \rightarrow \mu^+\mu^-$ decay amplitude. (top) Long-distance contribution, generated by two intermediate photons, and (bottom) short-distance contributions. |
Fig1a.pdf [19 KiB] HiDef png [21 KiB] Thumbnail [10 KiB] |

|
|
Fig1b.pdf [27 KiB] HiDef png [28 KiB] Thumbnail [14 KiB] |

|
|
|
Fig1c.pdf [21 KiB] HiDef png [32 KiB] Thumbnail [15 KiB] |

|
|
|
Fig1d.pdf [20 KiB] HiDef png [37 KiB] Thumbnail [18 KiB] |

|
|
|
Mass distribution of $ K ^0_{\mathrm{S}} \rightarrow \pi^+\pi^-$ candidates in 2016 trigger-unbiased data (points with error-bars) and corrected simulation (solid histogram). |
Fig2.pdf [18 KiB] HiDef png [158 KiB] Thumbnail [151 KiB] |

|
|
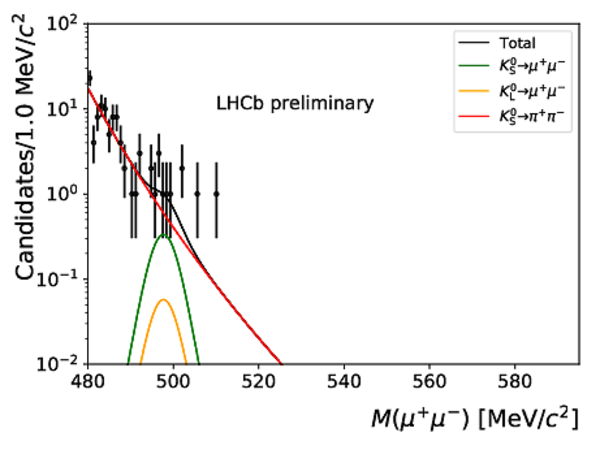
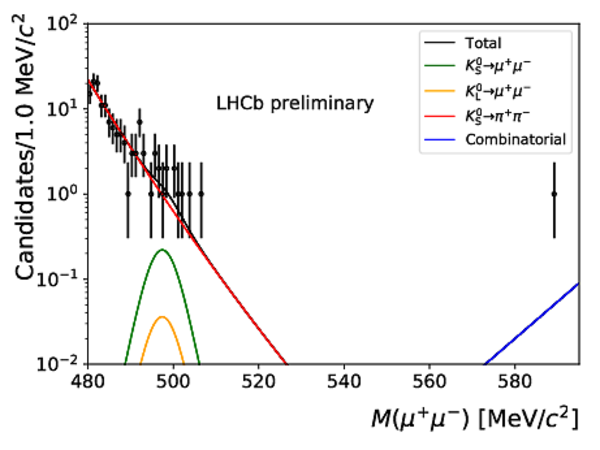
Projection of the fit to the dimuon mass distribution for (top) two TIS and (bottom) two xTOS BDT bins. These bins correspond to the BDT response with the lowest fraction of background. The green line shows the signal contribution, the orange line the $ K ^0_{\mathrm{L}} \rightarrow \mu^+\mu^-$ contribution, the red line the $ K ^0_{\mathrm{S}} \rightarrow \pi^+\pi^-$ contribution, the blue line the combinatorial background, and the black line the total $ p.d.f.$ |
Fig3a.pdf [20 KiB] HiDef png [211 KiB] Thumbnail [198 KiB] |

|
|
Fig3b.pdf [20 KiB] HiDef png [171 KiB] Thumbnail [167 KiB] |
|
|
|
Fig3c.pdf [20 KiB] HiDef png [184 KiB] Thumbnail [181 KiB] |
|
|
|
Fig3d.pdf [20 KiB] HiDef png [160 KiB] Thumbnail [157 KiB] |

|
|
|
$-2\Delta \log {\cal L}$, where ${\cal L}$ is the profile likelihood vs $ {\cal B}( K ^0_{\mathrm{S}} \rightarrow \mu^+\mu^-)$ . The blue line corresponds to the Run 2 result, the orange line to the Run 1 result and the green line shows the combination. The vertical line shows the location of the upper limit of the combined result at 90% confidence level. |
Fig4.pdf [20 KiB] HiDef png [164 KiB] Thumbnail [131 KiB] |

|
|
Animated gif made out of all figures. |
CONF-2019-002.gif Thumbnail |

|
![HiDef png [21 KiB]](Directory_LHCb-CONF-2019-002/hidef_Fig1a.png)
![HiDef png [28 KiB]](Directory_LHCb-CONF-2019-002/hidef_Fig1b.png)
![HiDef png [32 KiB]](Directory_LHCb-CONF-2019-002/hidef_Fig1c.png)
![HiDef png [37 KiB]](Directory_LHCb-CONF-2019-002/hidef_Fig1d.png)
![HiDef png [158 KiB]](Directory_LHCb-CONF-2019-002/hidef_Fig2.png)
![HiDef png [211 KiB]](Directory_LHCb-CONF-2019-002/hidef_Fig3a.png)
![HiDef png [171 KiB]](Directory_LHCb-CONF-2019-002/hidef_Fig3b.png)
![HiDef png [184 KiB]](Directory_LHCb-CONF-2019-002/hidef_Fig3c.png)
![HiDef png [160 KiB]](Directory_LHCb-CONF-2019-002/hidef_Fig3d.png)
![HiDef png [164 KiB]](Directory_LHCb-CONF-2019-002/hidef_Fig4.png)
Created on 27 April 2024.