Study of prompt $D^0$ meson production in $p$Pb at $\sqrt{s_{\mathrm{NN}}}= 8.16$ TeV at LHCb
[to restricted-access page]Abstract
The production of prompt $ D ^0 $ mesons in proton-lead collisions in the forward and backward configurations is studied. The data are collected with the LHCb detector at a center-of-mass energy per nucleon pair of $\sqrt{s_{\scriptscriptstyle\text{NN}}} =8.16\text{ Te V} $ and correspond to an integrated luminosity of $12.2\pm0.3\text{ nb} ^{-1} $ ($18.6\pm0.5\text{ nb} ^{-1} $) in the forward (backward) configuration. The integrated $ D ^0$ and $\overline{ D } {}^0$ cross-sections are measured to be $288.3\pm0.2 (\mathrm{stat.})\pm17.4 (\mathrm{syst.})\text{ mb} $ for the forward rapidity range $1.5<y^*<4$ and $308.9\pm0.1 (\mathrm{stat.})\pm30.5 (\mathrm{syst.})\text{ mb} $ for the backward range,$-5<y^*<-2.5$, in the $ p_{\mathrm{T}} $ interval from 0 to 16 $\text{ Ge V /}c$ . A suppression of $ D ^0$ production in the forward rapidity region relative to the backward rapidity is observed.
Figures and captions
|
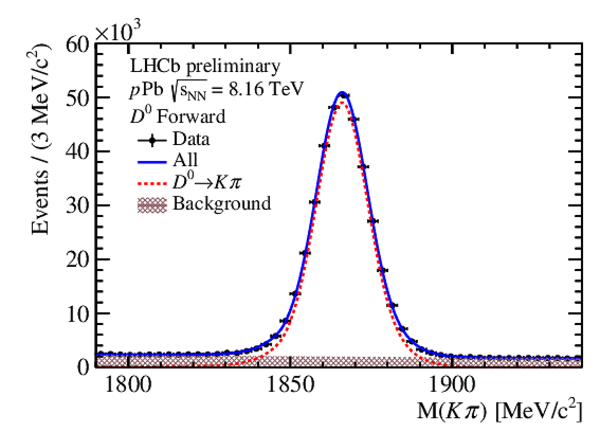
Fit to the $M( K \pi )$ distributions in the (left) forward and (right) backward collision configurations. The kinematic range is $2.0< p_{\mathrm{T}} <3.0\text{ Ge V /}c ,\ 3.0<y^*<3.5$ ($2.0< p_{\mathrm{T}} <3.0\text{ Ge V /}c ,\ -4.5<y^*<-4.0$) for the forward (backward) configuration. |
mass_c[..].pdf [23 KiB] HiDef png [320 KiB] Thumbnail [204 KiB] *.C file |
|
|
mass_c[..].pdf [23 KiB] HiDef png [422 KiB] Thumbnail [239 KiB] *.C file |

|
|
|
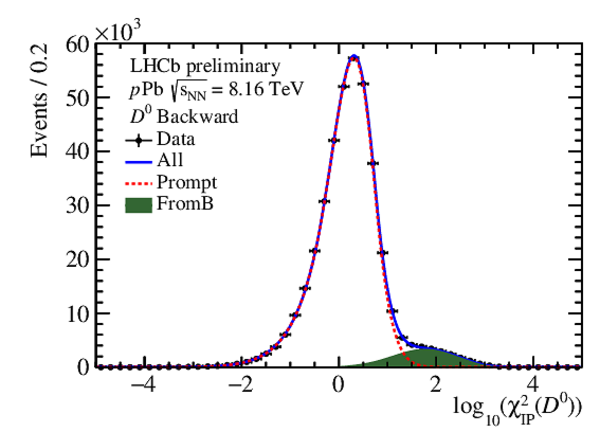
Fit to the $\log_{10}\chi^2_{\text{IP}}$ ( $ D ^0$ ) distributions in the (left) forward and (right) backward collision configurations. The kinematic range is $2.0< p_{\mathrm{T}} <3.0\text{ Ge V /}c ,\ 3.0<y^*<3.5$ ($2.0< p_{\mathrm{T}} <3.0\text{ Ge V /}c ,\ -4.5<y^*<-4.0$) for the forward (backward) configuration. |
ip_con[..].pdf [20 KiB] HiDef png [206 KiB] Thumbnail [160 KiB] *.C file |

|
|
ip_con[..].pdf [20 KiB] HiDef png [212 KiB] Thumbnail [163 KiB] *.C file |
|
|
|
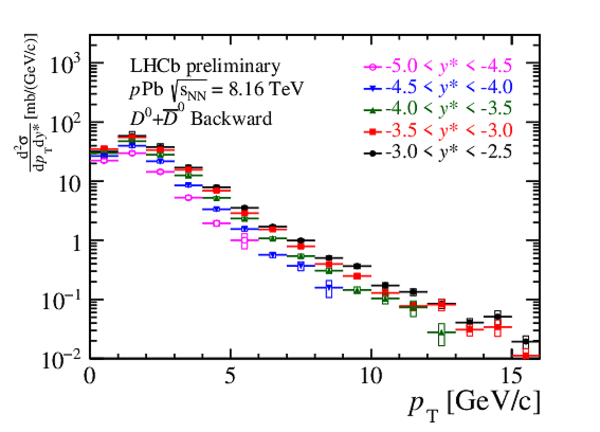
Double-differential cross-sections of prompt $ D ^0$ and $\overline{ D } {}^0$ mesons in $p$Pb collisions in the (left) forward and (right) backward collision configurations. The error bars are the statistical uncertainties while the boxes are the systematic uncertainties. |
X_conf_fwd.pdf [17 KiB] HiDef png [198 KiB] Thumbnail [168 KiB] *.C file |

|
|
X_conf_bwd.pdf [17 KiB] HiDef png [204 KiB] Thumbnail [176 KiB] *.C file |
|
|
|
Differential cross-sections of prompt $ D ^0$ and $\overline{ D } {}^0$ mesons in $p$Pb collisions as a function of (left) $ p_{\mathrm{T}}$ and (right) $y^{*}$ in the forward and backward configurations. The error bars are the statistical uncertainties while the boxes are the systematic uncertainties. |
1v.pdf [17 KiB] HiDef png [229 KiB] Thumbnail [205 KiB] *.C file |

|
|
2v.pdf [14 KiB] HiDef png [110 KiB] Thumbnail [103 KiB] *.C file |

|
|
|
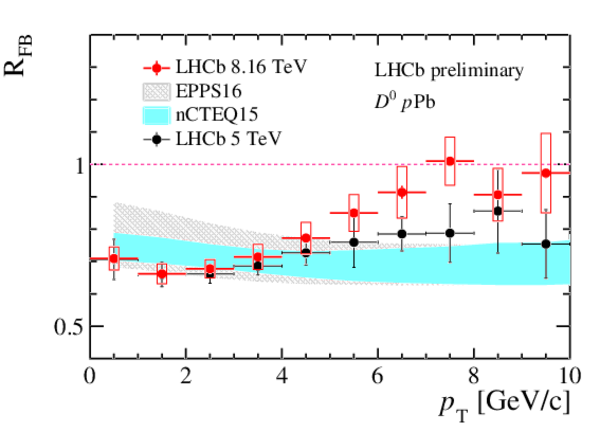
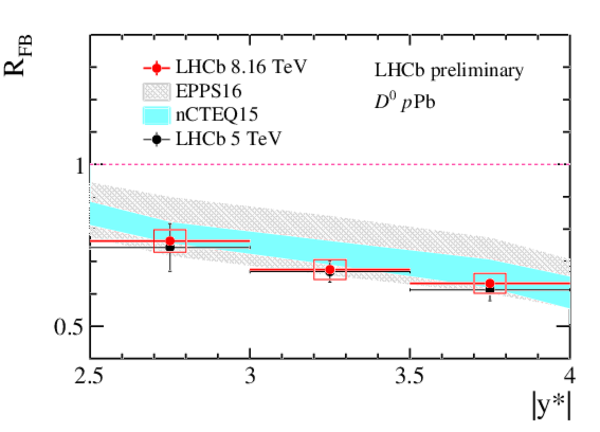
Forward and backward production ratio $R_{\mathrm{FB}}$ (left) as a function of $ p_{\mathrm{T}}$ integrated over common rapidity range $2.5 < |y^*| < 4.0$ for $ p_{\mathrm{T}} <7\text{ Ge V /}c $, over $2.5 < |y^*| < 3.5$ for $7< p_{\mathrm{T}} <9\text{ Ge V /}c $ and over $2.5<|y^*|<3.0$ for $9< p_{\mathrm{T}} <10\text{ Ge V /}c $, and (right) as a function of $y^*$ integrated up to $ p_{\mathrm{T}}$ = 16 $\text{ Ge V /}c$ . For the measurement at 8.16 $\text{ Te V}$ , the error bars mark statistical uncertainties and the boxes mark systematic uncertainties. At 5.02 $\text{ Te V}$ , the error bars represent the combined statistical and systematic uncertainties. The coloured bands mark the theoretical calculations using the HELAC-Onia generator, incorporating nPDFs EPPS16 (grey) and nCTEQ15 (blue). |
ratio_pt.pdf [18 KiB] HiDef png [319 KiB] Thumbnail [206 KiB] *.C file |
|
|
ratio_y.pdf [17 KiB] HiDef png [419 KiB] Thumbnail [242 KiB] *.C file |
|
|
|
Animated gif made out of all figures. |
CONF-2019-004.gif Thumbnail |

|
![HiDef png [320 KiB]](Directory_LHCb-CONF-2019-004/hidef_mass_conf_fwd.png)
![HiDef png [422 KiB]](Directory_LHCb-CONF-2019-004/hidef_mass_conf_bwd.png)
![HiDef png [206 KiB]](Directory_LHCb-CONF-2019-004/hidef_ip_conf_fwd.png)
![HiDef png [212 KiB]](Directory_LHCb-CONF-2019-004/hidef_ip_conf_bwd.png)
![HiDef png [198 KiB]](Directory_LHCb-CONF-2019-004/hidef_X_conf_fwd.png)
![HiDef png [204 KiB]](Directory_LHCb-CONF-2019-004/hidef_X_conf_bwd.png)
![HiDef png [229 KiB]](Directory_LHCb-CONF-2019-004/hidef_1v.png)
![HiDef png [110 KiB]](Directory_LHCb-CONF-2019-004/hidef_2v.png)
![HiDef png [319 KiB]](Directory_LHCb-CONF-2019-004/hidef_ratio_pt.png)
![HiDef png [419 KiB]](Directory_LHCb-CONF-2019-004/hidef_ratio_y.png)
Tables and captions
|
Summary of systematic uncertainties, in %. For the forward sample, the kinematic range is $1.5<y^*<4$ for $ p_{\mathrm{T}} <7\text{ Ge V /}c $, $1.5<y^*<3.5$ for $7< p_{\mathrm{T}} <9\text{ Ge V /}c $, $1.5<y^*<3$ for $9< p_{\mathrm{T}} <14\text{ Ge V /}c $ and $1.5<y^*<2.5$ for $14< p_{\mathrm{T}} <16\text{ Ge V /}c $. For the backward sample, the kinematic range is $-5<y^*<-2.5$ for $ p_{\mathrm{T}} <6\text{ Ge V /}c $, $-4.5<y^*<-2.5$ for $6< p_{\mathrm{T}} <9\text{ Ge V /}c $, $-4<y^*<-2.5$ for $9< p_{\mathrm{T}} <13\text{ Ge V /}c $ and $-3.5<y^*<-2.5$ for $13< p_{\mathrm{T}} <16\text{ Ge V /}c $. |
Table_1.pdf [68 KiB] HiDef png [99 KiB] Thumbnail [45 KiB] tex code |

|
|
Double differential cross-section $\frac{\mathrm{d}^2 \sigma}{\mathrm{d} p_{\mathrm{T}} \mathrm{d} y^*} \left[\text{ mb} /(\text{ Ge V /}c )\right]$ for prompt $ D ^0$ and $\overline{ D } {}^0$ mesons as functions of $ p_{\mathrm{T}}$ and $|y^{*}|$ in $p$Pb forward and backward data, respectively. The first uncertainty is statistical, the second is the component of the systematic uncertainty that is uncorrelated between bins and the third is the correlated component. |
Table_2.pdf [64 KiB] HiDef png [259 KiB] Thumbnail [96 KiB] tex code |

|
|
Differential cross-section $\frac{\mathrm{d}\sigma}{\mathrm{d} p_{\mathrm{T}} } [\text{ mb} /(\text{ Ge V /}c )]$ for prompt $ D ^0 $ and $\overline{ D } {}^0$ mesons as a function of $ p_{\mathrm{T}} $ in $p$Pb forward and backward data, respectively. The first uncertainty is statistical, the second is the component of the systematic uncertainty that is uncorrelated across bins and the third is the correlated component. |
Table_3.pdf [69 KiB] HiDef png [431 KiB] Thumbnail [222 KiB] tex code |

|
|
Differential cross-section $\frac{\mathrm{d} \sigma}{\mathrm{d} y^*} [\text{ mb} ]$ for prompt $ D ^0 $ and $\overline{ D } {}^0$ mesons as a function of $y^{*}$ in $p$Pb forward and backward data, respectively. The first uncertainty is statistical, the second is the component of the systematic uncertainty that is uncorrelated between bins and the third is the correlated component. |
Table_4.pdf [67 KiB] HiDef png [176 KiB] Thumbnail [89 KiB] tex code |

|
|
Forward and backward production ratio $R_{\mathrm{FB}}$ in different $ p_{\mathrm{T}}$ bins integrated over the common rapidity range $2.5 < |y^*| < 4.0$ for $ p_{\mathrm{T}} <7\text{ Ge V /}c $ and over $2.5 < |y^*| < 3.5$ for $7< p_{\mathrm{T}} <10\text{ Ge V /}c $, and in different $y^*$ bins integrated up to $ p_{\mathrm{T}}$ = 16 $\text{ Ge V /}c$ . The first uncertainty is the statistical and the second is the systematic component. |
Table_5.pdf [58 KiB] HiDef png [212 KiB] Thumbnail [102 KiB] tex code |

|
![HiDef png [99 KiB]](Directory_LHCb-CONF-2019-004/hidef_Table_1.png)
![HiDef png [259 KiB]](Directory_LHCb-CONF-2019-004/hidef_Table_2.png)
![HiDef png [431 KiB]](Directory_LHCb-CONF-2019-004/hidef_Table_3.png)
![HiDef png [176 KiB]](Directory_LHCb-CONF-2019-004/hidef_Table_4.png)
![HiDef png [212 KiB]](Directory_LHCb-CONF-2019-004/hidef_Table_5.png)
Created on 27 April 2024.