Combination of the ATLAS, CMS and LHCb results on the $B^0_{(s)} \to \mu^+ \mu^-$ decays
[to restricted-access page]Abstract
A combination of results on the rare $B^0_{s} \to \mu^+ \mu^-$ and $B^0 \to \mu^+ \mu^-$ decays from the ATLAS, CMS, and LHCb experiments using data collected at the Large Hadron Collider between 2011 and 2016, is presented. The $B^0_{s} \to \mu^+ \mu^-$ branching fraction is obtained to be $\left( 2.69 ^{+ 0.37}_{- 0.35} \right) \times 10^{-9}$ and the effective lifetime of the $B^0_{s} \to \mu^+ \mu^-$ decay is measured to be $\tau_{B^0_{s} \to \mu^+ \mu^-} = 1.91^{+0.37}_{-0.35} \rm{ps}$. An upper limit on the $B^0 \to \mu^+ \mu^-$ branching fraction is evaluated to be $\mathcal{B}(B^0 \to \mu^+ \mu^-) < 1.6 (1.9)\times 10^{-10}$ at 90 (95) confidence level. An upper limit on the ratio of the $B^0 \to \mu^+ \mu^-$ and $B^0_{s} \to \mu^+ \mu^-$ branching fractions is obtained to be $0.052 (0.060)$ at 90 (95) confidence level.
Figures and captions
|
In the left-hand plot, the two-dimensional likelihood contours of the results for the $ B ^0_ s \rightarrow \mu^+\mu^-$ and $ B ^0 \rightarrow \mu^+\mu^-$ decays for the three experiments are shown together with their combination. The dataset used was collected from 2011 to 2016. The red dashed line represents the ATLAS experiment, the green dot-dashed line the CMS experiment, the blue long-dashed line the LHCb experiment and the continuous line their combination. For each experiment and for the combination, likelihood contours correspond to the values of $-2 \Delta \mathrm{ln} \mathcal{L} = $ 2.3, 6.2, and 11.8, respectively. In the right-hand plot, the combination of the three experiments is shown with contours of different shades. Likelihood contours correspond to the values of $-2\Delta \mathrm{ln} \mathcal{L} = $ 2.3, 6.2, 11.8, 19.3, and 30.2, represented in order by darkest to less dark colour. In both plots, the red point shows the SM predictions with their uncertainties. The published results from the three experiments are detailed in Ref. [1,2,3]. |
Fig1a.pdf [56 KiB] HiDef png [417 KiB] Thumbnail [288 KiB] *.C file |

|
|
Fig1b.pdf [99 KiB] HiDef png [371 KiB] Thumbnail [221 KiB] *.C file |

|
|
|
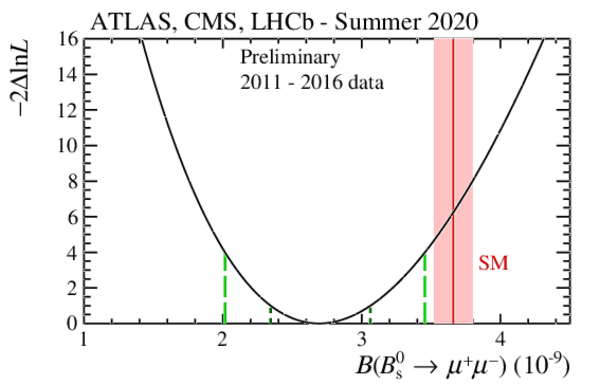
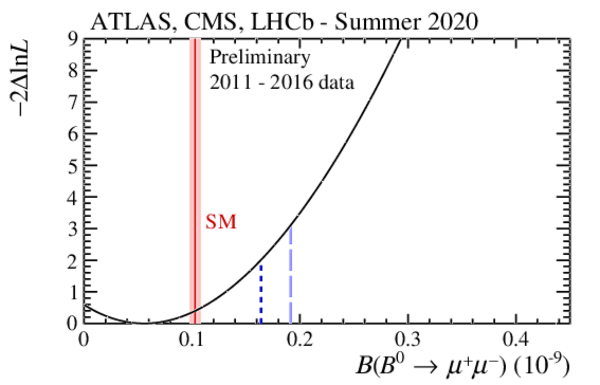
Value of $-2 \Delta \mathrm{ln} \mathcal{L}$ for $ {\cal B}( B ^0_ s \rightarrow \mu^+\mu^- )$ (left) and $ {\cal B}( B ^0 \rightarrow \mu^+\mu^- )$ (right), shown in both as solid black line. In the left-hand plot, the dark (light) green dashed lines represent the $1\sigma$ ($2\sigma$) interval. In the right-hand plot, the dark (light) blue dashed lines represent the 90% (95%) CL. In both plots, the red solid band shows the SM prediction with its uncertainty. The published results from the three experiments are detailed in Ref. [1,2,3]. |
Fig2a.pdf [20 KiB] HiDef png [200 KiB] Thumbnail [156 KiB] *.C file |
|
|
Fig2b.pdf [19 KiB] HiDef png [194 KiB] Thumbnail [158 KiB] *.C file |
|
|
|
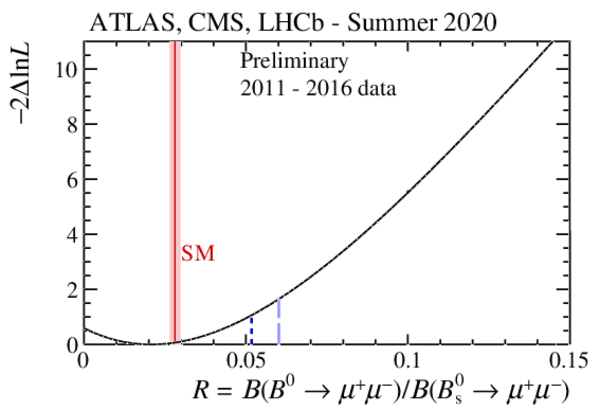
Value of $-2 \Delta \mathrm{ln} \mathcal{L}$ for the ratio of the $ B ^0 \rightarrow \mu^+\mu^-$ and $ B ^0_ s \rightarrow \mu^+\mu^-$ branching fractions, $\mathcal{R}$, shown as solid black line. The light (dark) blue dashed line represents the 90% (95%) CL and the red solid band shows the SM prediction with its uncertainty. The published results from the three experiments are detailed in Ref. [1,2,3]. |
Fig3.pdf [75 KiB] HiDef png [198 KiB] Thumbnail [149 KiB] *.C file |
|
|
Value of $-2 \Delta \mathrm{ln} \mathcal{L}$ for the combination of CMS and LHCb measurements [2,3] of the $ B ^0_ s \rightarrow \mu^+\mu^-$ effective lifetime, shown as solid black line. The dark and light green dashed lines represent the intervals corresponding to $-2 \Delta \mathrm{ln} \mathcal{L} = $1 and 4, respectively, and the red solid band shows the SM prediction with its uncertainty. |
Fig4.pdf [20 KiB] HiDef png [183 KiB] Thumbnail [148 KiB] *.C file |

|
|
Animated gif made out of all figures. |
CONF-2020-002.gif Thumbnail |

|
![HiDef png [417 KiB]](Directory_LHCb-CONF-2020-002/hidef_Fig1a.png)
![HiDef png [371 KiB]](Directory_LHCb-CONF-2020-002/hidef_Fig1b.png)
![HiDef png [200 KiB]](Directory_LHCb-CONF-2020-002/hidef_Fig2a.png)
![HiDef png [194 KiB]](Directory_LHCb-CONF-2020-002/hidef_Fig2b.png)
![HiDef png [198 KiB]](Directory_LHCb-CONF-2020-002/hidef_Fig3.png)
![HiDef png [183 KiB]](Directory_LHCb-CONF-2020-002/hidef_Fig4.png)
Created on 27 April 2024.