Abstract
The first observation at the LHCb experiment of hypertritons and antihypertritons is reported. The dataset consists of $ p p $ collisions at $\sqrt{s} =13\text{ Te V} $, collected between 2016 and 2018 and corresponding to an integrated luminosity of 5.5 $\text{ fb} ^{-1}$ . The hypertritons are reconstructed via the two-body decay $ ^3_{\Lambda }\rm H \rightarrow ^3{\rm He} \pi ^- $ and its charge conjugate. The helium nuclei are identified with an innovative technique at LHCb that exploits ionisation losses in the silicon detectors, as well as information from the Outer Tracker and RICH detectors. By requiring such helium tracks to form a well-defined vertex together with a pion, a total of $107\pm11$ hypertriton decays are found. This observation opens the door to a rich programme of precise measurements of QCD and astrophysics interest to be performed on the available data.
Figures and captions
|
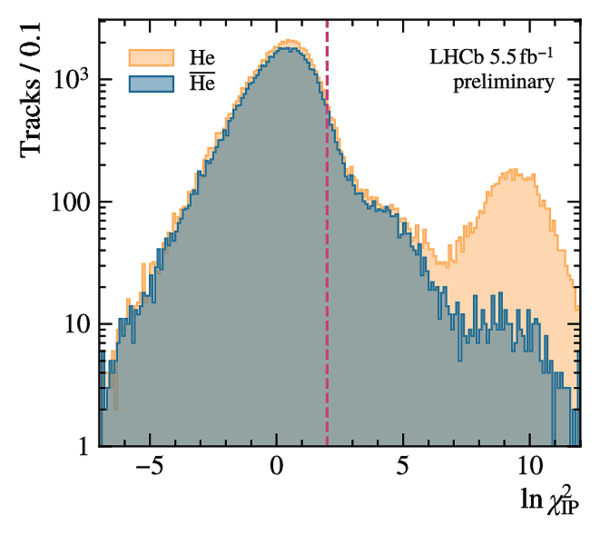
Left: Distribution of log-likelihood discriminators from the LHCb TT ( $\Lambda_{\rm LD}^{\rm TT }$ ) and VELO ( $\Lambda_{\rm LD}^{\rm VELO }$ ) silicon trackers, used for helium identification [18]. The yield of each bin is indicated by the colour bar. A large sample of $1.1\times10^5$ prompt helium candidates is clearly separated from the background in region A (delimited by green dashed lines). Right: Distribution of $\chi^2_{\text{IP}}$ , defined in the main body, of helium (orange) and antihelium (blue) tracks from data [18]. The larger contribution of $ ^3{\rm He}$ tracks compared to $ ^3\overline{\rm He}$ tracks at large $\ln\chi^2_{\text{IP}} $ is attributed to production in material interactions. The lower cut applied to select hypertriton candidates is shown in red. |
Fig1a.pdf [84 KiB] HiDef png [1 MiB] Thumbnail [411 KiB] *.C file |

|
|
Fig1b.pdf [20 KiB] HiDef png [244 KiB] Thumbnail [174 KiB] *.C file |
|
|
|
Distributions of hypertriton candidates in (left) mass and flight distance, as well as (right) mass and impact parameter significance. The dashed lines depict requirements in the selection. The orange dots depict selected candidates. |
Fig2a.pdf [25 KiB] HiDef png [429 KiB] Thumbnail [249 KiB] *.C file |

|
|
Fig2b.pdf [74 KiB] HiDef png [933 KiB] Thumbnail [448 KiB] *.C file |

|
|
|
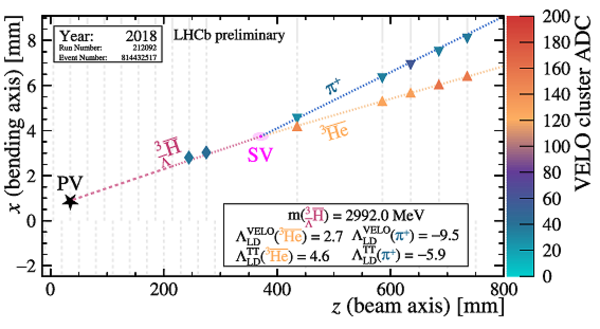
Candidate $ ^3_{\overline\Lambda }\overline{\rm H} \rightarrow ^3\overline{\rm He} \pi ^+ $ decay displayed in the $(z, x)$ plane inside the VELO , showing the antihypertriton (purple), antihelium (orange), and pion (blue) tracks. Their associated reconstructed clusters in each VELO module (grey) are depicted by diamonds, up-pointing triangles, and down-pointing triangles, respectively. The linestyle of the antihypertriton changes from dashed to dotted once it enters the instrumented volume of the VELO . Their colour represents the cluster amplitude in ADC counts, which differs significantly between $Z=1$ and $Z=2$ particles. The primary and secondary vertices are also depicted, alongside the $\pm1 \sigma$ interval on the latter's position. |
Fig3.pdf [55 KiB] HiDef png [332 KiB] Thumbnail [281 KiB] *.C file |
|
|
Invariant-mass distribution of hypertriton and antihypertriton candidates. The models for signal (red) and background (green) are described in the text. Same-sign data are shown in green to cross-check the background level. |
Fig4.pdf [24 KiB] HiDef png [227 KiB] Thumbnail [151 KiB] *.C file |

|
|
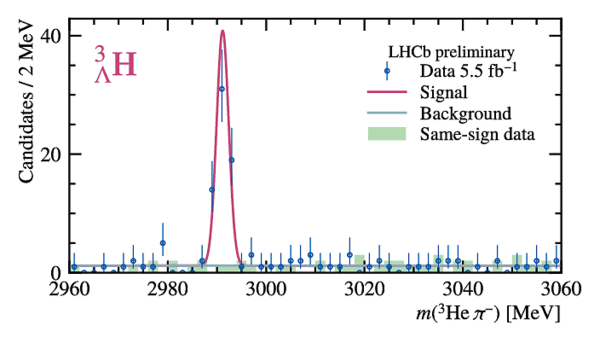
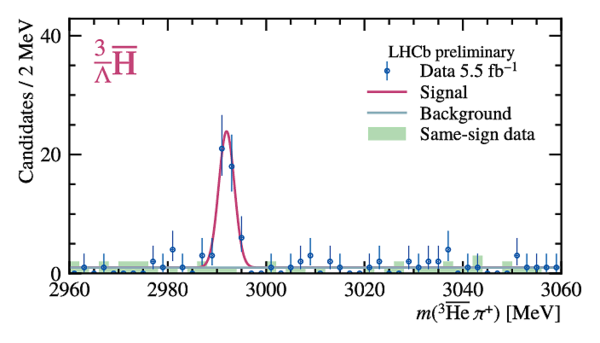
Invariant-mass distribution of hypertriton (top) and antihypertriton (bottom) candidates. The models for signal (red) and background (green) are described in the main body. Same-sign data are shown in green to cross-check the background level. |
Fig5a.pdf [25 KiB] HiDef png [232 KiB] Thumbnail [153 KiB] *.C file |
|
|
Fig5b.pdf [25 KiB] HiDef png [205 KiB] Thumbnail [144 KiB] *.C file |
|
|
|
Animated gif made out of all figures. |
CONF-2023-002.gif Thumbnail |

|
![HiDef png [1 MiB]](Directory_LHCb-CONF-2023-002/hidef_Fig1a.png)
![HiDef png [244 KiB]](Directory_LHCb-CONF-2023-002/hidef_Fig1b.png)
![HiDef png [429 KiB]](Directory_LHCb-CONF-2023-002/hidef_Fig2a.png)
![HiDef png [933 KiB]](Directory_LHCb-CONF-2023-002/hidef_Fig2b.png)
![HiDef png [332 KiB]](Directory_LHCb-CONF-2023-002/hidef_Fig3.png)
![HiDef png [227 KiB]](Directory_LHCb-CONF-2023-002/hidef_Fig4.png)
![HiDef png [232 KiB]](Directory_LHCb-CONF-2023-002/hidef_Fig5a.png)
![HiDef png [205 KiB]](Directory_LHCb-CONF-2023-002/hidef_Fig5b.png)
Created on 27 April 2024.