Information
LHCb-DP-2011-001
arXiv:1009.1963 [PDF]
(Submitted on 10 Sep 2010)
JINST 5:P10003,2010
Inspire 867647
Tools
Abstract
The LHCb Muon system performance is presented using cosmic ray events collected in 2009. These events allowed to test and optimize the detector configuration before the LHC start. The space and time alignment and the measurement of chamber efficiency, time resolution and cluster size are described in detail. The results are in agreement with the expected detector performance.
Figures and captions
|
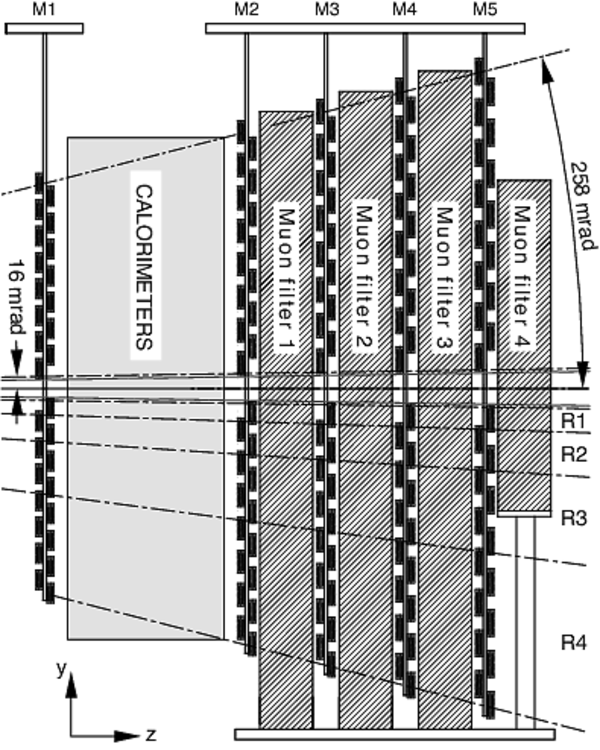
Side view of the LHCb muon system. The LHCb reference system is a right-handed coordinate system with the nominal collision point at the origin, with the $z$ axis defined by the beam axis and directed from the VELO to the muon system. |
sidev2new.eps [1 MiB] HiDef png [1 MiB] Thumbnail [411 KiB] |
|
|
Left: front view of a quadrant of a muon station. Each rectangle represents one chamber. Each station contains 276 chambers. Right: division into logical pads of four chambers belonging to the four regions of station M1. In each region of stations M2-M3 (M4-M5) the number of pad columns per chamber is double (half) the number in the corresponding region of station M1, while the number of pad rows per chamber is the same. |
statio[..].eps [397 KiB] HiDef png [225 KiB] Thumbnail [146 KiB] |

|
|
Cross section of a wire chamber showing the four gas gaps and the connection to the readout electronics. SPB: Spark Protection Board; {\sc cardiac}: FE Electronics Board. In this case the hardwired OR forming the two double gaps (see text) is achieved in the SPB. |
CERN_ROnew.eps [498 KiB] HiDef png [1 MiB] Thumbnail [522 KiB] |

|
|
Front view of one quadrant of stations M2 and M3 showing the partitioning into sectors. In one sector of each region a horizontal and a vertical strip are shown. The intersection of a horizontal and a vertical strip defines a logical pad (see text). A Sector of region R1 (R2, R3, R4) contains 8 (4, 4, 4) horizontal strips and 6 (12, 24, 24) vertical strips. |
sectorsnew.eps [400 KiB] HiDef png [269 KiB] Thumbnail [160 KiB] |

|
|
Simplified scheme of the Muon electronics architecture. |
electr[..].eps [447 KiB] HiDef png [754 KiB] Thumbnail [296 KiB] |

|
|
Efficiency in 20 ns vs. time resolution (c) from a simulation of four-gap chambers (solid circles) and two-gap chambers (open circles) and test beam data for a M3R3 (pad readout) chamber (solid triangles) and a M5R4 (wire readout) chamber (open squares). |
rmsvseff.eps [9 KiB] HiDef png [79 KiB] Thumbnail [41 KiB] |

|
|
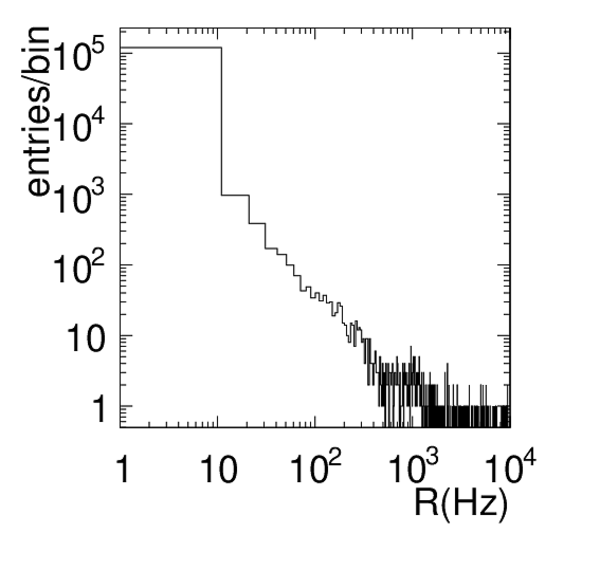
Measured noise rate R(Hz) for all channels of the muon system. |
noise.eps [11 KiB] HiDef png [91 KiB] Thumbnail [55 KiB] |
|
|
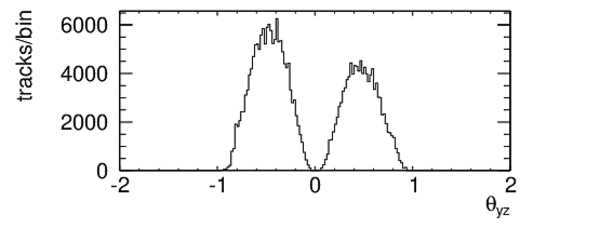
Angles (rad) in the horizontal plane $\theta_{xz}$ (a) and in the vertical plane $\theta_{yz}$ (b) in the LHCb reference frame for reconstructed cosmic ray tracks. |
tetaxz.eps [6 KiB] HiDef png [44 KiB] Thumbnail [23 KiB] |

|
|
teatyz.eps [6 KiB] HiDef png [50 KiB] Thumbnail [26 KiB] |
|
|
|
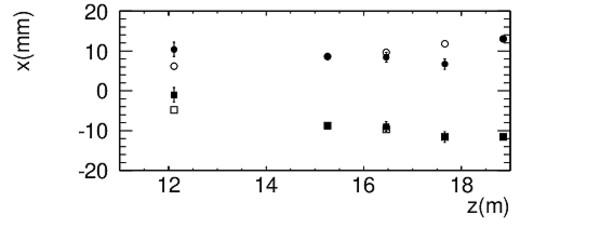
Average position along the $x$ coordinate of the muon half stations before (a) and after (b) the displacement of station M4A (as described in section 5.1.2). The open circles (side A) and squares (side C) represent the survey measurements while the solid circles and squares are the positions obtained by the software local alignment with respect to the reference given by M2 and M5 stations. The errors are statistical only. |
align2009.eps [6 KiB] HiDef png [39 KiB] Thumbnail [22 KiB] |
|
|
align2010.eps [6 KiB] HiDef png [39 KiB] Thumbnail [22 KiB] |

|
|
|
View (not to scale) of the LHCb muon detector on the $yz$ plane. The projected angles $\theta^p_{i,yz}$ for the five stations are shown. The drawing is not to scale. |
theta_[..].eps [15 KiB] HiDef png [63 KiB] Thumbnail [33 KiB] |

|
|
Efficiency $\epsilon$ as a function of $\theta^p_{4,xz}$ (with $tan(\theta^p_{4,yz})< 0.06$) (a) and $\theta^p_{4,yz}$ (with $tan(\theta^p_{4,xz})< 0.2$)(b) angle for station M4, as defined in figure 10. |
effx_M4.eps [9 KiB] HiDef png [55 KiB] Thumbnail [29 KiB] |

|
|
effy_M4.eps [8 KiB] HiDef png [49 KiB] Thumbnail [26 KiB] |

|
|
|
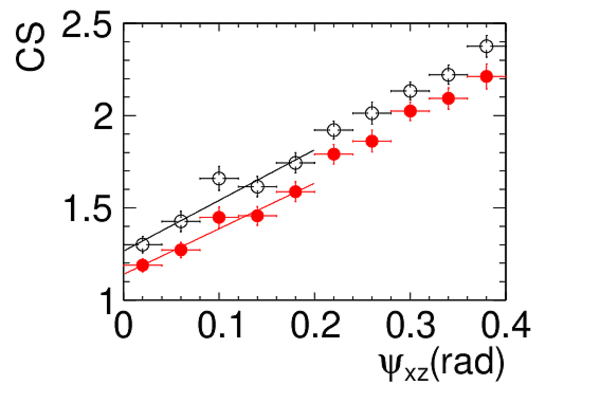
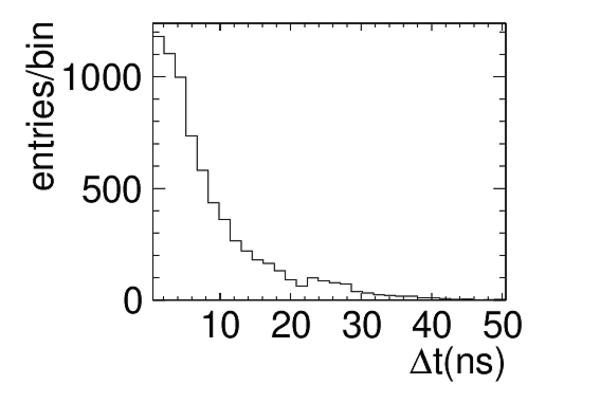
{ Average pad cluster size vs. $\psi_{xz}$} for $|\psi_{yz}|<0.5$ rad in the wide gate (open circles) and in the 25 ns LHC gate (solid circles), for M2R3 (a) and M3R2 (b) chambers. Time ordered difference between the $x$ logical channels forming the cluster and the one occurring first in time, in events with cluster size larger than one, for M2R3 (c) and M3R2 (d) chambers. |
clsizeM2R3.eps [10 KiB] HiDef png [109 KiB] Thumbnail [99 KiB] |

|
|
clsizeM4R2.eps [10 KiB] HiDef png [116 KiB] Thumbnail [106 KiB] |
|
|
|
timingM2R3.eps [6 KiB] HiDef png [84 KiB] Thumbnail [48 KiB] |

|
|
|
timingM4R2.eps [6 KiB] HiDef png [68 KiB] Thumbnail [38 KiB] |
|
|
|
Logical pad cluster size at $\psi_{xz}\to$0 rad, $CS^0$, for tracks with $\psi_{yz}<$0.5 rad in an infinite time window $CS$ (a) and in the 25 ns LHC gate $CS^0_{25}$ (b). One entry per chamber type. |
clsize.eps [5 KiB] HiDef png [58 KiB] Thumbnail [30 KiB] |

|
|
clsizetime.eps [5 KiB] HiDef png [65 KiB] Thumbnail [36 KiB] |

|
|
|
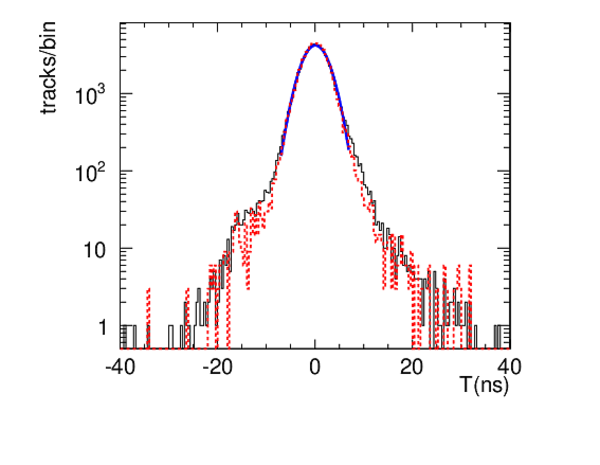
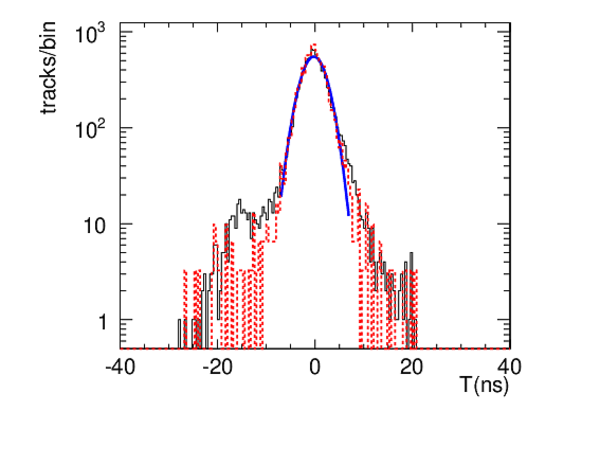
Distribution of time residuals $T$ for M5R4 (a) and M3R2 $x$ view (b) chambers. For M5R4 chambers the same physical signals is readout by two TDC channels for the $x$ and $y$ views, that were required to agree. For the M3R2 chambers there are two independent readouts for the two views. The dotted distribution is obtained after selecting tracks centered in the 25 ns LHC gate and is normalized to the same area of the full plot to show the effect on the tails. |
timere[..].eps [9 KiB] HiDef png [207 KiB] Thumbnail [136 KiB] |
|
|
timere[..].eps [9 KiB] HiDef png [240 KiB] Thumbnail [151 KiB] |
|
|
|
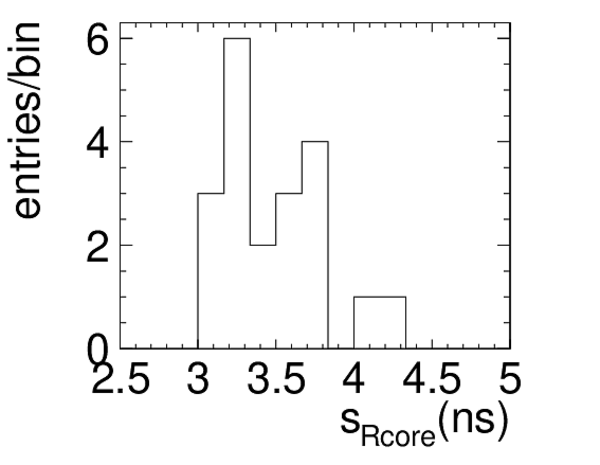
Resolution measurements $s_{Rcore}$ , in ns, after correcting for the systematic effects. One entry corresponds to one chamber type; the chambers with double readout have two entries. |
timer.eps [6 KiB] HiDef png [71 KiB] Thumbnail [40 KiB] |
|
|
Animated gif made out of all figures. |
DP-2011-001.gif Thumbnail |

|
![HiDef png [1 MiB]](Directory_LHCb-DP-2011-001/hidef_sidev2new.png)
![HiDef png [225 KiB]](Directory_LHCb-DP-2011-001/hidef_station_2new.png)
![HiDef png [1 MiB]](Directory_LHCb-DP-2011-001/hidef_CERN_ROnew.png)
![HiDef png [269 KiB]](Directory_LHCb-DP-2011-001/hidef_sectorsnew.png)
![HiDef png [754 KiB]](Directory_LHCb-DP-2011-001/hidef_electronix_arch1.png)
![HiDef png [79 KiB]](Directory_LHCb-DP-2011-001/hidef_rmsvseff.png)
![HiDef png [91 KiB]](Directory_LHCb-DP-2011-001/hidef_noise.png)
![HiDef png [44 KiB]](Directory_LHCb-DP-2011-001/hidef_tetaxz.png)
![HiDef png [50 KiB]](Directory_LHCb-DP-2011-001/hidef_teatyz.png)
![HiDef png [39 KiB]](Directory_LHCb-DP-2011-001/hidef_align2009.png)
![HiDef png [39 KiB]](Directory_LHCb-DP-2011-001/hidef_align2010.png)
![HiDef png [63 KiB]](Directory_LHCb-DP-2011-001/hidef_theta_draw_onscale_good.png)
![HiDef png [55 KiB]](Directory_LHCb-DP-2011-001/hidef_effx_M4.png)
![HiDef png [49 KiB]](Directory_LHCb-DP-2011-001/hidef_effy_M4.png)
![HiDef png [109 KiB]](Directory_LHCb-DP-2011-001/hidef_clsizeM2R3.png)
![HiDef png [116 KiB]](Directory_LHCb-DP-2011-001/hidef_clsizeM4R2.png)
![HiDef png [84 KiB]](Directory_LHCb-DP-2011-001/hidef_timingM2R3.png)
![HiDef png [68 KiB]](Directory_LHCb-DP-2011-001/hidef_timingM4R2.png)
![HiDef png [58 KiB]](Directory_LHCb-DP-2011-001/hidef_clsize.png)
![HiDef png [65 KiB]](Directory_LHCb-DP-2011-001/hidef_clsizetime.png)
![HiDef png [207 KiB]](Directory_LHCb-DP-2011-001/hidef_timeresM5R4.png)
![HiDef png [240 KiB]](Directory_LHCb-DP-2011-001/hidef_timeresM3R2p.png)
![HiDef png [71 KiB]](Directory_LHCb-DP-2011-001/hidef_timer.png)
Tables and captions
|
Misalignments $\Delta$x and $\Delta$y of muon half stations M1, M3, M4 and M5 with respect to the survey measurements calculated with the Kalman fit iterative method assuming the first layer of the first OT station and the muon station M2 in their nominal positions. The quoted errors are statistical only. The systematic errors amount to 1 and 2 mm along the $x$ and $y$ directions. |
Table_1.pdf [22 KiB] HiDef png [66 KiB] Thumbnail [36 KiB] tex code |

|
|
Total efficiency $\epsilon$(%) (in the wide gate) for tracks having tan$(\theta^p_{i,xz})< 0.2$ and tan$(\theta^p_{i,yz})< 0.06$ for the five stations of the LHCb muon detector. |
Table_2.pdf [26 KiB] HiDef png [21 KiB] Thumbnail [11 KiB] tex code |

|
|
From left to right: station and region, intrinsic logical pad cluster size at $\psi_{xz}\to$0 rad for tracks with $\psi_{yz}<$0.5 rad in an infinite time window and in the 25 ns LHC gate. For M1R1 statistics was not enough to perform a measurement. |
Table_3.pdf [39 KiB] HiDef png [354 KiB] Thumbnail [178 KiB] tex code |

|
|
Resolution measurements, in ns, before ($s_{Rcore}$) and after correcting for the systematic effects for the different chamber types. |
Table_3.pdf [39 KiB] HiDef png [354 KiB] Thumbnail [178 KiB] tex code |
|
![HiDef png [66 KiB]](Directory_LHCb-DP-2011-001/hidef_Table_1.png)
![HiDef png [21 KiB]](Directory_LHCb-DP-2011-001/hidef_Table_2.png)
![HiDef png [354 KiB]](Directory_LHCb-DP-2011-001/hidef_Table_3.png)
Created on 18 October 2023.