Information
LHCb-DP-2012-002
arXiv:1211.1346 [PDF]
(Submitted on 06 Nov 2012)
JINST 8 P02022
Inspire 1198435
Tools
Abstract
The performance of the LHCb Muon system and its stability across the full 2010 data taking with LHC running at ps = 7 TeV energy is studied. The optimization of the detector setting and the time calibration performed with the first collisions delivered by LHC is described. Particle rates, measured for the wide range of luminosities and beam operation conditions experienced during the run, are compared with the values expected from simulation. The space and time alignment of the detectors, chamber efficiency, time resolution and cluster size are evaluated. The detector performance is found to be as expected from specifications or better. Notably the overall efficiency is well above the design requirements
Figures and captions
|
(a) Side view of the LHCb Muon Detector. (b) Station layout with the four regions R1--R4. |
sideview.pdf [370 KiB] HiDef png [471 KiB] Thumbnail [249 KiB] |

|
|
Left: a quadrant of M1 station. Each rectangle represents one chamber. Right: division into logical pads of four chambers belonging to the four regions of station M1. In stations M2, M3 (M4, M5) the number of pad columns per chamber is double (half) the number in the corresponding region of station M1, while the number of pad rows is the same. |
fig2.pdf [37 KiB] HiDef png [92 KiB] Thumbnail [108 KiB] |

|
|
Illumination map of the five detector stations in a typical 2010 physics run. The log color scales give the average number of hits per cm$^2$ per trigger for all the 55296 logical pads. Faulty channels giving no hits and a few noisy spots can be noticed. |
mort_all.png [1 MiB] HiDef png [563 KiB] Thumbnail [203 KiB] |

|
|
Normalized rates $R$, extrapolated to the nominal luminosity (equation 6.5), in the 20 muon detector regions, for the 2010 sample runs acquired in different beam operation conditions. The rates refer to the in-time hits (within the trigger 25 ns gate). |
rate.png [26 KiB] HiDef png [179 KiB] Thumbnail [104 KiB] |

|
|
Comparison of the normalized rates $R$ (6.5) seen in the 20 muon detector regions for a high luminosity run, with the MC data produced in the 2010 configuration at $\sqrt{s}$ = 7 TeV. The rates refer to the in-time hits (within the trigger 25 ns gate). |
ratevs[..].png [21 KiB] HiDef png [139 KiB] Thumbnail [84 KiB] |

|
|
Time distribution of the M5R2 hits for L0MB events acquired in TAE mode. The red vertical lines separate the consecutive 25 ns gates assigned with progressive BXID numbers. The structures at the gate boundaries are due to a known feature of the TDC giving an incorrect fine time measurement at the gate edges. |
spillo[..].pdf [92 KiB] HiDef png [417 KiB] Thumbnail [173 KiB] |

|
|
Space distribution of the ratio between the hit rates measured in 125 ns and 25 ns. The contribution of late hits from backscattering is evident in the outer regions, notably for station M5. |
ratelate.png [601 KiB] HiDef png [715 KiB] Thumbnail [207 KiB] |

|
|
Dots in red: ratio of the hit rate in 125 ns time window to the hit rate in 25 ns; the out of scale value for M5R4 is about 10. Continuous line in blue: ratio of total cluster size to in-time cluster size for track hits. |
rateTAE.png [14 KiB] HiDef png [99 KiB] Thumbnail [64 KiB] |

|
|
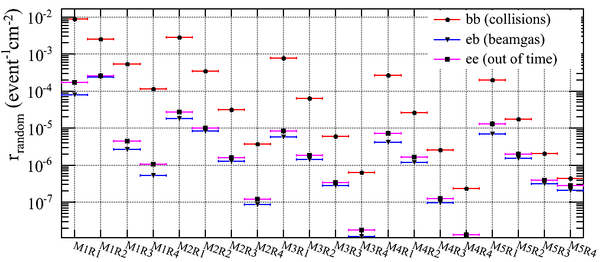
Comparison of the average number of hits per cm$^{2}$ (equation 6.1) measured in a colliding beams run for random triggers in coincidence with beam-beam collisions (bb), non-colliding bunches (eb) and no beams (ee) - see text for details. |
rateOutbb.png [19 KiB] HiDef png [150 KiB] Thumbnail [90 KiB] |
|
|
Average cluster size along $x$ in a low luminosity run for each detector region. Events are triggered by microbias or L0MB triggers. Cluster selections are described in the text. |
xclsizes.pdf [142 KiB] HiDef png [1 MiB] Thumbnail [556 KiB] |

|
|
Average x cluster size for isolated track hits as a function of the track angle (in rad) for M2R1 (smallest logical pad region) and M5R4 (largest logical pad region). A linear fit is used to evaluate the cluster size for perpendicularly impinging tracks. |
CLSvsTETA.png [27 KiB] HiDef png [86 KiB] Thumbnail [51 KiB] |

|
|
Average $x$ cluster size at 0 angle in experimental data and simulation (MC 2010). To suppress the effect of pile-up, only isolated clusters and low-luminosity data are used. |
xclsizeCmp.pdf [140 KiB] HiDef png [837 KiB] Thumbnail [359 KiB] |

|
|
Time delay distribution of pads in track clusters with respect to the first pad in time: (a) for the small cathod pad region M1R1; (b) for the large anode pad region M5R4. |
xcltiming.pdf [85 KiB] HiDef png [339 KiB] Thumbnail [91 KiB] |

|
|
Time distribution of the most time centered hit, measured in M5R2 for L0MB events acquired in TAE mode, reported in linear (left) and logarithmic (right) scale. The vertical lines at $\pm$ 12.5 ns delimit the "efficient" hits assigned with the BXID number of the trigger. The result of a gaussian fit performed around the maximum of the distribution to evaluate the core time resolution is also shown. |
firstHITmu.png [25 KiB] HiDef png [81 KiB] Thumbnail [57 KiB] |

|
|
Core time resolution (upper plot) and timing efficiency (lower plot) measured for each region in the two TAE samples acquired before and after the bulk of 2010 LHCb physics data. |
tTAEcmp.png [241 KiB] HiDef png [594 KiB] Thumbnail [223 KiB] |

|
|
Average time of the most time-centered track hit for different stations and regions, measured in the sample runs as a function of their data-taking time. The values for optimal efficiency depend on the detector region and have been fixed at the start of data taking. Variations along the 7 months of operation do not exceed the $\pm$ 1 ns range. |
tStab1.png [28 KiB] HiDef png [218 KiB] Thumbnail [106 KiB] |

|
|
Alignments of the ten muon half stations for the 2010 run. The average value $x$ of the inner edges (left) and the median $y$ (right), are shown as a function of the station $z$ position. The empty dots represent the survey measurements whose errors are negligible. The full dots are the positions found by the software global alignment described in section 9.1; the error bars correspond to the statistical and systematic uncertainties, summed in quadrature. The dashed lines in the left plot represent the ideal alignment. |
Alignm[..].png [32 KiB] HiDef png [104 KiB] Thumbnail [58 KiB] |

|
|
Multiplicity of clusters found in the 8$\sigma$ search window for the four M3 regions. The thick line shows the results of the fit with the two components background described in equation 10.1. |
CluMultM3.pdf [838 KiB] HiDef png [553 KiB] Thumbnail [246 KiB] |

|
|
The cluster multiplicity in the 8$\sigma$ search window diminished by 1 (histogram) and the cluster multiplicity in the corresponding window in the opposite quadrant (dots), for $J/\psi$ muons in the four regions of M1 station. |
M1sqvsoq.png [1 MiB] HiDef png [165 KiB] Thumbnail [86 KiB] |

|
|
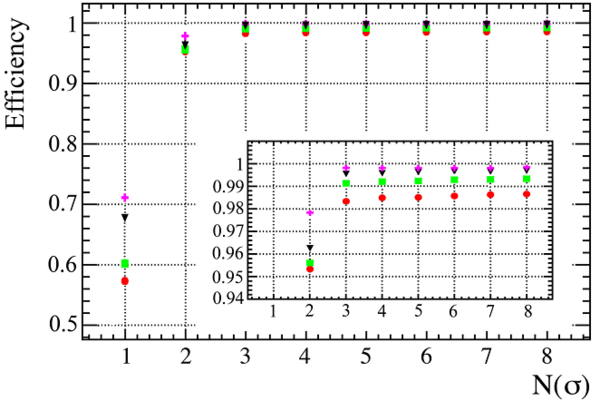
The measured efficiency of M2 station as a function of the number of $\sigma$ of the search window. The four regions are shown: R1 (red circles), R2 (green squares), R3 (black triangles), R4 (pink crosses). A zoom of the high efficiency region is shown in the insert. |
M2Effi.png [1 MiB] HiDef png [152 KiB] Thumbnail [87 KiB] |

|
|
The measured efficiency of M1 station as a function of the number of $\sigma$ of the search window. The four regions are shown: R1 (red circles), R2 (green squares), R3 (black triangles), R4 (pink crosses). A zoom of the high efficiency region is shown in the insert. |
M1Effi.pdf [1 MiB] HiDef png [526 KiB] Thumbnail [287 KiB] |
|
|
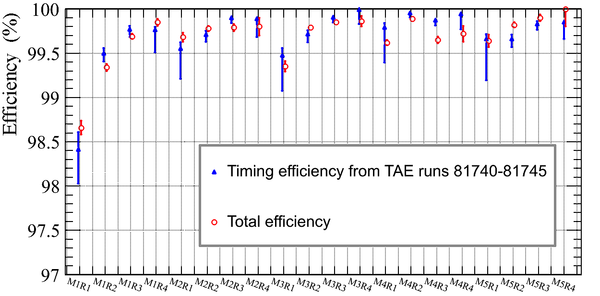
The results for total efficiency are compared with the estimates of timing efficiency from section 8.1. Errors are statistical only. For the regions more affected by combinatorial background, a systematic underestimation of the timing efficiency by a few per mill is present. |
cmpEffs.png [41 KiB] HiDef png [155 KiB] Thumbnail [68 KiB] |
|
|
Animated gif made out of all figures. |
DP-2012-002.gif Thumbnail |

|
![HiDef png [471 KiB]](Directory_LHCb-DP-2012-002/hidef_sideview.png)
![HiDef png [92 KiB]](Directory_LHCb-DP-2012-002/hidef_fig2.png)
![mort_all.png [1 MiB]](Directory_LHCb-DP-2012-002/mort_all.png)
![HiDef png [563 KiB]](Directory_LHCb-DP-2012-002/hidef_mort_all.png)
![rate.png [26 KiB]](Directory_LHCb-DP-2012-002/rate.png)
![HiDef png [179 KiB]](Directory_LHCb-DP-2012-002/hidef_rate.png)
![ratevs[..].png [21 KiB]](Directory_LHCb-DP-2012-002/ratevsmcnew.png)
![HiDef png [139 KiB]](Directory_LHCb-DP-2012-002/hidef_ratevsmcnew.png)
![HiDef png [417 KiB]](Directory_LHCb-DP-2012-002/hidef_spilloverTAE.png)
![ratelate.png [601 KiB]](Directory_LHCb-DP-2012-002/ratelate.png)
![HiDef png [715 KiB]](Directory_LHCb-DP-2012-002/hidef_ratelate.png)
![rateTAE.png [14 KiB]](Directory_LHCb-DP-2012-002/rateTAE.png)
![HiDef png [99 KiB]](Directory_LHCb-DP-2012-002/hidef_rateTAE.png)
![rateOutbb.png [19 KiB]](Directory_LHCb-DP-2012-002/rateOutbb.png)
![HiDef png [150 KiB]](Directory_LHCb-DP-2012-002/hidef_rateOutbb.png)
![HiDef png [1 MiB]](Directory_LHCb-DP-2012-002/hidef_xclsizes.png)
![CLSvsTETA.png [27 KiB]](Directory_LHCb-DP-2012-002/CLSvsTETA.png)
![HiDef png [86 KiB]](Directory_LHCb-DP-2012-002/hidef_CLSvsTETA.png)
![HiDef png [837 KiB]](Directory_LHCb-DP-2012-002/hidef_xclsizeCmp.png)
![HiDef png [339 KiB]](Directory_LHCb-DP-2012-002/hidef_xcltiming.png)
![firstHITmu.png [25 KiB]](Directory_LHCb-DP-2012-002/firstHITmu.png)
![HiDef png [81 KiB]](Directory_LHCb-DP-2012-002/hidef_firstHITmu.png)
![tTAEcmp.png [241 KiB]](Directory_LHCb-DP-2012-002/tTAEcmp.png)
![HiDef png [594 KiB]](Directory_LHCb-DP-2012-002/hidef_tTAEcmp.png)
![tStab1.png [28 KiB]](Directory_LHCb-DP-2012-002/tStab1.png)
![HiDef png [218 KiB]](Directory_LHCb-DP-2012-002/hidef_tStab1.png)
![Alignm[..].png [32 KiB]](Directory_LHCb-DP-2012-002/Alignment2010.png)
![HiDef png [104 KiB]](Directory_LHCb-DP-2012-002/hidef_Alignment2010.png)
![HiDef png [553 KiB]](Directory_LHCb-DP-2012-002/hidef_CluMultM3.png)
![M1sqvsoq.png [1 MiB]](Directory_LHCb-DP-2012-002/M1sqvsoq.png)
![HiDef png [165 KiB]](Directory_LHCb-DP-2012-002/hidef_M1sqvsoq.png)
![M2Effi.png [1 MiB]](Directory_LHCb-DP-2012-002/M2Effi.png)
![HiDef png [152 KiB]](Directory_LHCb-DP-2012-002/hidef_M2Effi.png)
![HiDef png [526 KiB]](Directory_LHCb-DP-2012-002/hidef_M1Effi.png)
![cmpEffs.png [41 KiB]](Directory_LHCb-DP-2012-002/cmpEffs.png)
![HiDef png [155 KiB]](Directory_LHCb-DP-2012-002/hidef_cmpEffs.png)
Tables and captions
|
Average timing efficiency, in percent, for the five stations and for each region, obtained from the TAE sample acquired at the end of data taking. Statistical errors have been evaluated with an approximated binomial 68% confidence interval. |
Table_1.pdf [33 KiB] HiDef png [4 KiB] Thumbnail [1 KiB] tex code |

|
|
Misalignments of muon half stations M1--M5, relative to the survey measurements, calculated in the LHCb reference system with the Kalman fit iterative method. The quoted uncertainties are the fit errors (first) and the systematic uncertainties (second) on the relative positions determined repeating the analysis with different track selections. |
Table_2.pdf [21 KiB] HiDef png [9 KiB] Thumbnail [3 KiB] tex code |

|
|
Resolution along $x$ and $y$ of the distance between the muon track and the muon cluster in each region of the muon detector. The muon track is reconstructed skipping the station whose resolution must be evaluated. |
Table_3.pdf [25 KiB] HiDef png [4 KiB] Thumbnail [1 KiB] tex code |

|
|
M5 Monte Carlo efficiency (%) for Minimum Bias (L0MB) events with and without 6 GeV/c momentum cut compared to { Particle Gun} (PG) muons. Statistical errors have been evaluated with an approximated binomial 68% confidence interval. |
Table_4.pdf [38 KiB] HiDef png [1 KiB] Thumbnail [0 KiB] tex code |

|
|
Efficiency values (%) of all the twenty regions with their statistical and systematic errors. Statistical errors have been evaluated with an approximated binomial 68% confidence interval. Systematic errors are calculated as the sum in quadrature of various contributions - see text for details. |
Table_5.pdf [31 KiB] HiDef png [3 KiB] Thumbnail [1 KiB] tex code |

|
![HiDef png [4 KiB]](Directory_LHCb-DP-2012-002/hidef_Table_1.png)
![HiDef png [9 KiB]](Directory_LHCb-DP-2012-002/hidef_Table_2.png)
![HiDef png [4 KiB]](Directory_LHCb-DP-2012-002/hidef_Table_3.png)
![HiDef png [1 KiB]](Directory_LHCb-DP-2012-002/hidef_Table_4.png)
![HiDef png [3 KiB]](Directory_LHCb-DP-2012-002/hidef_Table_5.png)
Created on 18 October 2023.