Information
LHCb-DP-2013-001
arXiv:1306.0249 [PDF]
(Submitted on 02 Jun 2013)
JINST 8 (2013) P10020
Inspire 1236807
Tools
Abstract
The performance of the muon identification in LHCb is extracted from data using muons and hadrons produced in J/\psi->\mu\mu, \Lambda->p\pi and D^{\star}->\pi D0(K\pi) decays. The muon identification procedure is based on the pattern of hits in the muon chambers. A momentum dependent binary requirement is used to reduce the probability of hadrons to be misidentified as muons to the level of 1, keeping the muon efficiency in the range of 95-98. As further refinement, a likelihood is built for the muon and non-muon hypotheses. Adding a requirement on this likelihood that provides a total muon efficiency at the level of 93, the hadron misidentification rates are below 0.6.
Figures and captions
|
Schematic view of the LHCb experiment. The muon stations are seen as the five green vertical bars, the second one placed just after the calorimeters, shown as the blue rectangles. |
lhcb-light.pdf [297 KiB] HiDef png [613 KiB] Thumbnail [306 KiB] |

|
|
Schematic view of one muon system station (reproduced from [7]). |
muonre[..].png [19 KiB] HiDef png [122 KiB] Thumbnail [32 KiB] |

|
|
Average square distance significance distributions for muons, protons, pions and kaons (a) and the corresponding muDLL distributions (b). |
hDist_allp.pdf [17 KiB] HiDef png [271 KiB] Thumbnail [234 KiB] |

|
|
muDLL_allp.pdf [16 KiB] HiDef png [238 KiB] Thumbnail [212 KiB] |

|
|
|
Normalized NShared distributions for muons, protons, kaons and pions. |
Nshare[..].pdf [13 KiB] HiDef png [185 KiB] Thumbnail [153 KiB] |

|
|
IsMuon efficiency and misidentification probabilities, as a function of momentum, in ranges of transverse momentum: $\varepsilon_{IM} $ (a), $\wp_{IM}(p\rightarrow\mu) $ (b), $\wp_{IM}(\pi\rightarrow\mu) $ (c) and $\wp_{IM}(K\rightarrow\mu) $ (d). |
dllFit[..].pdf [16 KiB] HiDef png [210 KiB] Thumbnail [202 KiB] |

|
|
dllFit[..].pdf [16 KiB] HiDef png [243 KiB] Thumbnail [238 KiB] |

|
|
|
dllFit[..].pdf [15 KiB] HiDef png [172 KiB] Thumbnail [162 KiB] |

|
|
|
dllFit[..].pdf [15 KiB] HiDef png [175 KiB] Thumbnail [164 KiB] |

|
|
|
IsMuon efficiency $\varepsilon_{IM} $ (a) and $\wp_{IM} $ for protons (b), pions (c) and kaons (d) as a function of momentum for different ranges of the number of trajectories reconstructed in the event (ntracks). |
dllFit[..].pdf [16 KiB] HiDef png [210 KiB] Thumbnail [188 KiB] |

|
|
dllFit[..].pdf [16 KiB] HiDef png [197 KiB] Thumbnail [197 KiB] |

|
|
|
dllFit[..].pdf [15 KiB] HiDef png [173 KiB] Thumbnail [155 KiB] |

|
|
|
dllFit[..].pdf [15 KiB] HiDef png [175 KiB] Thumbnail [156 KiB] |

|
|
|
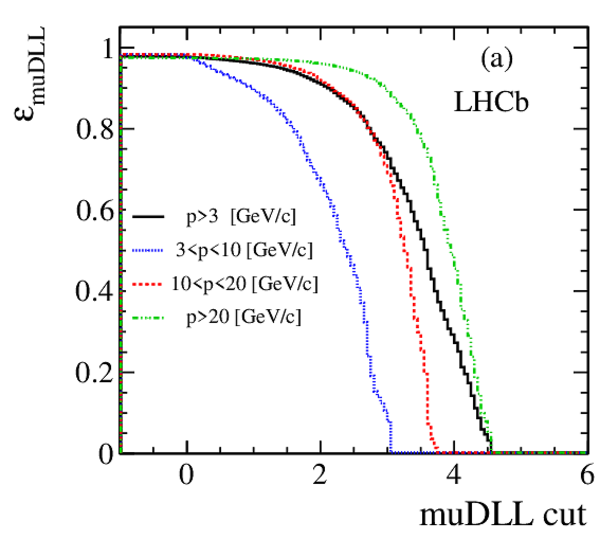
The efficiency $\varepsilon_{\rm muDLL} $ as a function of muon DLL cut for muons (a) and $ {\rm misidentification} {\rm probabilities}$ for protons (b), pions (c) and kaons (d). The black solid line shows the average values integrated over $p>3 $ $ {\mathrm{ Ge V /}c}$ . The blue dotted line correspond to particles in the range $3<p<10 $ $ {\mathrm{ Ge V /}c}$ . The red dashed lines show results for $10<p<20 $ $ {\mathrm{ Ge V /}c}$ and the green dashed-dotted for $p>20 $ $ {\mathrm{ Ge V /}c}$ . |
muDLLE[..].pdf [16 KiB] HiDef png [260 KiB] Thumbnail [198 KiB] |
|
|
muDLLE[..].pdf [16 KiB] HiDef png [207 KiB] Thumbnail [161 KiB] |

|
|
|
muDLLE[..].pdf [16 KiB] HiDef png [207 KiB] Thumbnail [163 KiB] |

|
|
|
muDLLE[..].pdf [16 KiB] HiDef png [203 KiB] Thumbnail [162 KiB] |

|
|
|
Muon efficiency (a) and $ {\rm misidentification} {\rm probabilities}$ for protons (b), pions (c) and kaons (d) as a function of the particle momentum for the IsMuon requirement alone (black solid circles) and with the additional cuts muDLL$\geq$1.74 (red triangles) and muDLL$\geq$2.25 (blue open circles). |
muon_m[..].pdf [15 KiB] HiDef png [177 KiB] Thumbnail [171 KiB] |

|
|
proton[..].pdf [15 KiB] HiDef png [162 KiB] Thumbnail [156 KiB] |

|
|
|
pion_m[..].pdf [14 KiB] HiDef png [138 KiB] Thumbnail [128 KiB] |

|
|
|
kaon_m[..].pdf [15 KiB] HiDef png [141 KiB] Thumbnail [131 KiB] |

|
|
|
Average efficiency $\varepsilon_{\rm DLL} $ as a function of the pion (a) and kaon (b) $ {\rm misidentification} {\rm probabilities}$ for particles with momentum in the range $p>3$ $ $ $ {\mathrm{ Ge V /}c}$ . The dotted lines show the DLL performance, while the muon DLL performance is shown with a solid line. |
roc_mu[..].pdf [16 KiB] HiDef png [109 KiB] Thumbnail [58 KiB] |

|
|
roc_mu[..].pdf [15 KiB] HiDef png [98 KiB] Thumbnail [55 KiB] |

|
|
|
Muon efficiency $\varepsilon_{\rm NShared} $ as a function of the pion and proton $ {\rm misidentification} {\rm probabilities}$ . The average values, for all particles with $p>3 $ $ {\mathrm{ Ge V /}c}$ , are shown with a black line, compared to the three momentum ranges separately, as for Fig. 7. |
roc_ns[..].pdf [14 KiB] HiDef png [213 KiB] Thumbnail [196 KiB] |

|
|
roc_ns[..].pdf [14 KiB] HiDef png [175 KiB] Thumbnail [157 KiB] |

|
|
|
Animated gif made out of all figures. |
DP-2013-001.gif Thumbnail |

|
![HiDef png [613 KiB]](Directory_LHCb-DP-2013-001/hidef_lhcb-light.png)
![muonre[..].png [19 KiB]](Directory_LHCb-DP-2013-001/muonregions.png)
![HiDef png [122 KiB]](Directory_LHCb-DP-2013-001/hidef_muonregions.png)
![HiDef png [271 KiB]](Directory_LHCb-DP-2013-001/hidef_hDist_allp.png)
![HiDef png [238 KiB]](Directory_LHCb-DP-2013-001/hidef_muDLL_allp.png)
![HiDef png [185 KiB]](Directory_LHCb-DP-2013-001/hidef_Nshared_allp.png)
![HiDef png [210 KiB]](Directory_LHCb-DP-2013-001/hidef_dllFit_mu_IMvsPvsPt.png)
![HiDef png [243 KiB]](Directory_LHCb-DP-2013-001/hidef_dllFit_P_IMvsPvsPt.png)
![HiDef png [172 KiB]](Directory_LHCb-DP-2013-001/hidef_dllFit_pi_IMvsPvsPt.png)
![HiDef png [175 KiB]](Directory_LHCb-DP-2013-001/hidef_dllFit_ka_IMvsPvsPt.png)
![HiDef png [210 KiB]](Directory_LHCb-DP-2013-001/hidef_dllFit_mu_IMvsPvsntk.png)
![HiDef png [197 KiB]](Directory_LHCb-DP-2013-001/hidef_dllFit_P_IMvsPvsntk.png)
![HiDef png [173 KiB]](Directory_LHCb-DP-2013-001/hidef_dllFit_pi_IMvsPvstk.png)
![HiDef png [175 KiB]](Directory_LHCb-DP-2013-001/hidef_dllFit_ka_IMvsPvstk.png)
![HiDef png [260 KiB]](Directory_LHCb-DP-2013-001/hidef_muDLLEff_jpsi_mu.png)
![HiDef png [207 KiB]](Directory_LHCb-DP-2013-001/hidef_muDLLEff_lambda_p.png)
![HiDef png [207 KiB]](Directory_LHCb-DP-2013-001/hidef_muDLLEff_d0_pi.png)
![HiDef png [203 KiB]](Directory_LHCb-DP-2013-001/hidef_muDLLEff_d0_ka.png)
![HiDef png [177 KiB]](Directory_LHCb-DP-2013-001/hidef_muon_muDLL2_effvsp.png)
![HiDef png [162 KiB]](Directory_LHCb-DP-2013-001/hidef_proton_muDLL2_effvsp.png)
![HiDef png [138 KiB]](Directory_LHCb-DP-2013-001/hidef_pion_muDLL2_effvsp.png)
![HiDef png [141 KiB]](Directory_LHCb-DP-2013-001/hidef_kaon_muDLL2_effvsp.png)
![HiDef png [109 KiB]](Directory_LHCb-DP-2013-001/hidef_roc_muDLLDLL_pion_allp.png)
![HiDef png [98 KiB]](Directory_LHCb-DP-2013-001/hidef_roc_muDLLDLL_kaon_allp.png)
![HiDef png [213 KiB]](Directory_LHCb-DP-2013-001/hidef_roc_nsh_pion_zoom.png)
![HiDef png [175 KiB]](Directory_LHCb-DP-2013-001/hidef_roc_nsh_proton_zoom.png)
Tables and captions
|
Muon stations required to trigger the IsMuon decision as a function of momentum range. |
Table_1.pdf [22 KiB] HiDef png [50 KiB] Thumbnail [25 KiB] tex code |

|
|
Average IsMuon efficiency and $ {\rm misidentification} {\rm probabilities}$ in different transverse momentum intervals (%). Uncertainties are statistical. |
Table_2.pdf [37 KiB] HiDef png [59 KiB] Thumbnail [24 KiB] tex code |

|
![HiDef png [50 KiB]](Directory_LHCb-DP-2013-001/hidef_Table_1.png)
![HiDef png [59 KiB]](Directory_LHCb-DP-2013-001/hidef_Table_2.png)
Created on 18 October 2023.