Information
LHCb-DP-2013-002
arXiv:1408.1251 [PDF]
(Submitted on 06 Aug 2014)
JINST 10 (2015) P02007
Inspire 1309999
Tools
Abstract
The determination of track reconstruction efficiencies at LHCb using $J/\psi\rightarrow\mu^{+}\mu^{-}$ decays is presented. Efficiencies above $95\%$ are found for the data taking periods in 2010, 2011, and 2012. The ratio of the track reconstruction efficiency of muons in data and simulation is compatible with unity and measured with an uncertainty of $0.8 \%$ for data taking in 2010, and at a precision of $0.4 \%$ for data taking in 2011 and 2012. For hadrons an additional $1.4 \%$ uncertainty due to material interactions is assumed. This result is crucial for accurate cross section and branching fraction measurements in LHCb.
Figures and captions
|
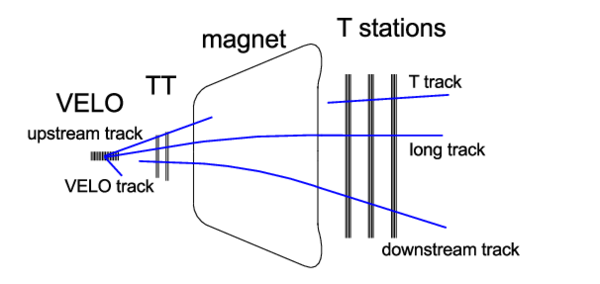
Tracking detectors and track types reconstructed by the track finding algorithms at LHCb. |
lhcb.pdf [21 KiB] HiDef png [100 KiB] Thumbnail [52 KiB] |
|
|
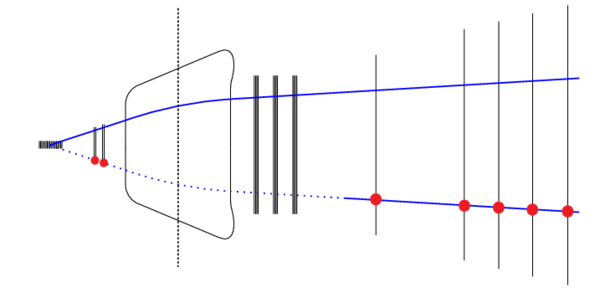
Illustration of the three tag-and-probe methods: (a) the VELO method, (b) the T-station method, and (c) the long method. The VELO (black rectangle), the two TT layers (short bold lines), the magnet coil, the three T stations (long bold lines), and the five muon stations (thin lines) are shown in all three subfigures. The upper solid blue line indicates the tag track, the lower line indicates the probe with red dots where hits are required and dashes where a detector is probed. |
trackE[..].pdf [1 KiB] HiDef png [70 KiB] Thumbnail [33 KiB] |

|
|
trackE[..].pdf [2 KiB] HiDef png [67 KiB] Thumbnail [34 KiB] |

|
|
|
trackE[..].pdf [2 KiB] HiDef png [67 KiB] Thumbnail [34 KiB] |
|
|
|
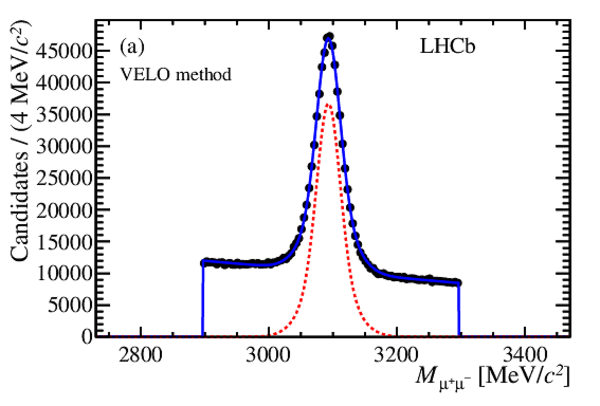
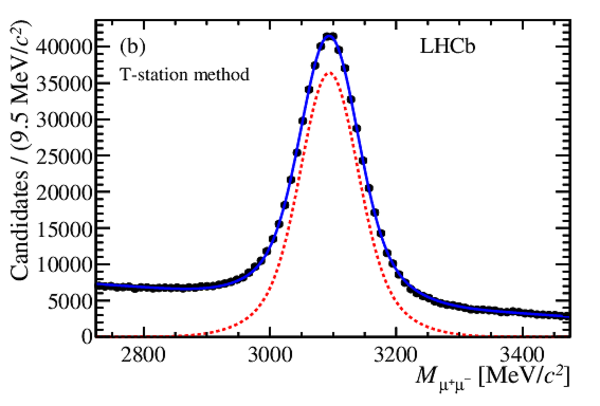
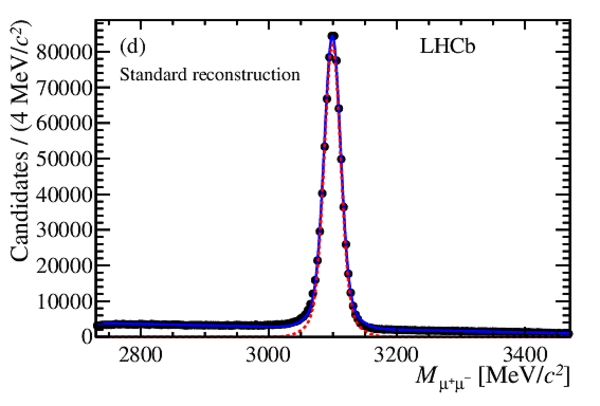
Invariant mass distributions for reconstructed $ { J \mskip -3mu/\mskip -2mu\psi \mskip 2mu}$ candidates from the 2011 dataset. The solid line shows the fitted distribution for signal and background, the dotted line is the signal component. The subfigures are (a) the VELO method, (b) the T-station method, (c) the long method. For comparison of resolution and signal purity (d) shows the invariant mass distribution of $ { J \mskip -3mu/\mskip -2mu\psi \mskip 2mu}$ candidates obtained with the standard reconstruction at LHCb. |
Velo_m[..].pdf [25 KiB] HiDef png [220 KiB] Thumbnail [193 KiB] |
|
|
Tstati[..].pdf [23 KiB] HiDef png [226 KiB] Thumbnail [194 KiB] |
|
|
|
Long_m[..].pdf [46 KiB] HiDef png [199 KiB] Thumbnail [169 KiB] |

|
|
|
Standa[..].pdf [36 KiB] HiDef png [226 KiB] Thumbnail [184 KiB] |
|
|
|
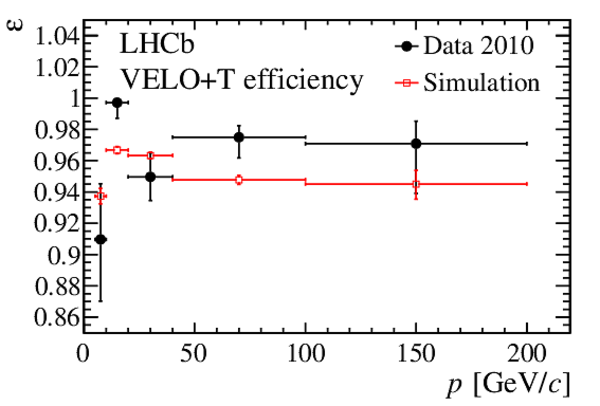
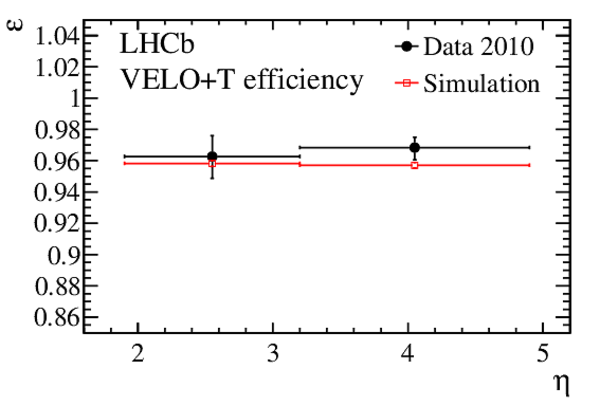
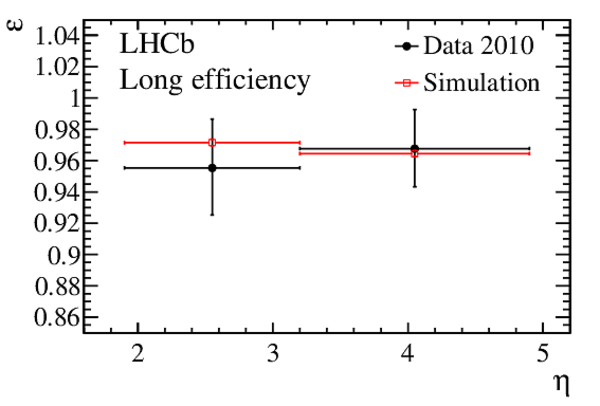
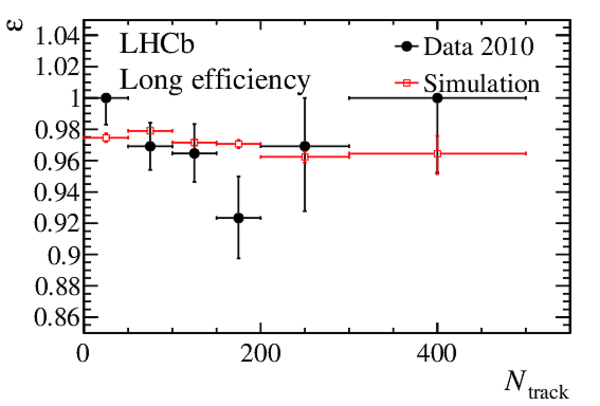
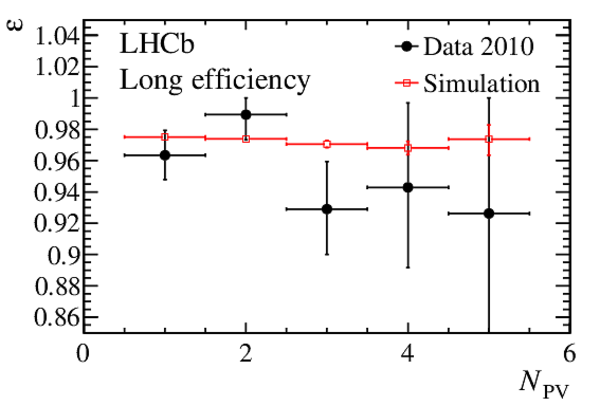
Track reconstruction efficiencies for the 2010 data and for weighted simulation. The left-hand column shows the results of the combined method while the right-hand column shows the results of the long method. The efficiency is shown as a function of $p$ (first row), $\eta$ (second row), $N_{\rm track}$ (third row), and $N_{\rm PV}$ (fourth row). The error bars indicate the statistical uncertainties. |
combin[..].pdf [14 KiB] HiDef png [148 KiB] Thumbnail [149 KiB] |
|
|
Long_e[..].pdf [14 KiB] HiDef png [148 KiB] Thumbnail [147 KiB] |

|
|
|
combin[..].pdf [14 KiB] HiDef png [119 KiB] Thumbnail [124 KiB] |
|
|
|
Long_e[..].pdf [14 KiB] HiDef png [118 KiB] Thumbnail [121 KiB] |
|
|
|
combin[..].pdf [14 KiB] HiDef png [140 KiB] Thumbnail [140 KiB] |

|
|
|
Long_e[..].pdf [14 KiB] HiDef png [138 KiB] Thumbnail [137 KiB] |
|
|
|
combin[..].pdf [14 KiB] HiDef png [133 KiB] Thumbnail [134 KiB] |

|
|
|
Long_e[..].pdf [14 KiB] HiDef png [132 KiB] Thumbnail [131 KiB] |
|
|
|
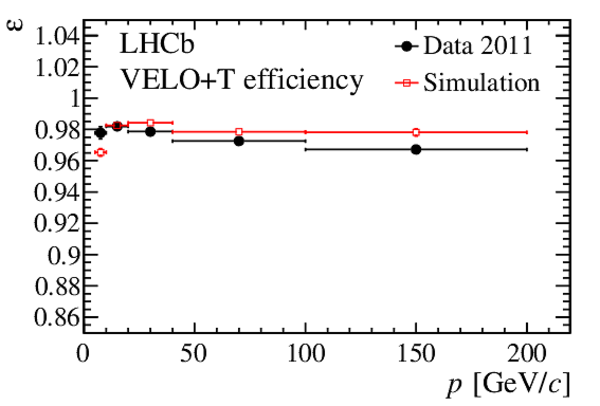
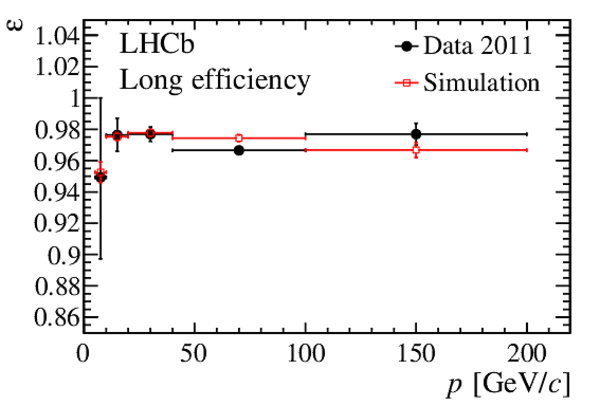
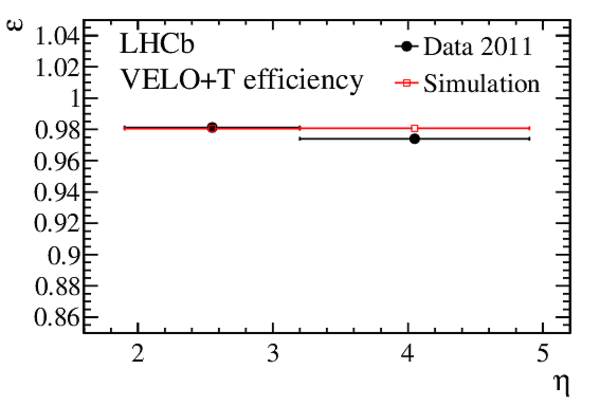
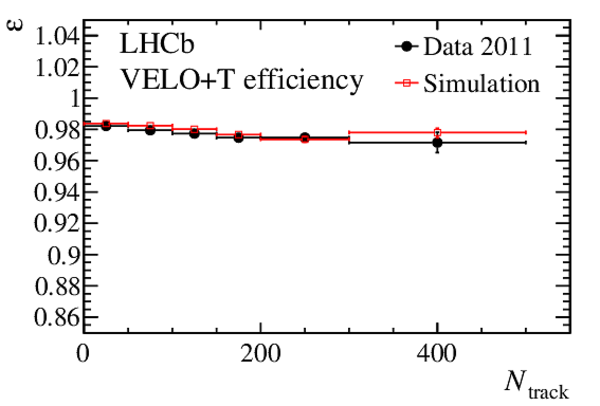
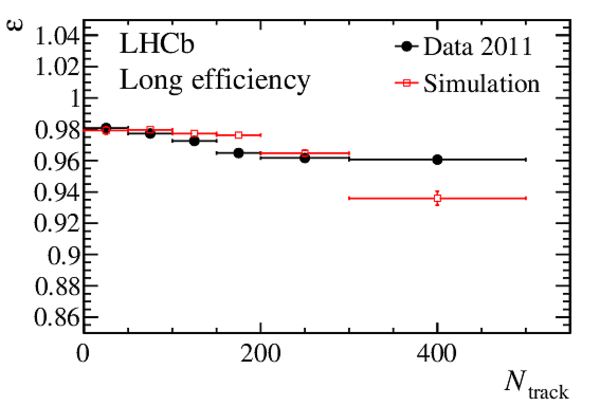
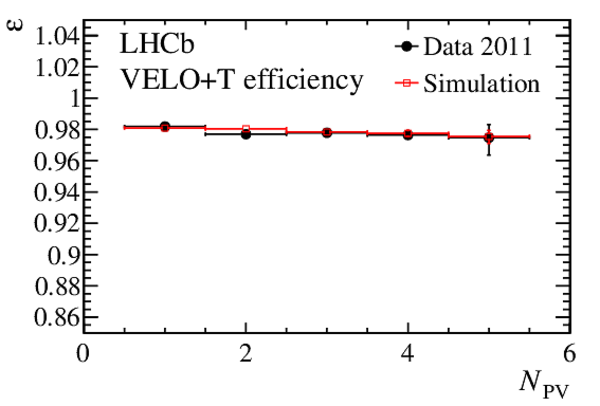
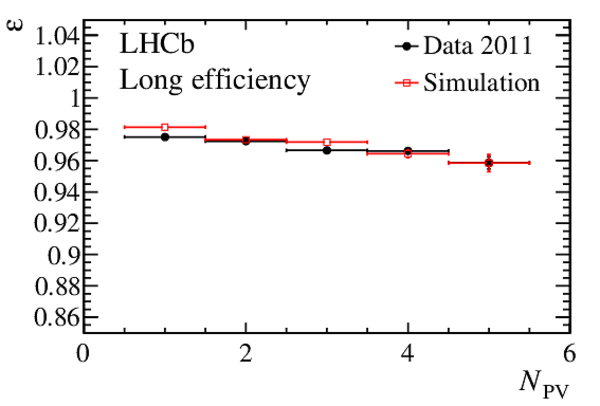
Track reconstruction efficiencies for the 2011 data and for weighted simulation. The left-hand column shows the results of the combined method while the right-hand column shows the results of the long method. The efficiency is shown as a function of $p$ (first row), $\eta$ (second row), $N_{\rm track}$ (third row), and $N_{\rm PV}$ (fourth row). The error bars indicate the statistical uncertainties. |
combin[..].pdf [14 KiB] HiDef png [142 KiB] Thumbnail [144 KiB] |
|
|
Long_e[..].pdf [14 KiB] HiDef png [144 KiB] Thumbnail [143 KiB] |
|
|
|
combin[..].pdf [13 KiB] HiDef png [116 KiB] Thumbnail [121 KiB] |
|
|
|
Long_e[..].pdf [14 KiB] HiDef png [116 KiB] Thumbnail [119 KiB] |

|
|
|
combin[..].pdf [14 KiB] HiDef png [132 KiB] Thumbnail [132 KiB] |
|
|
|
Long_e[..].pdf [14 KiB] HiDef png [131 KiB] Thumbnail [131 KiB] |
|
|
|
combin[..].pdf [14 KiB] HiDef png [124 KiB] Thumbnail [126 KiB] |
|
|
|
Long_e[..].pdf [14 KiB] HiDef png [123 KiB] Thumbnail [124 KiB] |
|
|
|
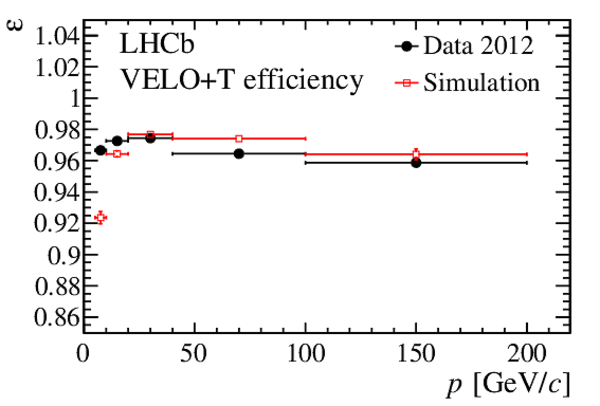
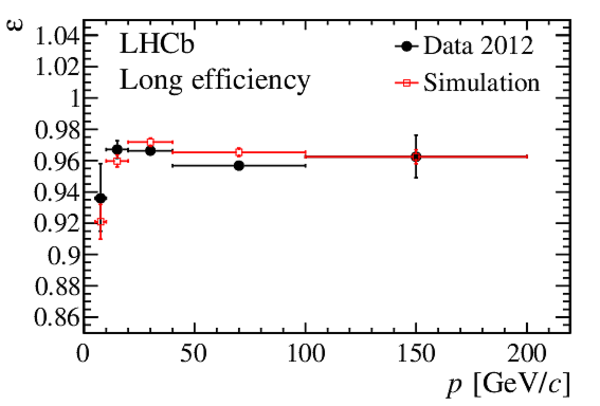
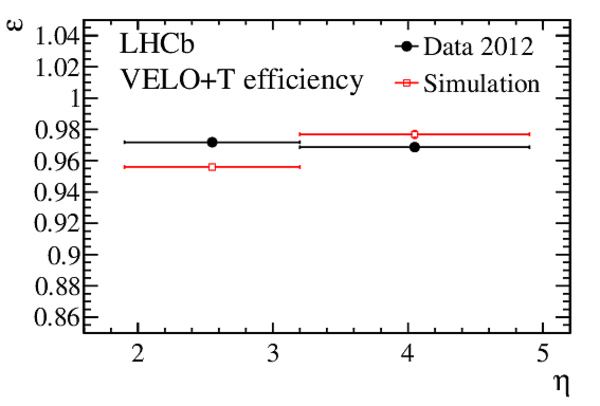
Track reconstruction efficiencies for the 2012 data and for weighted simulation. The left-hand column shows the results of the combined method while the right-hand column shows the results of the long method. The efficiency is shown as a function of $p$ (first row), $\eta$ (second row), $N_{\rm track}$ (third row), and $N_{\rm PV}$ (fourth row). The error bars indicate the statistical uncertainties. |
combin[..].pdf [14 KiB] HiDef png [143 KiB] Thumbnail [145 KiB] |
|
|
Long_e[..].pdf [14 KiB] HiDef png [145 KiB] Thumbnail [144 KiB] |
|
|
|
combin[..].pdf [13 KiB] HiDef png [117 KiB] Thumbnail [122 KiB] |
|
|
|
Long_e[..].pdf [14 KiB] HiDef png [117 KiB] Thumbnail [120 KiB] |

|
|
|
combin[..].pdf [14 KiB] HiDef png [133 KiB] Thumbnail [134 KiB] |

|
|
|
Long_e[..].pdf [14 KiB] HiDef png [133 KiB] Thumbnail [132 KiB] |

|
|
|
combin[..].pdf [14 KiB] HiDef png [126 KiB] Thumbnail [128 KiB] |

|
|
|
Long_e[..].pdf [14 KiB] HiDef png [125 KiB] Thumbnail [127 KiB] |

|
|
|
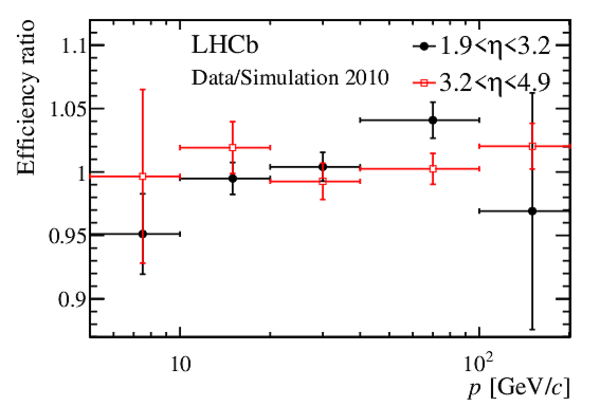
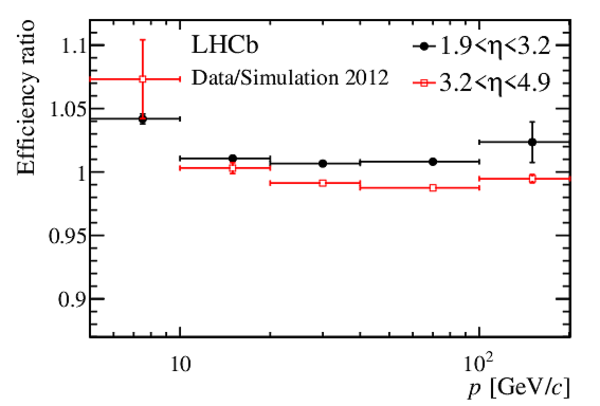
Track reconstruction efficiency ratios as a function of $p$ between data and simulation for (left) 2010 data, (right) 2011 data, and (bottom) 2012 data. |
ratioP[..].pdf [14 KiB] HiDef png [117 KiB] Thumbnail [112 KiB] |
|
|
ratioP[..].pdf [14 KiB] HiDef png [107 KiB] Thumbnail [105 KiB] |

|
|
|
ratioP[..].pdf [14 KiB] HiDef png [109 KiB] Thumbnail [107 KiB] |
|
|
|
Animated gif made out of all figures. |
DP-2013-002.gif Thumbnail |

|
![HiDef png [100 KiB]](Directory_LHCb-DP-2013-002/hidef_lhcb.png)
![HiDef png [70 KiB]](Directory_LHCb-DP-2013-002/hidef_trackEffIllustrationDownstream.png)
![HiDef png [67 KiB]](Directory_LHCb-DP-2013-002/hidef_trackEffIllustrationVeloMuon.png)
![HiDef png [67 KiB]](Directory_LHCb-DP-2013-002/hidef_trackEffIllustrationMuonTT.png)
![HiDef png [220 KiB]](Directory_LHCb-DP-2013-002/hidef_Velo_massFit2011.png)
![HiDef png [226 KiB]](Directory_LHCb-DP-2013-002/hidef_Tstation_massFit2011.png)
![HiDef png [199 KiB]](Directory_LHCb-DP-2013-002/hidef_Long_massFit2011.png)
![HiDef png [226 KiB]](Directory_LHCb-DP-2013-002/hidef_Standard_massFit.png)
![HiDef png [148 KiB]](Directory_LHCb-DP-2013-002/hidef_combined_effVsP2010.png)
![HiDef png [148 KiB]](Directory_LHCb-DP-2013-002/hidef_Long_effVsP2010.png)
![HiDef png [119 KiB]](Directory_LHCb-DP-2013-002/hidef_combined_effVsEta2010.png)
![HiDef png [118 KiB]](Directory_LHCb-DP-2013-002/hidef_Long_effVsEta2010.png)
![HiDef png [140 KiB]](Directory_LHCb-DP-2013-002/hidef_combined_effVstrackmult2010.png)
![HiDef png [138 KiB]](Directory_LHCb-DP-2013-002/hidef_Long_effVstrackmult2010.png)
![HiDef png [133 KiB]](Directory_LHCb-DP-2013-002/hidef_combined_effVsnpv2010.png)
![HiDef png [132 KiB]](Directory_LHCb-DP-2013-002/hidef_Long_effVsnpv2010.png)
![HiDef png [142 KiB]](Directory_LHCb-DP-2013-002/hidef_combined_effVsP2011S20MC17.png)
![HiDef png [144 KiB]](Directory_LHCb-DP-2013-002/hidef_Long_effVsP2011S20MC17.png)
![HiDef png [116 KiB]](Directory_LHCb-DP-2013-002/hidef_combined_effVsEta2011S20MC17.png)
![HiDef png [116 KiB]](Directory_LHCb-DP-2013-002/hidef_Long_effVsEta2011S20MC17.png)
![HiDef png [132 KiB]](Directory_LHCb-DP-2013-002/hidef_combined_effVstrackmult2011S20MC17.png)
![HiDef png [131 KiB]](Directory_LHCb-DP-2013-002/hidef_Long_effVstrackmult2011S20MC17.png)
![HiDef png [124 KiB]](Directory_LHCb-DP-2013-002/hidef_combined_effVsnpv2011S20MC17.png)
![HiDef png [123 KiB]](Directory_LHCb-DP-2013-002/hidef_Long_effVsnpv2011S20MC17.png)
![HiDef png [143 KiB]](Directory_LHCb-DP-2013-002/hidef_combined_effVsP2012S20.png)
![HiDef png [145 KiB]](Directory_LHCb-DP-2013-002/hidef_Long_effVsP2012S20.png)
![HiDef png [117 KiB]](Directory_LHCb-DP-2013-002/hidef_combined_effVsEta2012S20.png)
![HiDef png [117 KiB]](Directory_LHCb-DP-2013-002/hidef_Long_effVsEta2012S20.png)
![HiDef png [133 KiB]](Directory_LHCb-DP-2013-002/hidef_combined_effVstrackmult2012S20.png)
![HiDef png [133 KiB]](Directory_LHCb-DP-2013-002/hidef_Long_effVstrackmult2012S20.png)
![HiDef png [126 KiB]](Directory_LHCb-DP-2013-002/hidef_combined_effVsnpv2012S20.png)
![HiDef png [125 KiB]](Directory_LHCb-DP-2013-002/hidef_Long_effVsnpv2012S20.png)
![HiDef png [117 KiB]](Directory_LHCb-DP-2013-002/hidef_ratioPlot2010.png)
![HiDef png [107 KiB]](Directory_LHCb-DP-2013-002/hidef_ratioPlot2011S20MC17.png)
![HiDef png [109 KiB]](Directory_LHCb-DP-2013-002/hidef_ratioPlot2012S20.png)
Tables and captions
|
Settings of the software trigger selection as a function of data taking period. Only the tag muon is required to pass the selection. For more information see Refs. [26,27,28,9]. |
Table_1.pdf [37 KiB] HiDef png [58 KiB] Thumbnail [27 KiB] tex code |

|
|
Selection requirements on the tag and probe tracks and on the combination into a $ { J \mskip -3mu/\mskip -2mu\psi \mskip 2mu} $ candidate for the three different methods. |
Table_2.pdf [49 KiB] HiDef png [108 KiB] Thumbnail [51 KiB] tex code |

|
|
Track reconstruction efficiencies in % for the individual running periods using the long method for positive and negative muons and different magnetic field polarities (statistical uncertainties only). |
Table_3.pdf [49 KiB] HiDef png [61 KiB] Thumbnail [30 KiB] tex code |

|
![HiDef png [58 KiB]](Directory_LHCb-DP-2013-002/hidef_Table_1.png)
![HiDef png [108 KiB]](Directory_LHCb-DP-2013-002/hidef_Table_2.png)
![HiDef png [61 KiB]](Directory_LHCb-DP-2013-002/hidef_Table_3.png)
Created on 18 October 2023.