Information
LHCb-DP-2017-001
arXiv:1708.00819 [PDF]
(Submitted on 02 Aug 2017)
JINST 12 (2017) no.11, P11016
Inspire 1614152
Tools
Abstract
The LHCb Outer Tracker is a gaseous detector covering an area of $5\times 6 m^2$ with 12 double layers of straw tubes. The performance of the detector is presented based on data of the LHC Run 2 running period from 2015 and 2016. Occupancies and operational experience for data collected in $p p$, pPb and PbPb collisions are described. An updated study of the ageing effects is presented showing no signs of gain deterioration or other radiation damage effects. In addition several improvements with respect to LHC Run 1 data taking are introduced. A novel real-time calibration of the time-alignment of the detector and the alignment of the single monolayers composing detector modules are presented, improving the drift-time and position resolution of the detector by 20%. Finally, a potential use of the improved resolution for the timing of charged tracks is described, showing the possibility to identify low-momentum hadrons with their time-of-flight.
Figures and captions
|
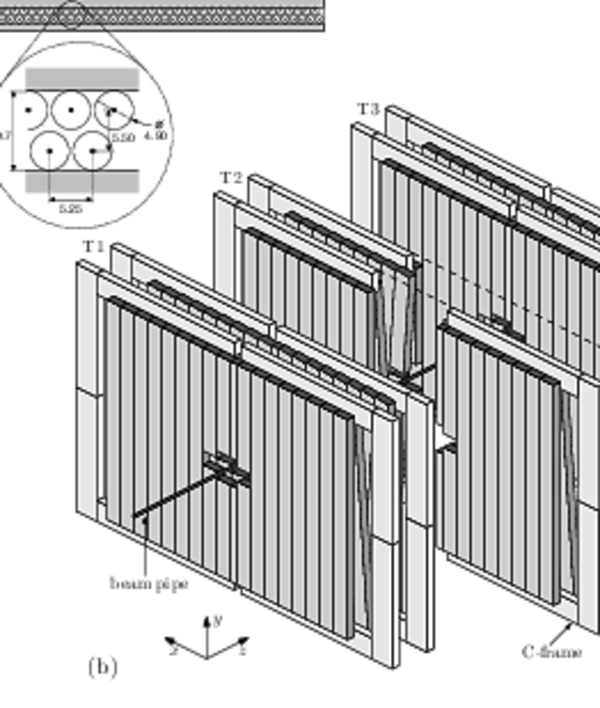
(a) OT module cross section, with distances in mm. (b) Arrangement of OT straw-tube modules in layers and stations. |
Fig_1.pdf [55 KiB] HiDef png [547 KiB] Thumbnail [333 KiB] tex code |
|
|
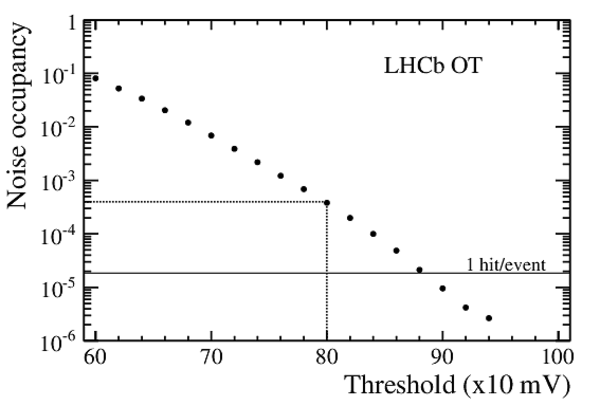
(a) Event occupancy for the OT in Run 1 (dottet line) and Run 2 (solid line). The event occupancy in the OT is on average 13% in Run 2. (b) Occupancy of noise hits as a function of the discriminator threshold. |
occupa[..].pdf [15 KiB] HiDef png [94 KiB] Thumbnail [50 KiB] |

|
|
noise.pdf [13 KiB] HiDef png [91 KiB] Thumbnail [56 KiB] |
|
|
|
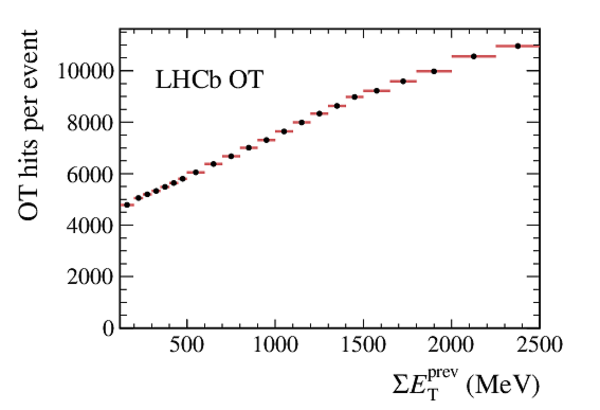
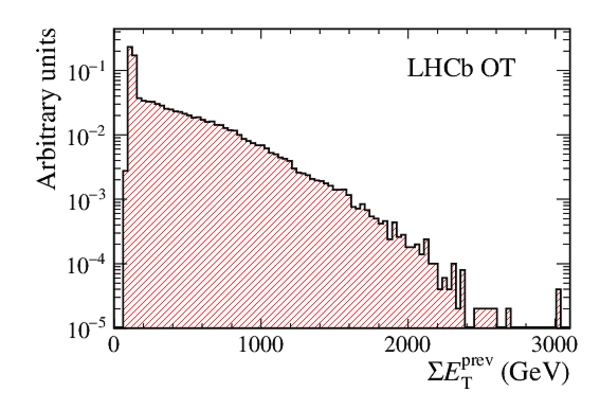
(a) The average number of recorded hits as a function of the activity in the previous bunch crossing, expressed as the scalar sum of transverse energy in all calorimeter clusters, $\Sigma E_T$. (b) The distribution of $\Sigma E_T$ for unbiased events, where one unit corresponds to 24 MeV. |
occupa[..].pdf [14 KiB] HiDef png [125 KiB] Thumbnail [120 KiB] |
|
|
sumetp[..].pdf [14 KiB] HiDef png [392 KiB] Thumbnail [300 KiB] |
|
|
|
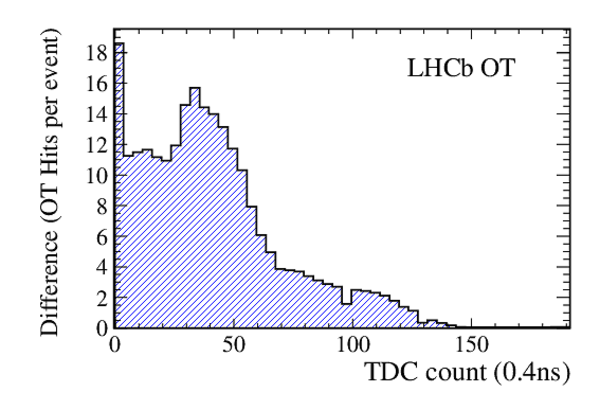
The recorded drift time spectrum for all hits in the Outer Tracker for no-bias events with $25 {\mathrm{ ns}} $ bunch spacing. (a) in blue, the same spectrum recorded while keeping only events with $\Sigma E_T (Prev) \leq 1000$. (b) the difference of the two TDC spectra, scaled such the difference is 0 at the $TDC=150$ bin. |
effect[..].pdf [15 KiB] HiDef png [492 KiB] Thumbnail [326 KiB] |

|
|
difference.pdf [14 KiB] HiDef png [299 KiB] Thumbnail [236 KiB] |
|
|
|
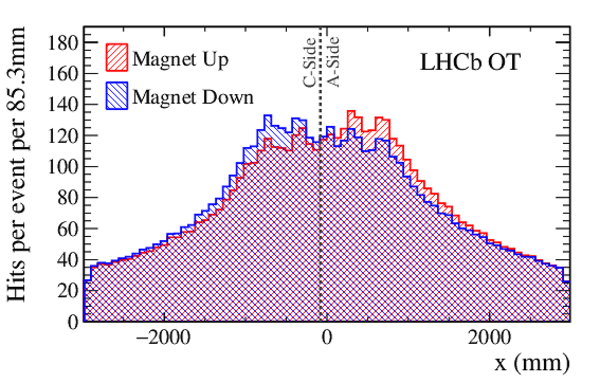
The hit distribution is shown for both magnet polarities, using 30,000 random events for both samples, without any trigger requirement. The vertical dashed line indicates the mechanical split between the two detector halves, at $x=-8$ cm. |
magup_[..].pdf [14 KiB] HiDef png [748 KiB] Thumbnail [414 KiB] |
|
|
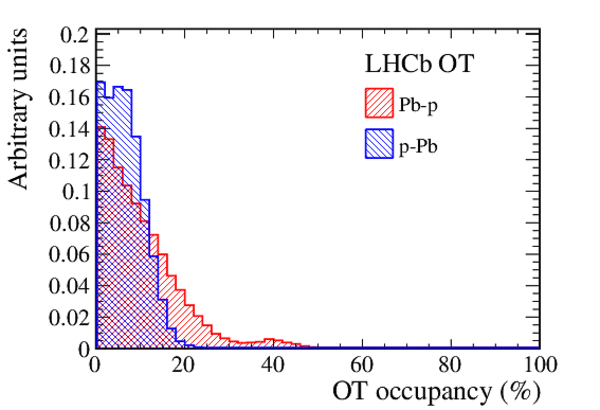
The average number of recorded hits (a) in minimum bias proton-proton and $ {\rm PbPb}$ collisions and (b) $ p{\rm Pb}$ and $ {\rm Pb}p$ collisions. |
total_[..].pdf [14 KiB] HiDef png [223 KiB] Thumbnail [181 KiB] |

|
|
total_[..].pdf [14 KiB] HiDef png [291 KiB] Thumbnail [214 KiB] |
|
|
|
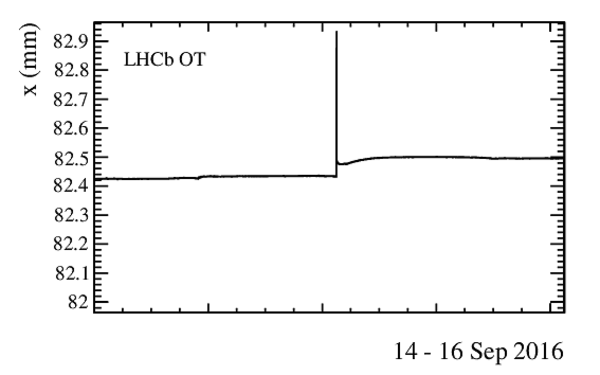
(a) Movements in $x$ of one bottom corner of a C-frame (T2-XU) are shown during the data taking period in 2016. (b) Movement in $x$ of a point at the top corner of an opened and closed C-frame (T3-VX, C-side) in September 2016. (The absolute value of the $x$-coordinate is arbitrary.) |
Rasnik[..].pdf [1 MiB] HiDef png [79 KiB] Thumbnail [45 KiB] |

|
|
Rasnik[..].pdf [44 KiB] HiDef png [73 KiB] Thumbnail [40 KiB] |
|
|
|
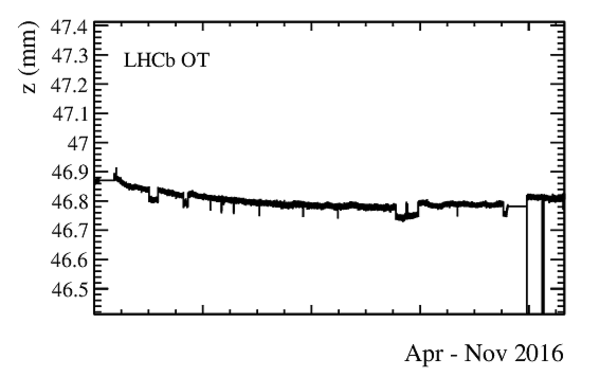
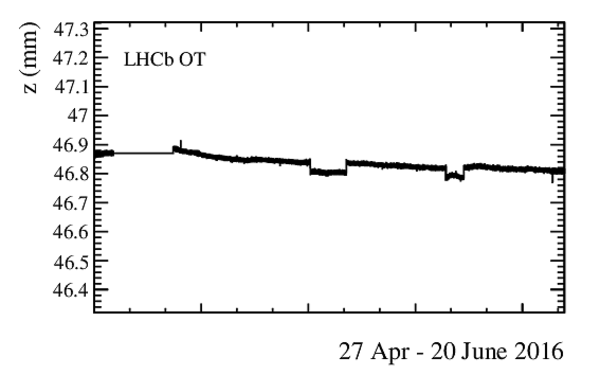
The $z$--coordinate of the bridge positions as a function of time (a) for the data acquired in 2016 and (b) the more detailed view of the data from 27th of April till 20th of June. The two visible dips correspond to the two occasions where the magnet was switched off and on. |
Rasnik[..].pdf [2 MiB] HiDef png [79 KiB] Thumbnail [47 KiB] |
|
|
Rasnik[..].pdf [576 KiB] HiDef png [76 KiB] Thumbnail [43 KiB] |
|
|
|
(a) Example hit efficiency plot as a function of amplifier threshold for the first layer. (b) Average gain variation as a function of the delivered luminosity. |
Scurve.pdf [14 KiB] HiDef png [138 KiB] Thumbnail [129 KiB] |

|
|
trendp[..].pdf [8 KiB] HiDef png [140 KiB] Thumbnail [133 KiB] |

|
|
|
Example distribution of the differences between the $t_{0}$ values before and after the first iteration of the calibration (black), and between the first and the second iteration (red). |
it12_r[..].pdf [14 KiB] HiDef png [147 KiB] Thumbnail [144 KiB] |

|
|
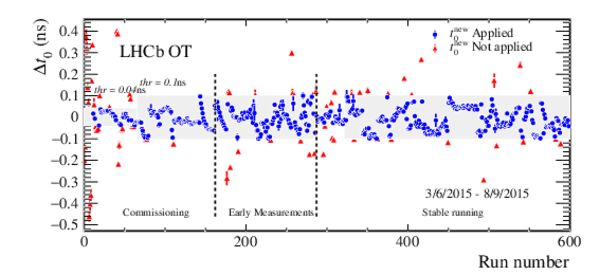
Calculated global drift-time offset differences ($\Delta t_{0}$) for Run 2 data taking period 3 July 2015 - 14 Sept 2015. Red triangles show calibrations above threshold which are applied to data, while blue dots show calibrations which are within tolerance and are not applied. The threshold values used are represented with the shaded region: the periods with lower threshold were during commissioning of this algorithm. |
OTt0ca[..].pdf [33 KiB] HiDef png [329 KiB] Thumbnail [208 KiB] |
|
|
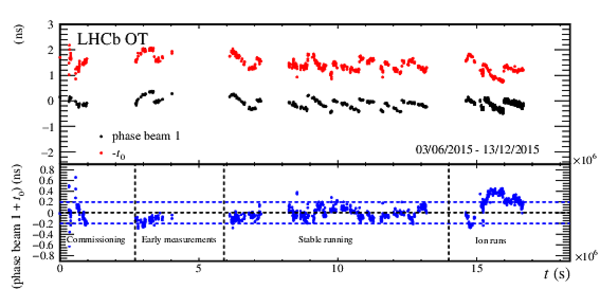
Absolute stability of the value of the global time offset $t_0$ obtained comparing the $t_0$ absolute value with the beam-1 phase. The large scatter in the initial points is due to the phase of commissioning of the algorithm. The $t_0$ measurements towards the end of the 2015 data taking period correspond to the LHC operation with Pb ions. |
Absolu[..].pdf [159 KiB] HiDef png [205 KiB] Thumbnail [171 KiB] |
|
|
The drift time versus the unbiased distance distribution with the overlaid TR-relation curve, obtained from the fit (black line). |
TR_col[..].pdf [108 KiB] HiDef png [985 KiB] Thumbnail [678 KiB] |

|
|
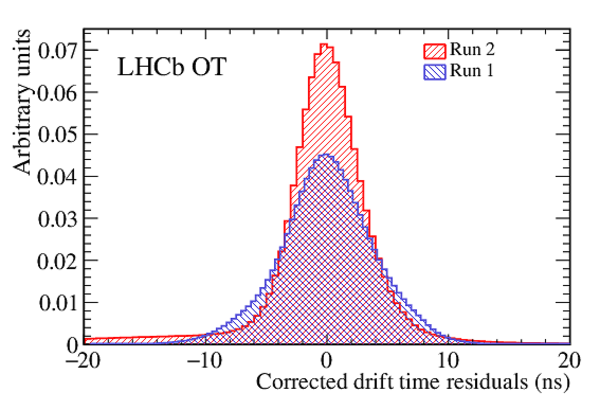
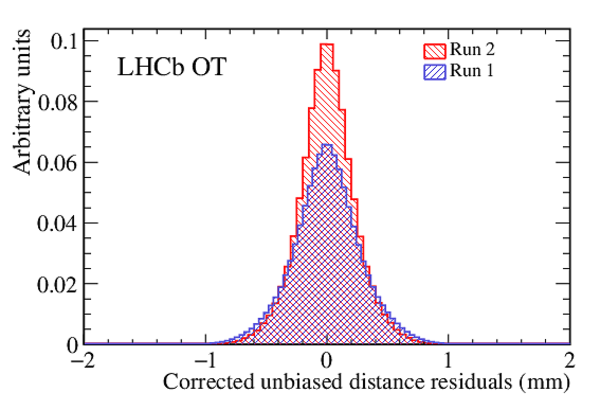
(a) Drift-time residual distribution and (b) hit distance residual distribution. |
t_res_[..].pdf [15 KiB] HiDef png [418 KiB] Thumbnail [276 KiB] |
|
|
dist_r[..].pdf [14 KiB] HiDef png [330 KiB] Thumbnail [220 KiB] |
|
|
|
(a) The number of OT hits per track $N$, where the drift-time is used. (b) The uncertainty on the time per track, as estimated from time resolution per hit, $\sigma_t/\sqrt{N}$. |
OThits[..].pdf [13 KiB] HiDef png [1 MiB] Thumbnail [147 KiB] |

|
|
trackT[..].pdf [14 KiB] HiDef png [482 KiB] Thumbnail [132 KiB] |

|
|
|
The difference in time-of-flight between protons and pions as a function of their momentum. |
plotBe[..].pdf [14 KiB] HiDef png [101 KiB] Thumbnail [80 KiB] |

|
|
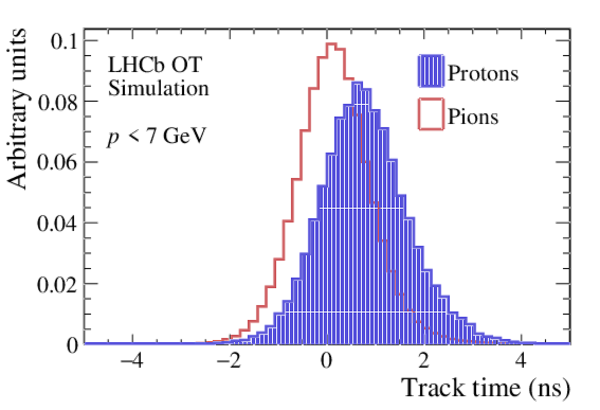
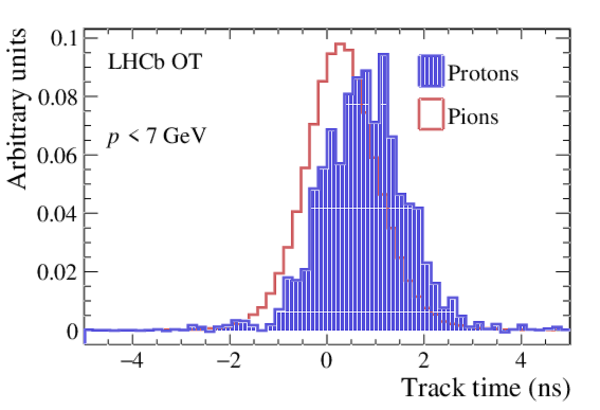
The distribution of track times for protons and pions with $p<7 {\mathrm{ Ge V /}c} $ in (a) simulation and (b) in data. |
MC_Tra[..].pdf [14 KiB] HiDef png [877 KiB] Thumbnail [168 KiB] |
|
|
Data15[..].pdf [14 KiB] HiDef png [851 KiB] Thumbnail [163 KiB] |
|
|
|
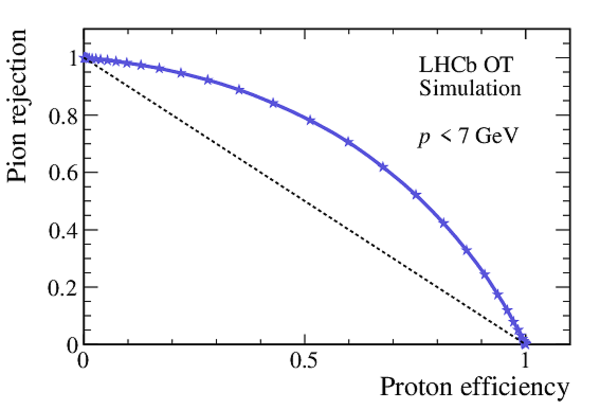
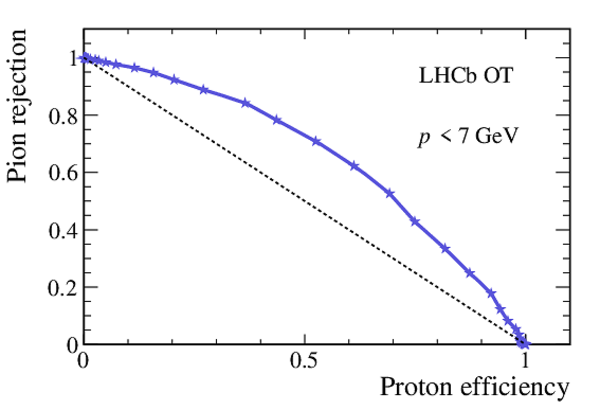
The pion rejection rate as a function of the proton efficiency for (a) simulation and (b) data. |
MC_ROC[..].pdf [17 KiB] HiDef png [166 KiB] Thumbnail [132 KiB] |
|
|
Data15[..].pdf [16 KiB] HiDef png [157 KiB] Thumbnail [124 KiB] |
|
|
|
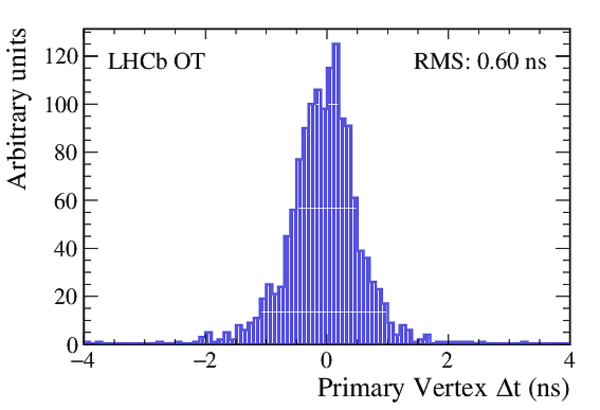
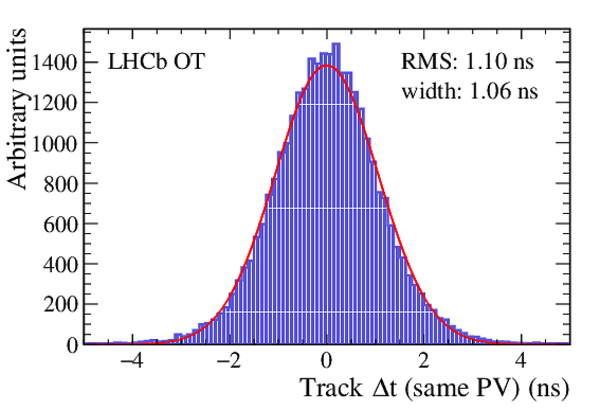
(a) The difference between the average time per primary vertex, for events with two reconstructed primary vertices. (b) The difference between the time of two tracks belonging to the same primary vertex. |
PVTimeDiff.pdf [13 KiB] HiDef png [643 KiB] Thumbnail [129 KiB] |
|
|
trackS[..].pdf [15 KiB] HiDef png [1 MiB] Thumbnail [184 KiB] |
|
|
|
Animated gif made out of all figures. |
DP-2017-001.gif Thumbnail |

|
![HiDef png [547 KiB]](Directory_LHCb-DP-2017-001/hidef_Fig_1.png)
![HiDef png [94 KiB]](Directory_LHCb-DP-2017-001/hidef_occupancy-run1-vs-run2.png)
![HiDef png [91 KiB]](Directory_LHCb-DP-2017-001/hidef_noise.png)
![HiDef png [125 KiB]](Directory_LHCb-DP-2017-001/hidef_occupancy_vs_prevet_profile.png)
![HiDef png [392 KiB]](Directory_LHCb-DP-2017-001/hidef_sumetprevspectrum.png)
![HiDef png [492 KiB]](Directory_LHCb-DP-2017-001/hidef_effect_of_sumet_prev.png)
![HiDef png [299 KiB]](Directory_LHCb-DP-2017-001/hidef_difference.png)
![HiDef png [748 KiB]](Directory_LHCb-DP-2017-001/hidef_magup_magdown_occupancy_data.png)
![HiDef png [223 KiB]](Directory_LHCb-DP-2017-001/hidef_total_occupancy_overview_pp_pbpb.png)
![HiDef png [291 KiB]](Directory_LHCb-DP-2017-001/hidef_total_occupancy_overview_pbp_ppb.png)
![HiDef png [79 KiB]](Directory_LHCb-DP-2017-001/hidef_RasnikFigures_2016_April-November_T2XU_Q1inner_x.png)
![HiDef png [73 KiB]](Directory_LHCb-DP-2017-001/hidef_RasnikFigures_2016_14-16Sep_T3VX_Cframe_x.png)
![HiDef png [79 KiB]](Directory_LHCb-DP-2017-001/hidef_RasnikFigures_2016_April-November_Bridge_Q13_z.png)
![HiDef png [76 KiB]](Directory_LHCb-DP-2017-001/hidef_RasnikFigures_2016_27April-20June_Bridge_Q13_z.png)
![HiDef png [138 KiB]](Directory_LHCb-DP-2017-001/hidef_Scurve.png)
![HiDef png [140 KiB]](Directory_LHCb-DP-2017-001/hidef_trendplot_lumi_all.png)
![HiDef png [147 KiB]](Directory_LHCb-DP-2017-001/hidef_it12_run135673.png)
![HiDef png [329 KiB]](Directory_LHCb-DP-2017-001/hidef_OTt0calibration2015_first600calib.png)
![HiDef png [205 KiB]](Directory_LHCb-DP-2017-001/hidef_Absolutet0_BeamPhase1_v3.png)
![HiDef png [985 KiB]](Directory_LHCb-DP-2017-001/hidef_TR_colz_cp56.png)
![HiDef png [418 KiB]](Directory_LHCb-DP-2017-001/hidef_t_res_corrected.png)
![HiDef png [330 KiB]](Directory_LHCb-DP-2017-001/hidef_dist_res_corrected.png)
![HiDef png [1 MiB]](Directory_LHCb-DP-2017-001/hidef_OThitsPerTrack.png)
![HiDef png [482 KiB]](Directory_LHCb-DP-2017-001/hidef_trackTimeErr.png)
![HiDef png [101 KiB]](Directory_LHCb-DP-2017-001/hidef_plotBetas_timePionProtonDiff.png)
![HiDef png [877 KiB]](Directory_LHCb-DP-2017-001/hidef_MC_TrackTimes_sig2212_bkg211_cutPs7.png)
![HiDef png [851 KiB]](Directory_LHCb-DP-2017-001/hidef_Data15_TrackTimes_sig_proton_bkg_pion_cutPs7.png)
![HiDef png [166 KiB]](Directory_LHCb-DP-2017-001/hidef_MC_ROC_sig2212_bkg211_cutPs7.png)
![HiDef png [157 KiB]](Directory_LHCb-DP-2017-001/hidef_Data15_ROC_sig_proton_bkg_pion_cutPs7.png)
![HiDef png [643 KiB]](Directory_LHCb-DP-2017-001/hidef_PVTimeDiff.png)
![HiDef png [1 MiB]](Directory_LHCb-DP-2017-001/hidef_trackSamePVdeltaT.png)
Created on 18 October 2023.