Information
LHCb-DP-2018-003
arXiv:1809.05063 [PDF]
(Submitted on 13 Sep 2018)
JINST 15 (2020), P08016
Inspire 1693784
Tools
Abstract
This paper presents the techniques used to monitor radiation damage in the LHCb Tracker Turicensis during the LHC Runs 1 and 2. Bulk leakage currents in the silicon sensors were monitored continuously, while the full depletion voltages of the sensors were estimated at regular intervals by performing dedicated scans of the charge collection efficiency as a function of the applied bias voltage. Predictions of the expected leakage currents and full depletion voltages are extracted from the simulated radiation profile, the luminosity delivered by the LHC, and the thermal history of the silicon sensors. Good agreement between measurements and predictions is found.
Figures and captions
|
Layout of the LHCb detector: vertex locator (VELO), Ring-Image Cherenkov counters (RICH1 and RICH2), tracking stations upstream (TT) and downstream (T1-T3) of the spectrometer dipole magnet, scintillating pad detector used for trigger purposes (SPD), pre-shower detector (PS) and electromagnetic calorimeter (ECAL), hadronic calorimeter (HCAL), and muon stations (M1-M5). LHCb uses a right-handed cartesian coordinate system with its origin at the nominal interaction point, the $z$-axis pointing along the LHC beam axis and the $y$ axis pointing upwards. |
LHCb.pdf [1 MiB] HiDef png [684 KiB] Thumbnail [322 KiB] |

|
|
Layout of the TT, with the LHC beam pipe passing through an opening in the centre of the detection layers. The four detection layers are labelled TTaX, TTaU, TTbV and TTbX. The four different types of read-out sectors employed in each of the detection layers are indicated by different shading: read-out sectors close to the beam pipe consist of a single silicon sensor, other read-out sectors consist of two, three or four silicon sensors that are connected together in series. |
TT_layout.pdf [82 KiB] HiDef png [698 KiB] Thumbnail [356 KiB] |

|
|
Left: evolution of the integrated luminosity for $pp$ collisions in each year of LHC operation. Right: expected 1- $\mathrm{ Me V}$ neutron equivalent fluence per proton-proton collision, with the TTaU detector layer overlaid. These results were obtained from a Fluka simulation of the LHCb detector, assuming a proton-proton collision energy of 14 TeV. |
lumi_s[..].pdf [31 KiB] HiDef png [241 KiB] Thumbnail [181 KiB] |

|
|
map_tt[..].pdf [467 KiB] HiDef png [1 MiB] Thumbnail [659 KiB] |

|
|
|
Evolution of the leakage current for the different HV channels connected to one-sensor read-out sectors in TT as a function of (a) the delivered integrated luminosity measured and (b) time. The red curves show channels in the detector layer TTaU, the blue one in TTbV. The predicted evolution is shown in black while the grey band shows its uncertainty, computed from the uncertainty on the model parameters, on the Fluka simulation and on the temperature measurements. The uncertainty does not account for the range of fluence expected across the sectors shown. |
TT1_il[..].pdf [613 KiB] HiDef png [364 KiB] Thumbnail [199 KiB] |

|
|
TT1_il[..].pdf [1 MiB] HiDef png [243 KiB] Thumbnail [156 KiB] |

|
|
|
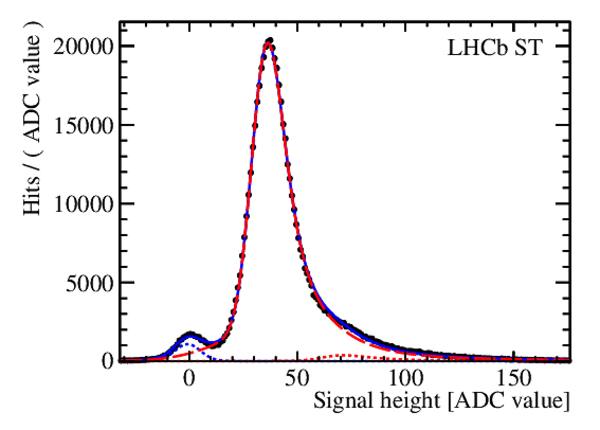
Signal height distribution for hits associated to tracks in the TT for two different bias voltage values. The fitted distribution is described in the text. |
TT_sig[..].pdf [36 KiB] HiDef png [196 KiB] Thumbnail [149 KiB] |

|
|
TT_sig[..].pdf [37 KiB] HiDef png [199 KiB] Thumbnail [150 KiB] |
|
|
|
Pulse shapes recorded in the TT for two different bias voltage values. The fitted function is shown in Eq. (6). |
TT_pul[..].pdf [20 KiB] HiDef png [102 KiB] Thumbnail [82 KiB] |

|
|
TT_pul[..].pdf [20 KiB] HiDef png [96 KiB] Thumbnail [77 KiB] |

|
|
|
Integrated charge as a function of the applied bias voltage for a central TT read-out sector measured in the CCE scans from (a) April 2012 and (b) September 2017. The decrease of $V_\text{depl}$ is clearly visible. |
TT_vol[..].pdf [43 KiB] HiDef png [126 KiB] Thumbnail [122 KiB] |

|
|
TT_vol[..].pdf [39 KiB] HiDef png [128 KiB] Thumbnail [115 KiB] |

|
|
|
Distributions for all analysed read-out sectors of (a) the ratio $r$ defined in Eq.7; (b) the relative difference between $V_\text{depl}$ and $V_\text{depl}^\text{2011-07-04}$ as discussed in the main text; (c) the differences in $V_\text{depl}$ obtained from a fifth-order spline and from a linear interpolation. The solid black line in (a) highlights the value of the average $\overline{r}$. |
TT_rat[..].pdf [13 KiB] HiDef png [77 KiB] Thumbnail [73 KiB] |

|
|
TT_sys[..].pdf [14 KiB] HiDef png [105 KiB] Thumbnail [99 KiB] |

|
|
|
TT_sys[..].pdf [13 KiB] HiDef png [76 KiB] Thumbnail [66 KiB] |

|
|
|
Measured effective depletion voltage (red points) in the area of two TT sensors: one just above the beam pipe (a) and one further away (b), whose positions are indicated in Figure 11(a). The black point and error bars correspond to the CCE scan used to calibrate the ratio $r$. The statistical contribution to the total uncertainty is indicated by the solid error bars. The predicted evolution of the depletion voltage, based on the initial depletion voltage measured after sensor production, the running conditions and the Hamburg model, is shown as a solid black line. The grey bands show the uncertainty on the predicted evolution of $V_\text{depl}$, while the black dashed lines account for the $\pm 2.5$ V uncertainty on the measurement of the initial depletion voltage $V^0_\text{depl}$ in $C-V$ scans. |
TT_tim[..].pdf [102 KiB] HiDef png [170 KiB] Thumbnail [134 KiB] |

|
|
TT_tim[..].pdf [96 KiB] HiDef png [141 KiB] Thumbnail [112 KiB] |

|
|
|
Measured evolution of $V_\text{depl}$ as a function of the 1-MeV neutron equivalent fluence obtained from the running conditions and Fluka for a TT sector in the area close to the beam pipe (a) and for all of the read-out sectors in the TT (b). The innermost sectors are subdivided in regions separating tracks traversing the detector at a distance larger or smaller than 75 mm from the beam axis. The error bars of the data points display the sum of the statistical and systematic uncertainty. The solid black curve shows the predictions based on the stable damage part of the Hamburg model, the grey shaded region its uncertainty due to the parameter uncertainty of the model. The initial depletion voltage $V^0_{\text{depl}}$ for the Hamburg model prediction in (b) is averaged among all sectors, and the dashed black lines show the standard deviation of the distribution of the initial $V^0_\text{depl}$ values. |
TT_dep[..].pdf [25 KiB] HiDef png [156 KiB] Thumbnail [127 KiB] |

|
|
TT_dep[..].pdf [62 KiB] HiDef png [252 KiB] Thumbnail [191 KiB] |

|
|
|
Sketch highlighting the TT sectors analysed during the various CCE scans (a). The greyed out sectors were excluded due to poor statistics. The two sectors highlighted with dashes, just above the beam pipe and below the beam pipe on the left hand side, are those which evolution is shown in Figure 9(a) and Figure 9(b), respectively. Absolute change in $V_\text{depl}$ in the innermost region of TT in January 2013 and September 2018 is shown in (b) and (c) respectively. The white sector in (c) became inoperative in August 2017 due to an HV connector issue. |
TT_sectors.pdf [14 KiB] HiDef png [863 KiB] Thumbnail [653 KiB] |

|
|
tt_map[..].pdf [151 KiB] HiDef png [243 KiB] Thumbnail [451 KiB] |

|
|
|
tt_map[..].pdf [145 KiB] HiDef png [286 KiB] Thumbnail [506 KiB] |

|
|
|
Animated gif made out of all figures. |
DP-2018-003.gif Thumbnail |

|
![HiDef png [684 KiB]](Directory_LHCb-DP-2018-003/hidef_LHCb.png)
![HiDef png [698 KiB]](Directory_LHCb-DP-2018-003/hidef_TT_layout.png)
![HiDef png [241 KiB]](Directory_LHCb-DP-2018-003/hidef_lumi_squared.png)
![HiDef png [1 MiB]](Directory_LHCb-DP-2018-003/hidef_map_tt_larger_with_grid.png)
![HiDef png [364 KiB]](Directory_LHCb-DP-2018-003/hidef_TT1_ileak_lumi_wide.png)
![HiDef png [243 KiB]](Directory_LHCb-DP-2018-003/hidef_TT1_ileak_time_wide.png)
![HiDef png [196 KiB]](Directory_LHCb-DP-2018-003/hidef_TT_signal_LV.png)
![HiDef png [199 KiB]](Directory_LHCb-DP-2018-003/hidef_TT_signal_HV.png)
![HiDef png [102 KiB]](Directory_LHCb-DP-2018-003/hidef_TT_pulse_LV.png)
![HiDef png [96 KiB]](Directory_LHCb-DP-2018-003/hidef_TT_pulse_HV.png)
![HiDef png [126 KiB]](Directory_LHCb-DP-2018-003/hidef_TT_voltage_early.png)
![HiDef png [128 KiB]](Directory_LHCb-DP-2018-003/hidef_TT_voltage_late.png)
![HiDef png [77 KiB]](Directory_LHCb-DP-2018-003/hidef_TT_ratio_hist.png)
![HiDef png [105 KiB]](Directory_LHCb-DP-2018-003/hidef_TT_systematics_r.png)
![HiDef png [76 KiB]](Directory_LHCb-DP-2018-003/hidef_TT_systematics_spline.png)
![HiDef png [170 KiB]](Directory_LHCb-DP-2018-003/hidef_TT_time_evolv_inner.png)
![HiDef png [141 KiB]](Directory_LHCb-DP-2018-003/hidef_TT_time_evolv_outer.png)
![HiDef png [156 KiB]](Directory_LHCb-DP-2018-003/hidef_TT_deplVphiN_sector.png)
![HiDef png [252 KiB]](Directory_LHCb-DP-2018-003/hidef_TT_deplVphiN.png)
![HiDef png [863 KiB]](Directory_LHCb-DP-2018-003/hidef_TT_sectors.png)
![HiDef png [243 KiB]](Directory_LHCb-DP-2018-003/hidef_tt_map_3478.png)
![HiDef png [286 KiB]](Directory_LHCb-DP-2018-003/hidef_tt_map_7211.png)
Tables and captions
|
Parameters for the leakage current predictions. |
Table_1.pdf [61 KiB] HiDef png [32 KiB] Thumbnail [15 KiB] tex code |

|
|
Summary of CCE scans dates and corresponding integrated delivered luminosity. |
Table_2.pdf [34 KiB] HiDef png [199 KiB] Thumbnail [97 KiB] tex code |

|
|
Parameters for the depletion voltage simulation by the Hamburg model [10]. |
Table_3.pdf [61 KiB] HiDef png [47 KiB] Thumbnail [51 KiB] tex code |

|
![HiDef png [32 KiB]](Directory_LHCb-DP-2018-003/hidef_Table_1.png)
![HiDef png [199 KiB]](Directory_LHCb-DP-2018-003/hidef_Table_2.png)
![HiDef png [47 KiB]](Directory_LHCb-DP-2018-003/hidef_Table_3.png)
Created on 18 October 2023.