IOP : Centrality determination in heavy-ion collisions with the LHCb detector
[to restricted-access page]Information
LHCb-DP-2021-002
arXiv:2111.01607 [PDF]
(Submitted on 02 Nov 2021)
JINST 17 P05009
Inspire 1958536
Tools
Abstract
The centrality of heavy-ion collisions is directly related to the medium created therein. A procedure to determine the centrality of collisions with the LHCb detector is implemented for lead-lead collisions at $\sqrt{s_{\scriptscriptstyle\text{NN}}}=5 \mathrm{TeV}$ and lead-neon fixed-target collisions at $\sqrt{s_{\scriptscriptstyle\text{NN}}}=69 \mathrm{GeV}$. The energy deposits in the electromagnetic calorimeter are used to determine and define the centrality classes. The correspondence between the number of participants and the centrality for the lead-lead collisions is in good agreement with the correspondence found in other experiments, and the centrality measurements for the lead-neon collisions presented here are the first performed in fixed-target collisions at the LHC.
Figures and captions
|
A schematic view of a heavy-ion collision. The impact parameter $b$ is shown as well as the spectator nucleons and the participant nucleons. |
heavy-ion.pdf [210 KiB] Thumbnail [228 KiB] |

|
|
The 2pF density distribution $\rho$ as a function of the radius $r$. Here $w$ has been set to 0, $R=6\text{ fm} $ and $a=0.5\text{ fm} $. |
density.pdf [15 KiB] HiDef png [70 KiB] Thumbnail [60 KiB] |

|
|
(left) Number of VELO clusters and (right) energy deposited in the ECAL in PbPb collisions. The distribution of the VELO clusters exhibits a peak structure with a sharp fall at 45 000 clusters. This is related to the total number of readout channels in the VELO, leading to saturation for high occupancy events. |
velo_t[..].pdf [18 KiB] HiDef png [107 KiB] Thumbnail [56 KiB] |

|
|
ecal_t[..].pdf [18 KiB] HiDef png [88 KiB] Thumbnail [50 KiB] |

|
|
|
Number of VELO clusters as a function of ECAL energy for PbNe events without any requirement (left) and without any cluster in the PU stations (right). The red line indicates the population which corresponds to the very upstream events, the green line indicates the population which corresponds to ghost PbPb collisions and the black lines enclose the PbNe collisions of interest which present no clusters in the PU stations. |
nvc-ec[..].pdf [95 KiB] HiDef png [1 MiB] Thumbnail [443 KiB] |

|
|
nvc-ec[..].pdf [21 KiB] HiDef png [229 KiB] Thumbnail [142 KiB] |

|
|
|
(left) Number of VELO clusters and (right) energy deposited in the ECAL from PbNe collisions. |
nvc_si[..].pdf [13 KiB] HiDef png [86 KiB] Thumbnail [48 KiB] |

|
|
ecal_s[..].pdf [14 KiB] HiDef png [75 KiB] Thumbnail [46 KiB] |

|
|
|
Distribution of (left) $ N_\mathrm{{part}}$ , (middle) $ N_\mathrm{{coll}}$ and (right) $ N_\mathrm{{anc}}$ from the MC Glauber model for PbPb. For this $ N_\mathrm{{anc}}$ distribution, a value of $f=0.751$ was used. |
Npart_[..].pdf [36 KiB] HiDef png [88 KiB] Thumbnail [51 KiB] |

|
|
Ncoll_[..].pdf [52 KiB] HiDef png [98 KiB] Thumbnail [57 KiB] |

|
|
|
Nanc_N[..].pdf [41 KiB] HiDef png [92 KiB] Thumbnail [53 KiB] |

|
|
|
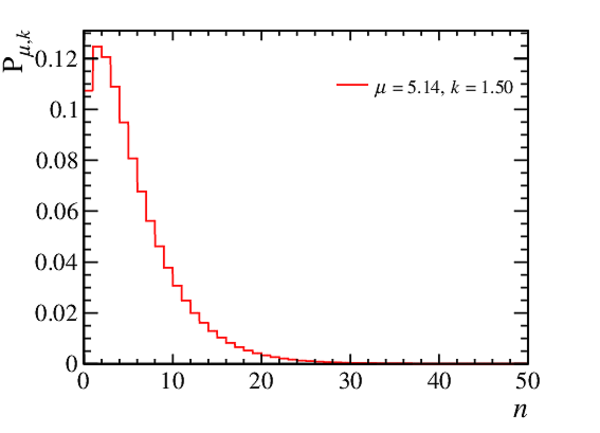
(left) Negative Binomial Distribution and (right) distribution of the number of outgoing particles from the MC Glauber model in PbPb collisions at $\sqrt{s_{\scriptscriptstyle\text{NN}}} = 5\text{ Te V} $. |
NBD_lb[..].pdf [22 KiB] HiDef png [94 KiB] Thumbnail [88 KiB] |
|
|
Nout_N[..].pdf [62 KiB] HiDef png [87 KiB] Thumbnail [48 KiB] |

|
|
|
Simulated distribution of the energy deposited in the ECAL for PbPb collisions. A mean energy deposition per particle of $\langle E^{\mathrm{PbPb}} \rangle = 10.4\text{ Ge V} $ is considered. |
simu_e[..].pdf [39 KiB] HiDef png [90 KiB] Thumbnail [52 KiB] |

|
|
Resulting PbPb simulated energy distribution in the ECAL for $k\in [1.0, 2.0]$. |
k_swee[..].pdf [161 KiB] HiDef png [181 KiB] Thumbnail [154 KiB] |

|
|
ECAL energy distribution comparison between PbPb data and MC glauber. The black histogram corresponds to the simulated distribution with $f=0.9$ which is then rescaled by $H_s$ (green dots) to match the data and compare the right shoulders. For the entire process $\mu$ was fixed to 3.85. |
fit_f0[..].pdf [48 KiB] HiDef png [195 KiB] Thumbnail [164 KiB] |

|
|
The $\chi^2$ values for 1000 steps in $f\in[0,1]$ for the PbPb case. The $\chi^2$ values have been fitted by a 7$^{th}$ degree polynomial whose minimum is at $f=0.83$. |
fit_ch[..].pdf [52 KiB] HiDef png [192 KiB] Thumbnail [150 KiB] |

|
|
The $\chi^2$ map for the coarse grid search in $f\in[0.60,0.93]$ and $\mu\in[3.7,9.0]$ for the PbPb case. The best fit corresponds to the values $f=0.866$ and $\mu=6.778$. |
chi2_t[..].pdf [17 KiB] HiDef png [194 KiB] Thumbnail [153 KiB] |

|
|
The top plots show a slice for (left) $f=0.798$ and for (right) $\mu=5.45$. From each slice, the minimum of the histogram is kept. The bottom plots show the result of doing this for all values of $f$ and $\mu$, that is, the $f$-parametrised minimum (left) and the $\mu$-parametrised minimum (right) for the PbPb case using the coarse grid. These are fitted by a $5^{th}$ and $6^{th}$ degree polynomial respectively whose minima are at $f=0.866$ and $\mu=6.778$. |
projec[..].pdf [13 KiB] HiDef png [183 KiB] Thumbnail [144 KiB] |

|
|
projec[..].pdf [13 KiB] HiDef png [174 KiB] Thumbnail [129 KiB] |

|
|
|
fit_mi[..].pdf [18 KiB] HiDef png [160 KiB] Thumbnail [133 KiB] |

|
|
|
fit_mi[..].pdf [17 KiB] HiDef png [118 KiB] Thumbnail [100 KiB] |

|
|
|
Map of $\chi^2$ values for the fine grid search in $f\in[0.79,0.92]$ and $\mu\in[5.7,7.9]$ for the PbPb case. The two shown best fits correspond to the results from two different methods (see text). |
chi2_t[..].pdf [22 KiB] HiDef png [361 KiB] Thumbnail [239 KiB] |

|
|
Final fit of the simulated energy distribution to the data for PbPb collisions. The best fit found is $(f,\mu)=(0.869, 6.814)$ with a corresponding $\chi^2/\mathrm{ndf} = 2.82$. The right figure corresponds to a close-up view of the left figure. |
fit_ec[..].pdf [58 KiB] HiDef png [189 KiB] Thumbnail [171 KiB] |

|
|
fit_ec[..].pdf [39 KiB] HiDef png [191 KiB] Thumbnail [161 KiB] |

|
|
|
Map of $\chi^2$ values for the coarse grid search in $f\in[0.0,1.0]$ and $\mu\in[1.0,3.4]$ for the PbNe case. The two best fits shown correspond to the results of two different methods described in the text. |
mu-f_p[..].pdf [78 KiB] HiDef png [1 MiB] Thumbnail [429 KiB] |

|
|
Map of $\chi^2$ values for the fine grid search in $f\in[0.8,1.0]$ and $\mu\in[2.9,3.4]$ for the PbNe case. The two shown best fits correspond to the results from two different methods described in the text. |
mu-f_p[..].pdf [190 KiB] HiDef png [1 MiB] Thumbnail [823 KiB] |

|
|
Final fit of the simulated energy distribution to the data for PbNe collisions. The best fit found is $(f,\mu)=(0.996, 3.157)$ with a corresponding $\chi^2/\mathrm{ndf} = 1.026$. The right figure corresponds to a close-up view of the left figure. |
ecal_f[..].pdf [26 KiB] HiDef png [212 KiB] Thumbnail [187 KiB] |

|
|
ecal_f[..].pdf [22 KiB] HiDef png [196 KiB] Thumbnail [176 KiB] |

|
|
|
(top left) Classification of events from PbPb data according to the defined centrality classes, distribution of the (top right) impact parameter, (bottom left) $ N_\mathrm{{coll}}$ and (bottom right) $ N_\mathrm{{part}}$ quantities for the corresponding centrality classes. |
ecal_c[..].pdf [94 KiB] HiDef png [1 MiB] Thumbnail [609 KiB] |

|
|
b_clas[..].pdf [45 KiB] HiDef png [1 MiB] Thumbnail [304 KiB] |

|
|
|
ncoll_[..].pdf [316 KiB] HiDef png [1 MiB] Thumbnail [330 KiB] |

|
|
|
npart_[..].pdf [95 KiB] HiDef png [2 MiB] Thumbnail [397 KiB] |

|
|
|
(top left) Classification of events from PbNe data according to the defined centrality classes, distribution of the (top right) impact parameter, (bottom left) $ N_\mathrm{{coll}}$ and (bottom right) $ N_\mathrm{{part}}$ values for the corresponding centrality classes. |
ecal_c[..].pdf [65 KiB] HiDef png [1 MiB] Thumbnail [623 KiB] |

|
|
b_clas[..].pdf [82 KiB] HiDef png [996 KiB] Thumbnail [421 KiB] |

|
|
|
ncoll_[..].pdf [115 KiB] HiDef png [2 MiB] Thumbnail [662 KiB] |

|
|
|
npart_[..].pdf [97 KiB] HiDef png [2 MiB] Thumbnail [704 KiB] |

|
|
|
Animated gif made out of all figures. |
DP-2021-002.gif Thumbnail |

|
![HiDef png [70 KiB]](Directory_LHCb-DP-2021-002/hidef_density.png)
![HiDef png [107 KiB]](Directory_LHCb-DP-2021-002/hidef_velo_tot_Niels_lbstyle_francesco.png)
![HiDef png [88 KiB]](Directory_LHCb-DP-2021-002/hidef_ecal_tot_Niels_Maarten_lbstyle_francesco_label.png)
![HiDef png [1 MiB]](Directory_LHCb-DP-2021-002/hidef_nvc-ecal_tot_populations_Niels_Maarten_lbstyle_Francesco_label.png)
![HiDef png [229 KiB]](Directory_LHCb-DP-2021-002/hidef_nvc-ecal_totcut_populations_Niels_Maarten_lbstyle_Francesco_label.png)
![HiDef png [86 KiB]](Directory_LHCb-DP-2021-002/hidef_nvc_singlecolor_Niels_Maarten_lbstyle_Francesco_label.png)
![HiDef png [75 KiB]](Directory_LHCb-DP-2021-002/hidef_ecal_singlecolor_Niels_Maarten_lbstyle_Francesco_label.png)
![HiDef png [88 KiB]](Directory_LHCb-DP-2021-002/hidef_Npart_Niels_lbstyle.png)
![HiDef png [98 KiB]](Directory_LHCb-DP-2021-002/hidef_Ncoll_Niels_lbstyle.png)
![HiDef png [92 KiB]](Directory_LHCb-DP-2021-002/hidef_Nanc_Niels_lbstyle.png)
![HiDef png [94 KiB]](Directory_LHCb-DP-2021-002/hidef_NBD_lbstyle_PK.png)
![HiDef png [87 KiB]](Directory_LHCb-DP-2021-002/hidef_Nout_Niels_lbstyle.png)
![HiDef png [90 KiB]](Directory_LHCb-DP-2021-002/hidef_simu_ecal_Niels_lbstyle.png)
![HiDef png [181 KiB]](Directory_LHCb-DP-2021-002/hidef_k_sweep_5values_Maarten_Niels_lbstyle.png)
![HiDef png [195 KiB]](Directory_LHCb-DP-2021-002/hidef_fit_f09_ecal_MB_scaled_Niels_lbstyle.png)
![HiDef png [192 KiB]](Directory_LHCb-DP-2021-002/hidef_fit_chi2_f-only_lbstyle_francesco.png)
![HiDef png [194 KiB]](Directory_LHCb-DP-2021-002/hidef_chi2_th2_bestfit_Niels_lbstyle_PK.png)
![HiDef png [183 KiB]](Directory_LHCb-DP-2021-002/hidef_projectionY_f_coarse_lbstyle_francesco.png)
![HiDef png [174 KiB]](Directory_LHCb-DP-2021-002/hidef_projectionX_mu_coarse_lbstyle_francesco.png)
![HiDef png [160 KiB]](Directory_LHCb-DP-2021-002/hidef_fit_min-chi2_f-parametrised_lbstyle_francesco.png)
![HiDef png [118 KiB]](Directory_LHCb-DP-2021-002/hidef_fit_min-chi2_mu-parametrised_lbstyle_francesco.png)
![HiDef png [361 KiB]](Directory_LHCb-DP-2021-002/hidef_chi2_th2_bestfit_fine_fitminima_Niels_lbstyle_PK.png)
![HiDef png [189 KiB]](Directory_LHCb-DP-2021-002/hidef_fit_ecal_MB_bestfit_fine_notfittominima_Niels2_lbstyle.png)
![HiDef png [191 KiB]](Directory_LHCb-DP-2021-002/hidef_fit_ecal_MB_bestfit_fine_notfittominima_zoom_Niels2_lbstyle.png)
![HiDef png [1 MiB]](Directory_LHCb-DP-2021-002/hidef_mu-f_plane_BFcoarse_Niels_lbstyle_PK.png)
![HiDef png [1 MiB]](Directory_LHCb-DP-2021-002/hidef_mu-f_plane_BFfine_Niels_lbstyle_PK.png)
![HiDef png [212 KiB]](Directory_LHCb-DP-2021-002/hidef_ecal_fit_Niels2_lbstyle.png)
![HiDef png [196 KiB]](Directory_LHCb-DP-2021-002/hidef_ecal_fit_zoom_Niels2_lbstyle.png)
![HiDef png [1 MiB]](Directory_LHCb-DP-2021-002/hidef_ecal_classes_Niels_lbstyle2.png)
![HiDef png [1 MiB]](Directory_LHCb-DP-2021-002/hidef_b_classes_Niels_lbstyle2.png)
![HiDef png [1 MiB]](Directory_LHCb-DP-2021-002/hidef_ncoll_classes_Niels_lbstyle2.png)
![HiDef png [2 MiB]](Directory_LHCb-DP-2021-002/hidef_npart_classes_Niels_lbstyle2.png)
![HiDef png [1 MiB]](Directory_LHCb-DP-2021-002/hidef_ecal_classes_pbne_Niels_lbstyle.png)
![HiDef png [996 KiB]](Directory_LHCb-DP-2021-002/hidef_b_classes_pbne_Niels_lbstyle.png)
![HiDef png [2 MiB]](Directory_LHCb-DP-2021-002/hidef_ncoll_classes_pbne_Niels_lbstyle.png)
![HiDef png [2 MiB]](Directory_LHCb-DP-2021-002/hidef_npart_classes_pbne_Niels_lbstyle.png)
Tables and captions
|
Parameters for the 2pF density function. |
Table_1.pdf [45 KiB] HiDef png [48 KiB] Thumbnail [20 KiB] tex code |

|
|
Geometric quantities ( $ N_\mathrm{{part}}$ , $ N_\mathrm{{coll}}$ and $b$) of PbPb collisions for centrality classes defined from a Glauber MC model fitted to the data. The classes correspond to sharp cuts in the energy deposited in the ECAL . Here $\sigma$ stands for the standard deviation of the corresponding distributions. |
Table_2.pdf [69 KiB] HiDef png [96 KiB] Thumbnail [46 KiB] tex code |

|
|
Geometric quantities ( $ N_\mathrm{{part}}$ , $ N_\mathrm{{coll}}$ and $b$) of PbNe collisions for centrality classes defined from a MC Glauber model fitted to the data. The classes correspond to sharp cuts in the energy deposited in the ECAL . Here $\sigma$ stands for the standard deviation of the corresponding distributions. |
Table_3.pdf [69 KiB] HiDef png [92 KiB] Thumbnail [44 KiB] tex code |

|
|
Total uncertainties for the geometric quantities ( $ N_\mathrm{{part}}$ , $ N_\mathrm{{coll}}$ and $b$) of PbPb collisions for centrality classes defined from a MC Glauber model fit to the data. The statistical and systematic uncertainties are added in quadrature. |
Table_4.pdf [53 KiB] HiDef png [118 KiB] Thumbnail [62 KiB] tex code |

|
|
Total uncertainties for the geometric quantities ( $ N_\mathrm{{part}}$ , $ N_\mathrm{{coll}}$ and $b$) of PbNe collisions for centrality classes defined from a MC Glauber model fit to the data. The statistical and systematic uncertainties are added in quadrature. |
Table_5.pdf [53 KiB] HiDef png [122 KiB] Thumbnail [61 KiB] tex code |

|
![HiDef png [48 KiB]](Directory_LHCb-DP-2021-002/hidef_Table_1.png)
![HiDef png [96 KiB]](Directory_LHCb-DP-2021-002/hidef_Table_2.png)
![HiDef png [92 KiB]](Directory_LHCb-DP-2021-002/hidef_Table_3.png)
![HiDef png [118 KiB]](Directory_LHCb-DP-2021-002/hidef_Table_4.png)
![HiDef png [122 KiB]](Directory_LHCb-DP-2021-002/hidef_Table_5.png)
Created on 11 May 2024.