Prompt $K_{S}^{0}$ production in $pp$ collisions at $\sqrt{s}$ = 0.9 TeV
[to restricted-access page]Information
LHCb-PAPER-2010-001
CERN-PH-EP-2010-027
arXiv:1008.3105 [PDF]
(Submitted on 18 Aug 2010)
Phys. Lett. B693 (2010) 69-80
Inspire 865584
Tools
Abstract
The production of K_short mesons in pp collisions at a centre-of-mass energy of 0.9 TeV is studied with the LHCb detector at the Large Hadron Collider. The luminosity of the analysed sample is determined using a novel technique, involving measurements of the beam currents, sizes and positions, and is found to be 6.8 +/- 1.0 microbarn^-1. The differential prompt K_short production cross-section is measured as a function of the K_short transverse momentum and rapidity in the region 0 < pT < 1.6 GeV/c and 2.5 < y < 4.0. The data are found to be in reasonable agreement with previous measurements and generator expectations.
Figures and captions
|
Distributions in the horizontal (top) and vertical (bottom) planes of the reconstructed vertices in $b1$ (blue filled circles and solid fit line) and $b2$ (red open circles and dashed fit line) crossings in one fill. |
fig1.eps [100 KiB] HiDef png [317 KiB] Thumbnail [209 KiB] |

|
|
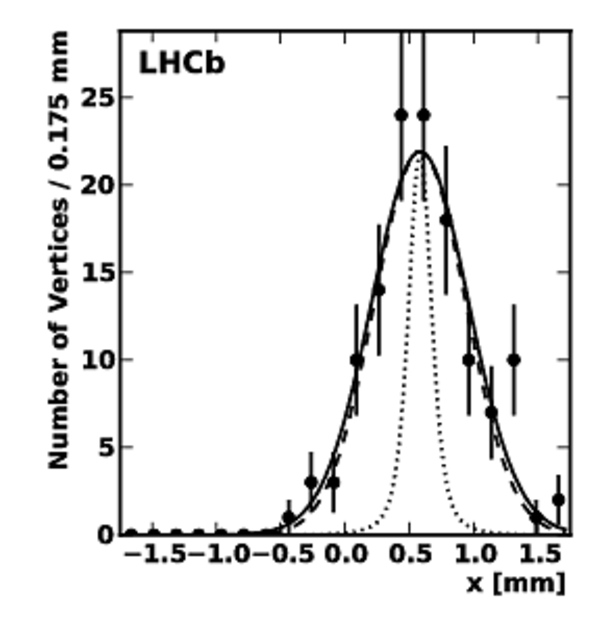
Measured profiles of beam-1, beam-2 and luminous region (from left to right) in the horizontal direction $x$, in $bb$ crossings of one pair of colliding bunches in one fill. The solid curve is a fit to the observed distributions, the dotted curve represents the vertex resolution, and the dashed curve shows the underlying distributions after deconvolution of the vertex resolution. |
fig2a.eps [26 KiB] HiDef png [36 KiB] Thumbnail [125 KiB] |

|
|
fig2b.eps [23 KiB] HiDef png [33 KiB] Thumbnail [119 KiB] |
|
|
|
fig2c.eps [33 KiB] HiDef png [32 KiB] Thumbnail [124 KiB] |

|
|
|
Mass distributions of all selected $ K^0_{\rm S}$ candidates, in the downstream-track (left) and long-track (right) selections. The points are the beam-gas subtracted data and the curves are the result of the fits described in the text. |
fig3a.eps [24 KiB] HiDef png [185 KiB] Thumbnail [177 KiB] |

|
|
fig3b.eps [22 KiB] HiDef png [171 KiB] Thumbnail [165 KiB] |

|
|
|
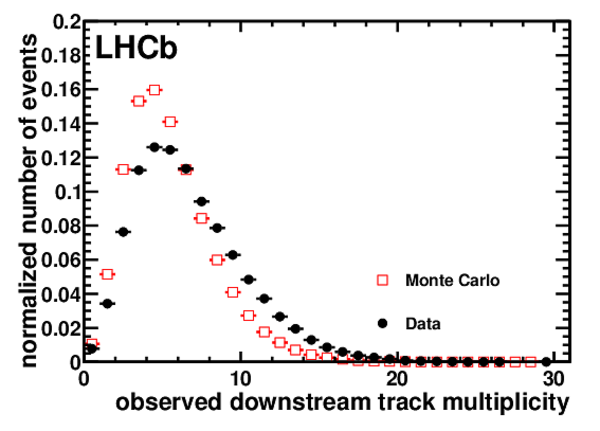
Left: Downstream track multiplicity for events containing a signal $ K^0_{\rm S}$ , in data (black filled circles) and MC (red open squares), normalized to unit area. Right: Trigger efficiency for events containing a signal $ K^0_{\rm S}$ decay in the downstream-track selection, as a function of the $ K^0_{\rm S}$ $p_{\rm T}$, estimated both in data (black filled circles) and MC (red open squares), using Eq. (9). |
fig4a.eps [10 KiB] HiDef png [174 KiB] Thumbnail [183 KiB] |
|
|
fig4b.eps [9 KiB] HiDef png [129 KiB] Thumbnail [143 KiB] |

|
|
|
Double-differential prompt $ K^0_{\rm S}$ production cross-section in $pp$ collisions at $\sqrt{s}=0.9$ TeV as a function of transverse momentum $p_{\rm T}$ and rapidity $y$. The points represent LHCb data, with total uncertainties shown as vertical error bars and statistical uncertainties as tick marks on the bars. The histograms are predictions from different settings of the PYTHIA generator (see text). The lower plots show the MC/data ratios, with the shaded band representing the uncertainty for one of these ratios, dominated by the uncertainty on the measurements (the relative uncertainties for the other ratios are similar). |
fig5.eps [592 KiB] HiDef png [513 KiB] Thumbnail [191 KiB] |

|
|
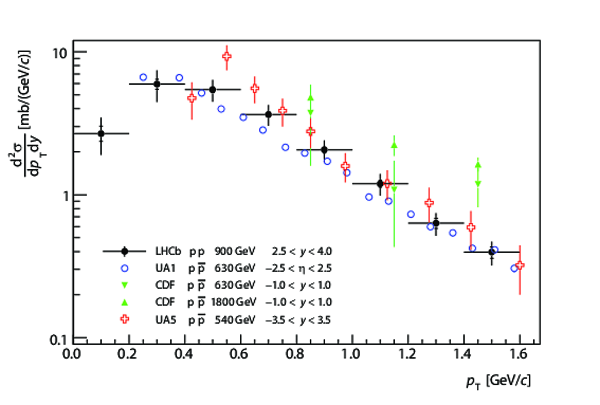
Absolute measurements of the prompt $ K^0_{\rm S}$ production cross-section as a function of transverse momentum $p_{\rm T}$, performed by the UA1 [5], UA5 [2], CDF [4] and LHCb experiments, at different high-energy hadron colliders and in different rapidity ($y$) or pseudo-rapidity ($\eta$) ranges. |
fig6.eps [406 KiB] HiDef png [302 KiB] Thumbnail [106 KiB] |
|
|
Animated gif made out of all figures. |
PAPER-2010-001.gif Thumbnail |

|
![HiDef png [317 KiB]](Directory_LHCb-PAPER-2010-001/hidef_fig1.png)
![HiDef png [36 KiB]](Directory_LHCb-PAPER-2010-001/hidef_fig2a.png)
![HiDef png [33 KiB]](Directory_LHCb-PAPER-2010-001/hidef_fig2b.png)
![HiDef png [32 KiB]](Directory_LHCb-PAPER-2010-001/hidef_fig2c.png)
![HiDef png [185 KiB]](Directory_LHCb-PAPER-2010-001/hidef_fig3a.png)
![HiDef png [171 KiB]](Directory_LHCb-PAPER-2010-001/hidef_fig3b.png)
![HiDef png [174 KiB]](Directory_LHCb-PAPER-2010-001/hidef_fig4a.png)
![HiDef png [129 KiB]](Directory_LHCb-PAPER-2010-001/hidef_fig4b.png)
![HiDef png [513 KiB]](Directory_LHCb-PAPER-2010-001/hidef_fig5.png)
![HiDef png [302 KiB]](Directory_LHCb-PAPER-2010-001/hidef_fig6.png)
Tables and captions
|
Parameters describing the vertex resolution functions defined in Eqs. (7) and (8). The quoted errors include statistical and systematic uncertainties. The parameters $f_j$ and $r_j$ were fixed in the fits, and hence have no uncertainties. |
Table_1.pdf [51 KiB] HiDef png [33 KiB] Thumbnail [17 KiB] tex code |

|
|
$ K^0_{\rm S}\to\pi^+\pi^-$ selection requirements. |
Table_2.pdf [44 KiB] HiDef png [119 KiB] Thumbnail [54 KiB] tex code |

|
|
Number of observed beam-gas subtracted $ K^0_{\rm S}\to\pi^+\pi^-$ signal decays, as extracted in the downstream- and long-track selections for each bin of transverse momentum $p_{\rm T}$ and rapidity $y$. The first quoted uncertainty is statistical and the second systematic. The latter is uncorrelated across bins. A dash indicates that the statistics were insufficient to determine a result in that bin. |
Table_3.pdf [39 KiB] HiDef png [156 KiB] Thumbnail [91 KiB] tex code |

|
|
Total efficiencies (in %) in bins of transverse momentum $p_{\rm T}$ and rapidity $y$ for the two selections. The first uncertainty is uncorrelated, including the statistical uncertainty from MC, and the second is at least partially correlated across bins. |
Table_4.pdf [39 KiB] HiDef png [166 KiB] Thumbnail [85 KiB] tex code |

|
|
Sources of uncertainty on the $ K^0_{\rm S}$ production cross-sections of Eq. (1), with relative values quoted for the downstream-track selection. A range of values means that the uncertainty was evaluated per bin of $(p_{\rm T}, y)$ phase space (with extreme values quoted), while a single value indicates a global uncertainty assumed to be bin-independent. The different contributions are classified as uncorrelated or (at least partially) correlated across the different bins. |
Table_5.pdf [71 KiB] HiDef png [134 KiB] Thumbnail [63 KiB] tex code |

|
|
Prompt $ K^0_{\rm S}$ production cross-section (in $\mu$b) measured in bins of transverse momentum $p_{\rm T}$ and rapidity $y$, as defined in Eq. (1). The first quoted error is the statistical uncertainty, the second error is the uncorrelated systematic uncertainty, and the third error is the systematic uncertainty correlated across bins. |
Table_6.pdf [35 KiB] HiDef png [78 KiB] Thumbnail [41 KiB] tex code |

|
![HiDef png [33 KiB]](Directory_LHCb-PAPER-2010-001/hidef_Table_1.png)
![HiDef png [119 KiB]](Directory_LHCb-PAPER-2010-001/hidef_Table_2.png)
![HiDef png [156 KiB]](Directory_LHCb-PAPER-2010-001/hidef_Table_3.png)
![HiDef png [166 KiB]](Directory_LHCb-PAPER-2010-001/hidef_Table_4.png)
![HiDef png [134 KiB]](Directory_LHCb-PAPER-2010-001/hidef_Table_5.png)
![HiDef png [78 KiB]](Directory_LHCb-PAPER-2010-001/hidef_Table_6.png)
Created on 27 April 2024.