Measurement of $\sigma (pp \to b\overline{b}X)$ at $\sqrt{s}$=7 TeV in the forward region
[to restricted-access page]Information
LHCb-PAPER-2010-002
CERN-PH-EP-2010-029
arXiv:1009.2731 [PDF]
(Submitted on 14 Sep 2010)
Phys. Lett. B694 (2010) 209-216
Inspire 867355
Tools
Abstract
Decays of b hadrons into final states containing a D0 meson and a muon are used to measure the b anti-b production cross-section in proton-proton collisions at a centre-of-mass energy of 7 TeV at the LHC. In the pseudorapidity interval 2 < eta < 6 and integrated over all transverse momenta we find that the average cross-section to produce b-flavoured or anti-b-flavoured hadrons is (75.3 +/- 5.4 +/- 13.0) microbarns.
Figures and captions
|
$K^-\pi^+$ invariant mass for "Prompt" selection criteria in 2.9 nb$^{-1}$. The curve shows a fit to a linear background (dashed) plus double-Gaussian signal function with parameters $\sigma_1$=7.1$\pm$0.6 MeV, $\sigma_2/\sigma_1$=1.7$\pm$0.1, and the fraction of the second Gaussian 0.40$\pm$0.16. |
d0mass[..].eps [133 KiB] HiDef png [331 KiB] Thumbnail [157 KiB] |

|
|
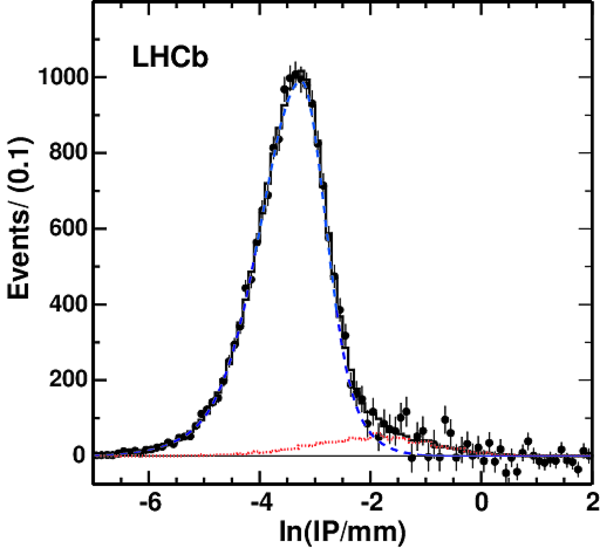
Natural logarithm of the IP for $D^0$ mesons, with the IP in units of mm (points with error bars) for the 2.9 nb$^{-1}$ microbias sample. Background has been subtracted using mass sidebands. The dashed curve shows the result of the fit to the Prompt component, the dotted line the Dfb component, and the histogram the sum of the two. |
d0lnip_ss.eps [351 KiB] HiDef png [280 KiB] Thumbnail [157 KiB] |
|
|
Natural logarithm of the $D^0$ IP in the 2.9 nb$^{-1}$ microbias sample for (a) right-sign and (b) wrong-sign $D^0$-muon candidate combinations. The dotted curves show the $D^0$ sideband backgrounds, the thin solid curves the Prompt yields, the dashed curve the Dfb signal, and the thick solid curves the totals. |
logip_[..].eps [136 KiB] HiDef png [318 KiB] Thumbnail [161 KiB] |

|
|
logip_[..].eps [146 KiB] HiDef png [244 KiB] Thumbnail [131 KiB] |

|
|
|
Natural logarithm of the $D^0$ IP in the 12.2 nb$^{-1}$ triggered sample for (a) right-sign and (b) wrong-sign $D^0$-muon candidate combinations. The dotted curves show the $D^0$ sideband backgrounds, the thin solid curves the Prompt yields, the dashed curve the Dfb signal, and the thick solid curves the totals. |
logip_11nb.eps [200 KiB] HiDef png [253 KiB] Thumbnail [127 KiB] |

|
|
$\sigma(pp\to H_b X)$ as a function of $\eta$ for the microbias ($\times$) and triggered ($\bullet$) samples, shown displaced from the bin center and the average (+). The data are shown as points with error bars, the MCFM prediction as a dashed line, and the FONLL prediction as a thick solid line. The thin upper and lower lines indicate the theoretical uncertainties on the FONLL prediction. The systematic uncertainties in the data are not included. |
cross-[..].eps [58 KiB] HiDef png [138 KiB] Thumbnail [111 KiB] |

|
|
Animated gif made out of all figures. |
PAPER-2010-002.gif Thumbnail |

|
![HiDef png [331 KiB]](Directory_LHCb-PAPER-2010-002/hidef_d0mass-530-ss.png)
![HiDef png [280 KiB]](Directory_LHCb-PAPER-2010-002/hidef_d0lnip_ss.png)
![HiDef png [318 KiB]](Directory_LHCb-PAPER-2010-002/hidef_logip_rs_new-ss.png)
![HiDef png [244 KiB]](Directory_LHCb-PAPER-2010-002/hidef_logip_ws_new-ss.png)
![HiDef png [253 KiB]](Directory_LHCb-PAPER-2010-002/hidef_logip_11nb.png)
![HiDef png [138 KiB]](Directory_LHCb-PAPER-2010-002/hidef_cross-section-all-C3-3-small.png)
Tables and captions
|
RS background subtracted event yields from data, and extracted cross-sections, compared with predictions from MCFM [7] and FONLL [8]. The systematic uncertainties in the normalisation of 17.3% are not included. The uncertainties on the FONLL prediction are $^{+45}_ {-38}$%, while those for MCFM are $^{+83}_ {-44}$%. |
Table_1.pdf [48 KiB] HiDef png [64 KiB] Thumbnail [31 KiB] tex code |

|
|
Systematic uncertainties. |
Table_2.pdf [59 KiB] HiDef png [88 KiB] Thumbnail [39 KiB] tex code |

|
![HiDef png [64 KiB]](Directory_LHCb-PAPER-2010-002/hidef_Table_1.png)
![HiDef png [88 KiB]](Directory_LHCb-PAPER-2010-002/hidef_Table_2.png)
Created on 27 April 2024.