Information
LHCb-PAPER-2011-002
CERN-PH-EP-2011-011
arXiv:1102.0206 [PDF]
(Submitted on 01 Feb 2011)
Phys. Lett. B698 (2011) 115
Inspire 886284
Tools
Abstract
Using data collected with the LHCb detector in proton-proton collisions at a centre-of-mass energy of 7 TeV, the hadronic decay Bs -> J/psi f0(980) is observed. This CP eigenstate mode could be used to measure mixing-induced CP violation in the B_s system. Using a fit to the pi+ pi- mass spectrum with interfering resonances gives R_{f0/phi} = [Gamma(Bs -> J/psi f0, f0 -> pi+ pi-)]/[Gamma(Bs -> J/psi phi, phi -> K+K-)] = 0.252^{+0.046+0.027}_{-0.032-0.033}, where the uncertainties are statistical and systematic, respectively.
Figures and captions
|
Decay diagram for $B_s^0\to J/\psi (f_0{\rm or }\phi)$ decays. |
psi_f0-phi.eps [116 KiB] HiDef png [114 KiB] Thumbnail [117 KiB] |

|
|
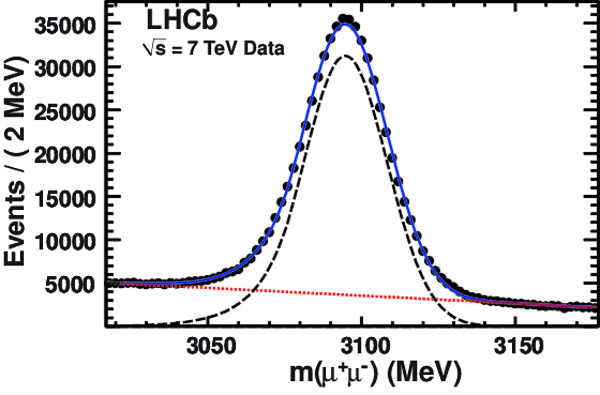
The $\mu^+\mu^-$ invariant mass for candidates satisfying the trigger and analysis requirements and having $t_z>0.5$ ps. The data points are shown as circles; the error bars are smaller than the circle radii. The dashed line shows the Crystal Ball signal function \cite{CB}, the dotted line the background and the solid line the sum. |
mjpsi_[..].eps [60 KiB] HiDef png [516 KiB] Thumbnail [201 KiB] |
|
|
The invariant mass of $J/\psi K^+K^-$ combinations when the $K^+K^-$ pair is required to be with $\pm$20 MeV of the $\phi$ mass. The data have been fit with a Gaussian signal function whose mass and width are allowed to float and linear background function shown as a dashed line. The solid curve shows the sum. |
fit_phi2.eps [46 KiB] HiDef png [412 KiB] Thumbnail [170 KiB] |

|
|
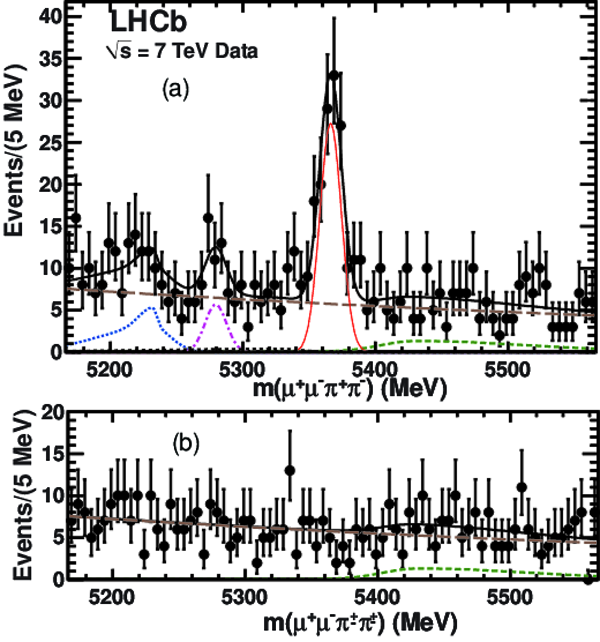
(a) The invariant mass of $J/\psi\pi^+\pi^-$ combinations when the $\pi^+\pi^-$ pair is required to be with $\pm$90 MeV of the $f_0(980)$ mass. The data have been fit with a signal Gaussian and several background functions. The thin (red) solid curve shows the signal, the long-dashed (brown) curve the combinatorial background, the dashed (green) curve the $B^+\to J/\psi K^+(\pi^+) $ background, the dotted (blue) curve the ${B}^0\to J/\psi K^{*0}$ background, the dash-dot curve (purple) the ${B}^0\to J/\psi \pi^+\pi^-$ background, the barely visible dotted curve (black) the sum of $B_s^0\to J/\psi \eta'$ and $J/\psi\phi$ backgrounds, and the thick-solid (black) curve the total. (b) The same as above but for like-sign di-pion combinations. |
fit_bs[..].eps [111 KiB] HiDef png [952 KiB] Thumbnail [449 KiB] |
|
|
Angular distributions of events within $\pm$30 MeV of the ${B}_s^0$ mass and $\pm$90 MeV of the $f_0$ mass after like-sign background subtraction. (a) The cosine of the angle of the $\mu^+$ with respect to the ${B}_s^0$ direction in the $J/\psi$ rest frame for ${B}_s^0\to J/\psi \pi^+\pi^-$ decays. The data are fit with a function $f(\cos\theta_{J/\psi})=1-\alpha\cos^2\theta_{J/\psi}$. (b) The cosine of the angle of the $\pi^+$ with respect to the ${B}_s^0$ direction in the di-pion rest frame for ${B}_s^0\to J/\psi\pi^+\pi^-$ decays. The data are fit with a flat line. |
hel_su[..].eps [46 KiB] HiDef png [213 KiB] Thumbnail [138 KiB] |

|
|
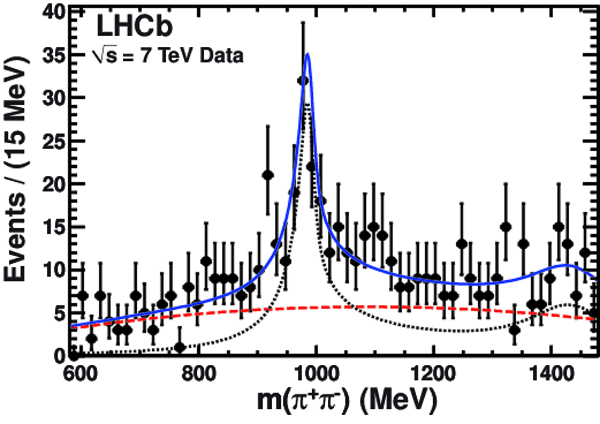
The invariant mass of $\pi^+\pi^-$ combinations when the $J/\psi\pi^+\pi^-$ is required to be within $\pm$30 MeV of the ${B}_s^0$ mass. The dashed curve is the like-sign background that is taken from the data both in shape and absolute normalization. The dotted curve is the result of the fit using Eq. 2 and the solid curve the total. |
fitnew[..].eps [63 KiB] HiDef png [542 KiB] Thumbnail [244 KiB] |
|
|
Animated gif made out of all figures. |
PAPER-2011-002.gif Thumbnail |

|
![HiDef png [114 KiB]](Directory_LHCb-PAPER-2011-002/hidef_psi_f0-phi.png)
![HiDef png [516 KiB]](Directory_LHCb-PAPER-2011-002/hidef_mjpsi_data-147.png)
![HiDef png [412 KiB]](Directory_LHCb-PAPER-2011-002/hidef_fit_phi2.png)
![HiDef png [952 KiB]](Directory_LHCb-PAPER-2011-002/hidef_fit_bsmass-paper.png)
![HiDef png [213 KiB]](Directory_LHCb-PAPER-2011-002/hidef_hel_sub-paper-norm.png)
![HiDef png [542 KiB]](Directory_LHCb-PAPER-2011-002/hidef_fitnew_res-paper.png)
Tables and captions
|
Relative systematic uncertainties on $R_{f_0/\phi}$ (%). Both negative and positive changes resulting from the parameter variations are indicated in separate columns. |
Table_1.pdf [49 KiB] HiDef png [81 KiB] Thumbnail [36 KiB] tex code |

|
![HiDef png [81 KiB]](Directory_LHCb-PAPER-2011-002/hidef_Table_1.png)
Created on 27 April 2024.