Measurement of $V^0$ production ratios in $pp$ collisions at $\sqrt{s}$ = 0.9 and 7 TeV
[to restricted-access page]Information
LHCb-PAPER-2011-005
CERN-PH-EP-2011-082
arXiv:1107.0882 [PDF]
(Submitted on 05 Jul 2011)
JHEP 08 (2011) 34
Inspire 917009
Tools
Abstract
The $\bar{\Lambda} / \Lambda$ and $\bar{\Lambda} / K^0_\mathrm{S}$ production ratios are measured by the LHCb detector from $0.3 \mathrm{nb}^{-1}$ of $pp$ collisions delivered by the LHC at $\sqrt{s} = 0.9$ TeV and $1.8 \mathrm{nb}^{-1}$ at $\sqrt{s} = 7$ TeV. Both ratios are presented as a function of transverse momentum, $p_\mathrm{T}$, and rapidity, $y$, in the ranges {$0.15 < p_\mathrm{T} < 2.50 \mathrm{GeV}/c$} and {$2.0<y<4.5$}. Results at the two energies are in good agreement as a function of rapidity loss, $\Delta y = y_\mathrm{beam} - y$, and are consistent with previous measurements. The ratio $\bar{\Lambda} / \Lambda$, measuring the transport of baryon number from the collision into the detector, is smaller in data than predicted in simulation, particularly at high rapidity. The ratio $\bar{\Lambda} / K^0_\mathrm{S}$, measuring the baryon-to-meson suppression in strange quark hadronisation, is significantly larger than expected.
Figures and captions
|
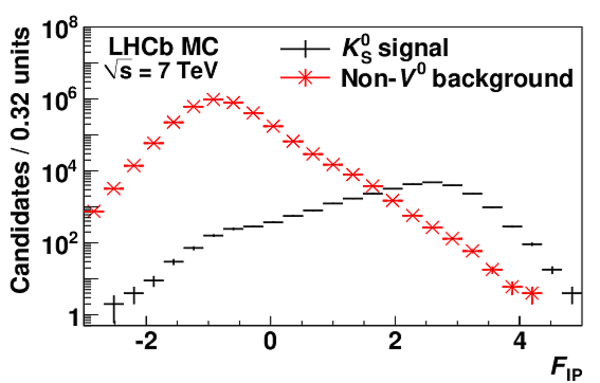
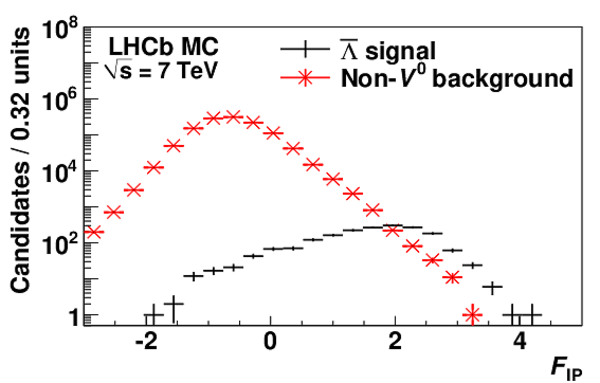
The Fisher discriminant $\mathcal{F}_{\mathrm{IP}}$ in 0.5 million Monte Carlo simulated minimum bias events at $\sqrt{s} = 7\mathrm{ Te V} $ for \subref{fig:fisher-k} $ K ^0_{\rm\scriptscriptstyle S}$ and \subref{fig:fisher-a} $\overline{\Lambda }{}$ . |
Fig1a.eps [13 KiB] HiDef png [151 KiB] Thumbnail [142 KiB] *.C file |
|
|
Fig1b.eps [12 KiB] HiDef png [144 KiB] Thumbnail [137 KiB] *.C file |
|
|
|
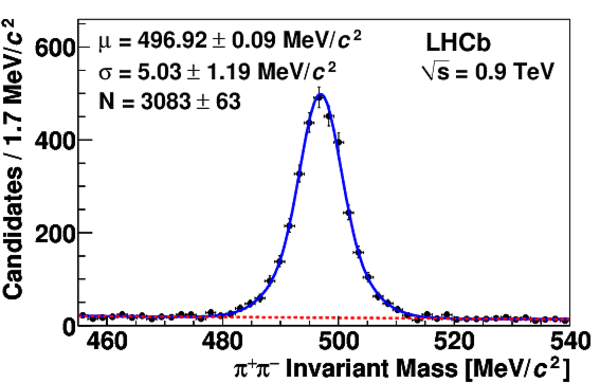
Invariant mass peaks for \subref{fig:mass-fit-a} $\overline{\Lambda }{}$ in the range $0.25< p_\mathrm{T} <2.50 {\mathrm{ Ge V /}c} $ & $2.5< y <3.0$ and \subref{fig:mass-fit-k} $ K ^0_{\rm\scriptscriptstyle S}$ in the range $0.65< p_\mathrm{T} <1.00 {\mathrm{ Ge V /}c} $ & $3.5< y <4.0$ at $\sqrt{s} = 0.9\mathrm{ Te V} $ with field up . Signal yields, $N$, are found from fits (solid curves) with a double Gaussian peak with common mean, $\mu$, over a linear background (dashed lines). The width, $\sigma$, is computed as the quadratic average of the two Gaussian widths weighted by their signal fractions. |
Fig2a.eps [18 KiB] HiDef png [201 KiB] Thumbnail [172 KiB] *.C file |

|
|
Fig2b.eps [18 KiB] HiDef png [209 KiB] Thumbnail [183 KiB] *.C file |
|
|
|
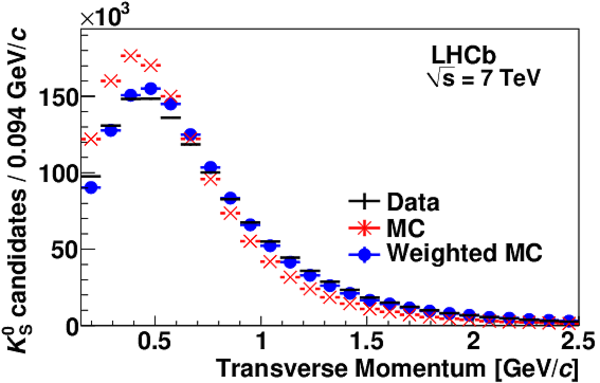
\subref{fig:weighting-pt} Transverse momentum and \subref{fig:weighting-y} rapidity distributions for $ K ^0_{\rm\scriptscriptstyle S}$ in data and Monte Carlo simulation at $\sqrt{s} = 7\mathrm{ Te V} $ . The difference between data and Monte Carlo is reduced by weighting the simulated candidates. |
Fig3a.eps [12 KiB] HiDef png [199 KiB] Thumbnail [175 KiB] *.C file |
|
|
Fig3b.eps [11 KiB] HiDef png [176 KiB] Thumbnail [146 KiB] *.C file |

|
|
|
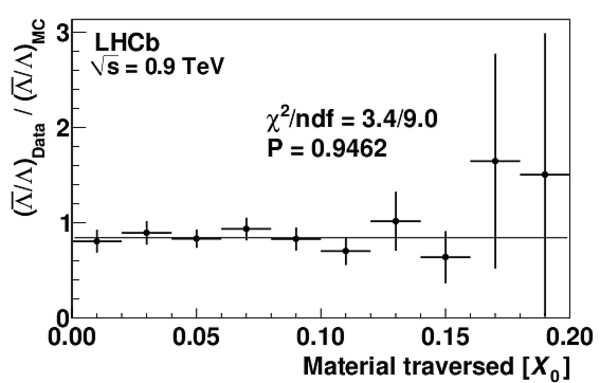
The double ratios \subref{fig:material-int-al} $(\overline{\Lambda }{} /\Lambda )_\mathrm{Data}/(\overline{\Lambda }{} /\Lambda )_\mathrm{MC}$ and \subref{fig:material-int-ak} $(\overline{\Lambda }{} / K ^0_{\rm\scriptscriptstyle S} )_\mathrm{Data}/(\overline{\Lambda }{} / K ^0_{\rm\scriptscriptstyle S} )_\mathrm{MC}$ are shown as a function of the material traversed, in units of radiation length. Flat line fits, shown together with their respective $\chi^2$ probabilities, give no evidence of a bias. |
Fig4a.eps [8 KiB] HiDef png [92 KiB] Thumbnail [52 KiB] *.C file |
|
|
Fig4b.eps [8 KiB] HiDef png [96 KiB] Thumbnail [55 KiB] *.C file |

|
|
|
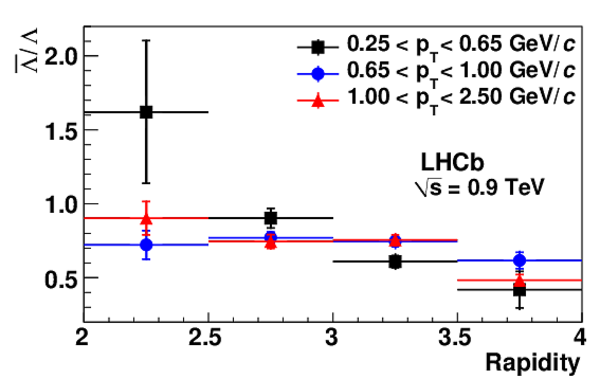
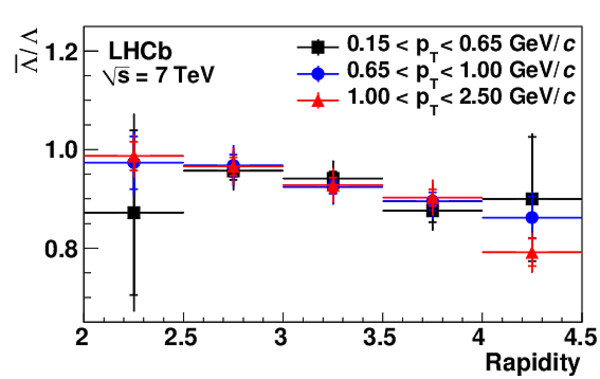
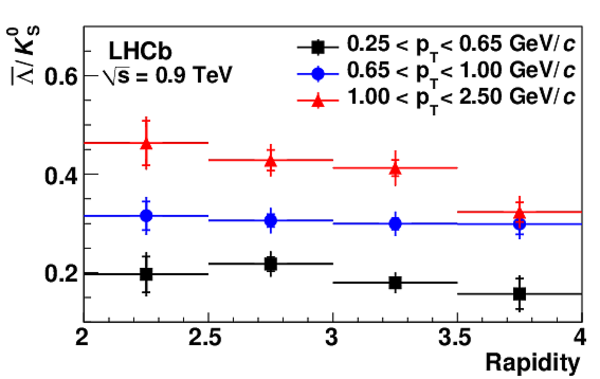
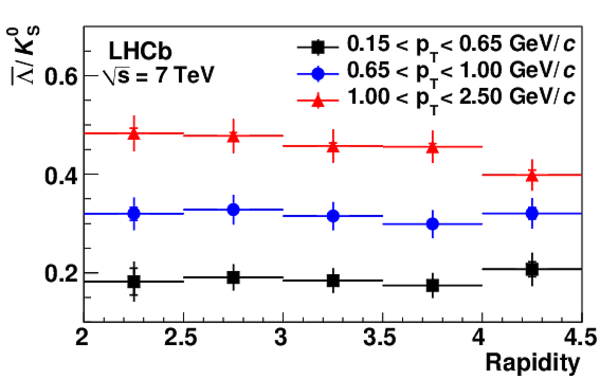
The ratios $\overline{\Lambda }{}$ / $\Lambda$ and $\overline{\Lambda }{}$ / $ K ^0_{\rm\scriptscriptstyle S}$ from the full analysis procedure at \subref{fig:plotData-900-al-3y} & \subref{fig:plotData-900-ak-3y} $\sqrt{s} = 0.9\mathrm{ Te V} $ and \subref{fig:plotData-7-al-3y} & \subref{fig:plotData-7-ak-3y} 7 $\mathrm{ Te V}$ are shown as a function of rapidity, compared across intervals of transverse momentum. Vertical lines show the combined statistical and systematic uncertainties and the short horizontal bars (where visible) show the statistical component. |
Fig5a.eps [11 KiB] HiDef png [125 KiB] Thumbnail [128 KiB] *.C file |
|
|
Fig5b.eps [12 KiB] HiDef png [131 KiB] Thumbnail [129 KiB] *.C file |
|
|
|
Fig5c.eps [11 KiB] HiDef png [127 KiB] Thumbnail [131 KiB] *.C file |
|
|
|
Fig5d.eps [12 KiB] HiDef png [128 KiB] Thumbnail [132 KiB] *.C file |
|
|
|
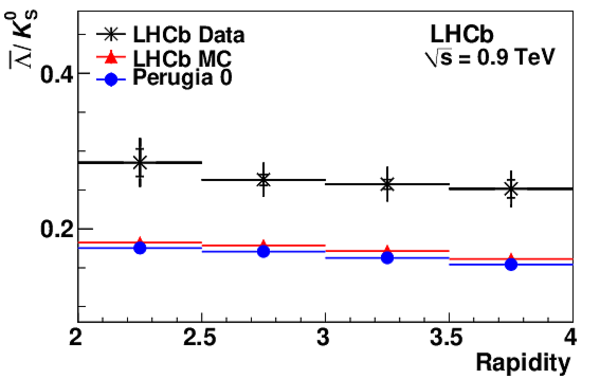
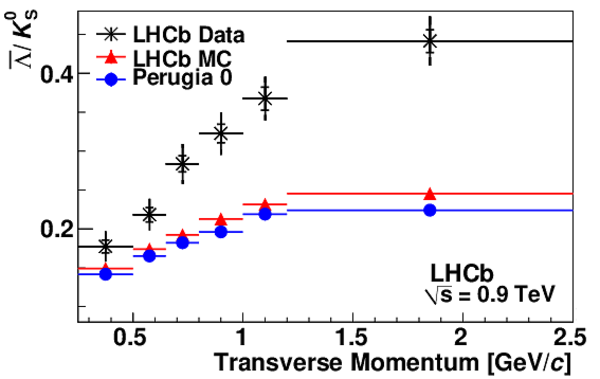
The ratios $\overline{\Lambda }{}$ / $\Lambda$ and $\overline{\Lambda }{}$ / $ K ^0_{\rm\scriptscriptstyle S}$ at $\sqrt{s} = 0.9\mathrm{ Te V} $ are compared with the predictions of the LHCb MC, Perugia 0 and Perugia NOCR as a function of \subref{fig:plotDataTheory-900-al-y} & \subref{fig:plotDataTheory-900-ak-y} rapidity and \subref{fig:plotDataTheory-900-al-pt} & \subref{fig:plotDataTheory-900-ak-pt} transverse momentum. Vertical lines show the combined statistical and systematic uncertainties and the short horizontal bars (where visible) show the statistical component. |
Fig6a.eps [9 KiB] HiDef png [109 KiB] Thumbnail [109 KiB] *.C file |

|
|
Fig6b.eps [12 KiB] HiDef png [135 KiB] Thumbnail [138 KiB] *.C file |

|
|
|
Fig6c.eps [9 KiB] HiDef png [96 KiB] Thumbnail [96 KiB] *.C file |
|
|
|
Fig6d.eps [11 KiB] HiDef png [121 KiB] Thumbnail [123 KiB] *.C file |
|
|
|
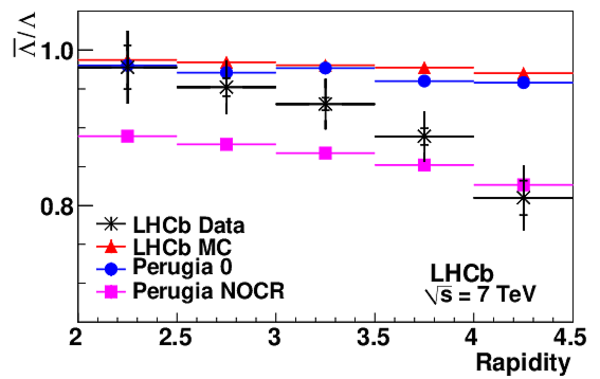
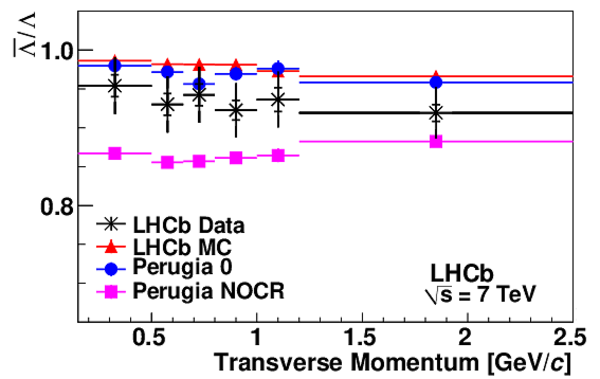
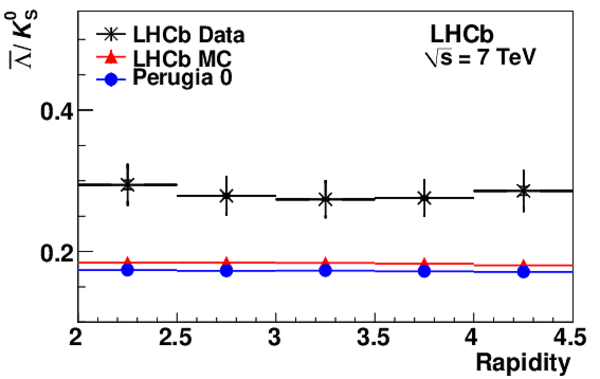
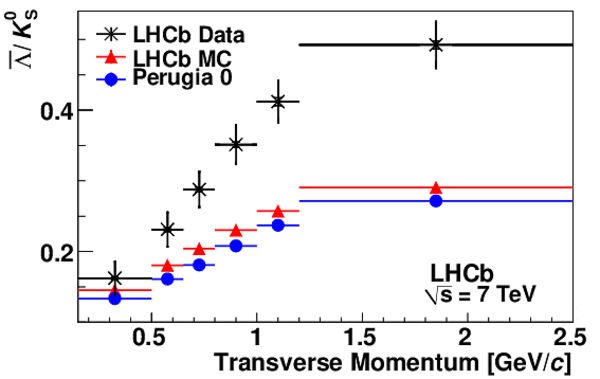
The ratios $\overline{\Lambda }{}$ / $\Lambda$ and $\overline{\Lambda }{}$ / $ K ^0_{\rm\scriptscriptstyle S}$ at $\sqrt{s} = 7\mathrm{ Te V} $ compared with the predictions of the LHCb MC, Perugia 0 and Perugia NOCR as a function of \subref{fig:plotDataTheory-7-al-y} & \subref{fig:plotDataTheory-7-ak-y} rapidity and \subref{fig:plotDataTheory-7-al-pt} & \subref{fig:plotDataTheory-7-ak-pt} transverse momentum. Vertical lines show the combined statistical and systematic uncertainties and the short horizontal bars (where visible) show the statistical component. |
Fig7a.eps [11 KiB] HiDef png [114 KiB] Thumbnail [116 KiB] *.C file |
|
|
Fig7b.eps [11 KiB] HiDef png [131 KiB] Thumbnail [134 KiB] *.C file |
|
|
|
Fig7c.eps [10 KiB] HiDef png [100 KiB] Thumbnail [101 KiB] *.C file |
|
|
|
Fig7d.eps [11 KiB] HiDef png [118 KiB] Thumbnail [119 KiB] *.C file |
|
|
|
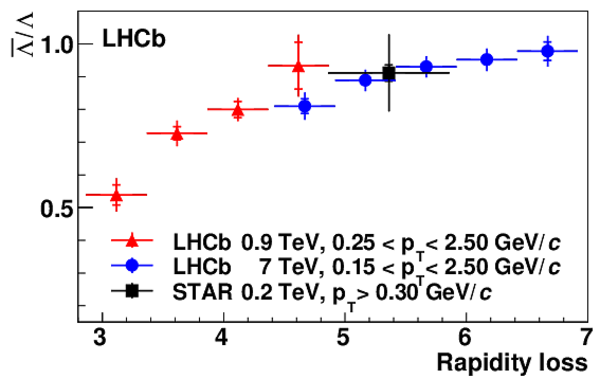
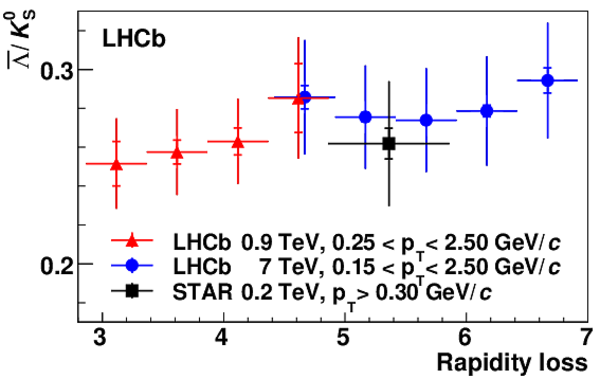
The ratios \subref{fig:plotDeltaY-al} $\overline{\Lambda }{}$ / $\Lambda$ and \subref{fig:plotDeltaY-ak} $\overline{\Lambda }{}$ / $ K ^0_{\rm\scriptscriptstyle S}$ from LHCb are compared at both $\sqrt{s} = 0.9\mathrm{ Te V} $ (triangles) and 7 TeV (circles) with the published results from STAR [1] (squares) as a function of rapidity loss, $\Delta y = y_\mathrm{beam} - y$. Vertical lines show the combined statistical and systematic uncertainties and the short horizontal bars (where visible) show the statistical component. |
Fig8a.eps [10 KiB] HiDef png [132 KiB] Thumbnail [135 KiB] *.C file |
|
|
Fig8b.eps [11 KiB] HiDef png [140 KiB] Thumbnail [140 KiB] *.C file |
|
|
|
Animated gif made out of all figures. |
PAPER-2011-005.gif Thumbnail |

|
![HiDef png [151 KiB]](Directory_LHCb-PAPER-2011-005/hidef_Fig1a.png)
![HiDef png [144 KiB]](Directory_LHCb-PAPER-2011-005/hidef_Fig1b.png)
![HiDef png [201 KiB]](Directory_LHCb-PAPER-2011-005/hidef_Fig2a.png)
![HiDef png [209 KiB]](Directory_LHCb-PAPER-2011-005/hidef_Fig2b.png)
![HiDef png [199 KiB]](Directory_LHCb-PAPER-2011-005/hidef_Fig3a.png)
![HiDef png [176 KiB]](Directory_LHCb-PAPER-2011-005/hidef_Fig3b.png)
![HiDef png [92 KiB]](Directory_LHCb-PAPER-2011-005/hidef_Fig4a.png)
![HiDef png [96 KiB]](Directory_LHCb-PAPER-2011-005/hidef_Fig4b.png)
![HiDef png [125 KiB]](Directory_LHCb-PAPER-2011-005/hidef_Fig5a.png)
![HiDef png [131 KiB]](Directory_LHCb-PAPER-2011-005/hidef_Fig5b.png)
![HiDef png [127 KiB]](Directory_LHCb-PAPER-2011-005/hidef_Fig5c.png)
![HiDef png [128 KiB]](Directory_LHCb-PAPER-2011-005/hidef_Fig5d.png)
![HiDef png [109 KiB]](Directory_LHCb-PAPER-2011-005/hidef_Fig6a.png)
![HiDef png [135 KiB]](Directory_LHCb-PAPER-2011-005/hidef_Fig6b.png)
![HiDef png [96 KiB]](Directory_LHCb-PAPER-2011-005/hidef_Fig6c.png)
![HiDef png [121 KiB]](Directory_LHCb-PAPER-2011-005/hidef_Fig6d.png)
![HiDef png [114 KiB]](Directory_LHCb-PAPER-2011-005/hidef_Fig7a.png)
![HiDef png [131 KiB]](Directory_LHCb-PAPER-2011-005/hidef_Fig7b.png)
![HiDef png [100 KiB]](Directory_LHCb-PAPER-2011-005/hidef_Fig7c.png)
![HiDef png [118 KiB]](Directory_LHCb-PAPER-2011-005/hidef_Fig7d.png)
![HiDef png [132 KiB]](Directory_LHCb-PAPER-2011-005/hidef_Fig8a.png)
![HiDef png [140 KiB]](Directory_LHCb-PAPER-2011-005/hidef_Fig8b.png)
Tables and captions
|
Integrated signal yields extracted by fits to the invariant mass distributions of selected $ V ^0$ candidates from data taken with magnetic field up and down at $\sqrt{s} = 0.9$ and 7 $\mathrm{ Te V}$ . |
Table_1.pdf [44 KiB] HiDef png [39 KiB] Thumbnail [18 KiB] tex code |

|
|
Absolute systematic errors are listed in descending order of importance. Ranges indicate uncertainties that vary across the measurement bins and/or by collision energy. Correlated sources of uncertainty between field up and down are identified. |
Table_2.pdf [56 KiB] HiDef png [93 KiB] Thumbnail [41 KiB] tex code |

|
|
The production ratios $\overline{\Lambda }{}$ / $\Lambda$ and $\overline{\Lambda }{}$ / $ K ^0_{\rm\scriptscriptstyle S}$ , measured at $\sqrt{s} = 0.9\mathrm{ Te V} $ , are quoted in percent with statistical and systematic errors as a function of \subref{tab:val-stat-syst-900-al} & \subref{tab:val-stat-syst-900-ak} rapidity, $ y$ , and \subref{tab:val-stat-syst-900-pt} transverse momentum, $ p_\mathrm{T}$ $[ {\mathrm{ Ge V /}c} ]$. |
[Error creating the table] | |
|
The production ratios $\overline{\Lambda }{}$ / $\Lambda$ and $\overline{\Lambda }{}$ / $ K ^0_{\rm\scriptscriptstyle S}$ , measured at $\sqrt{s} = 7\mathrm{ Te V} $ , are quoted in percent with statistical and systematic errors as a function of \subref{tab:val-stat-syst-7-al} & \subref{tab:val-stat-syst-7-ak} rapidity, $ y$ , and \subref{tab:val-stat-syst-7-pt} transverse momentum, $ p_\mathrm{T}$ $[ {\mathrm{ Ge V /}c} ]$. |
[Error creating the table] | |
|
The production ratios $\overline{\Lambda }{}$ / $\Lambda$ and $\overline{\Lambda }{}$ / $ K ^0_{\rm\scriptscriptstyle S}$ without non-prompt corrections at $\sqrt{s} = 0.9\mathrm{ Te V} $ are quoted in percent with statistical and systematic errors as a function of \subref{tab:no-correction-900-al} & \subref{tab:no-correction-900-ak} rapidity, $ y$ , and \subref{tab:no-correction-900-pt} transverse momentum, $ p_\mathrm{T}$ $[ {\mathrm{ Ge V /}c} ]$. |
[Error creating the table] | |
|
The production ratios $\overline{\Lambda }{}$ / $\Lambda$ and $\overline{\Lambda }{}$ / $ K ^0_{\rm\scriptscriptstyle S}$ without non-prompt corrections at $\sqrt{s} = 7\mathrm{ Te V} $ are quoted in percent with statistical and systematic errors as a function of \subref{tab:no-correction-7-al} & \subref{tab:no-correction-7-ak} rapidity, $ y$ , and \subref{tab:no-correction-7-pt} transverse momentum, $ p_\mathrm{T}$ $[ {\mathrm{ Ge V /}c} ]$. |
[Error creating the table] |
![HiDef png [39 KiB]](Directory_LHCb-PAPER-2011-005/hidef_Table_1.png)
![HiDef png [93 KiB]](Directory_LHCb-PAPER-2011-005/hidef_Table_2.png)
Created on 27 April 2024.