First observation of the decay $\bar{B}^0_s \to D^0 K^{*0}$ and a measurement of the ratio of branching fractions $\frac{{\cal B}(\bar{B}^0_s \to D^0 K^{*0})}{{\cal B}(\bar{B}^0 \to D^0 \rho^0)}$
[to restricted-access page]Information
LHCb-PAPER-2011-008
CERN-PH-EP-2011-150
arXiv:1110.3676 [PDF]
(Submitted on 17 Oct 2011)
Phys. Lett. B706 (2011) 32-39
Inspire 940142
Tools
Abstract
The first observation of the decay $\bar{B}^0_s \to D^0 K^{*0}$ using $pp$ data collected by the LHCb detector at a centre-of-mass energy of 7 TeV, corresponding to an integrated luminosity of 36 pb$^{-1}$, is reported. A signal of $34.4 \pm 6.8$ events is obtained and the absence of signal is rejected with a statistical significance of more than nine standard deviations. The $\bar{B}^0_s \to D^0 K^{*0}$ branching fraction is measured relative to that of $\bar{B}^0 \to D^0 \rho^0$: $\frac{{\cal B}(\bar{B}^0_s \to D^0 K^{*0})}{{\cal B}(\bar{B}^0 \to D^0 \rho^0)} = 1.48 \pm 0.34 \pm 0.15 \pm 0.12$, where the first uncertainty is statistical, the second systematic and the third is due to the uncertainty on the ratio of the $B^0$ and $B^0_s$ hadronisation fractions.
Figures and captions
|
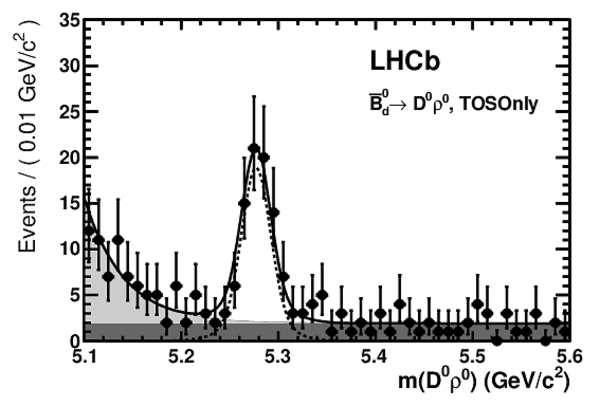
The invariant mass distribution for the $\overline{ B }{} ^0 \rightarrow D ^0 \rho ^0 $ decay mode for the $\texttt{TOSOnly}$ (left) and $\texttt{TIS}$ (right) trigger categories with the result of the fit superimposed. The black points correspond to the data and the fit result is represented as a solid line. The signal is fitted with a double Gaussian (dashed line), the partially reconstructed background with an exponential function (light grey area) and the combinatorial background with a flat distribution (dark grey area) as explained in the text. The contributions from cross-feed are too small to be visible. |
fig1a.eps [21 KiB] HiDef png [142 KiB] Thumbnail [84 KiB] *.C file |
|
|
fig1b.eps [21 KiB] HiDef png [147 KiB] Thumbnail [91 KiB] *.C file |

|
|
|
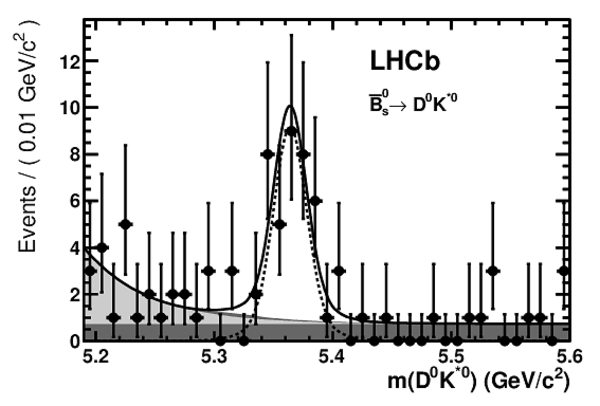
The invariant mass distribution for the $\overline{ B }{} ^0_s \rightarrow D ^0 K ^{*0} $ decay mode with the result of the fit superimposed. The black points correspond to the data and the fit result is represented as a solid line. The signal is fitted with a double Gaussian (dashed line), the partially reconstructed background with an exponential function (light grey area), the combinatorial background with a flat distribution (dark grey area) and the cross-feed from $\overline{ B }{} ^0 \rightarrow D ^0 \rho ^0 $ (intermediate grey area) as explained in the text. |
fig2.eps [18 KiB] HiDef png [136 KiB] Thumbnail [79 KiB] *.C file |
|
|
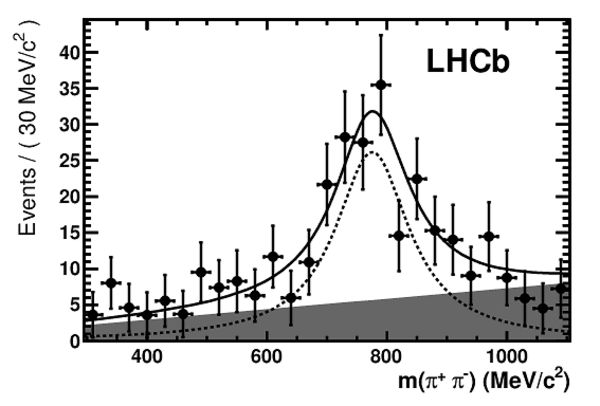
The $\rho ^0$ (on the left) and $ K ^{*0}$ (on the right) invariant mass distributions obtained from data using an sPlot technique. The level of non $ K ^{*0}$ combinations in the $\overline{ B }{} ^0_s \rightarrow D ^0 K ^{*0} $ peak is negligible. Despite being mainly due to $ D ^0 \rho ^0 $ combinations, the $\overline{ B }{} ^0 \rightarrow D ^0 \rho ^0 $ contains a significant contribution of "non- $\rho ^0$ " events. The black points correspond to the data and the fit result is represented as a solid line. The resonant component is fitted with a Breit-Wigner convoluted with a Gaussian (dashed line) and the non-resonant part, if present, with a second-order polynomial (grey area). |
fig3a.eps [16 KiB] HiDef png [142 KiB] Thumbnail [86 KiB] *.C file |
|
|
fig3b.eps [14 KiB] HiDef png [101 KiB] Thumbnail [60 KiB] *.C file |

|
|
|
Animated gif made out of all figures. |
PAPER-2011-008.gif Thumbnail |

|
![HiDef png [142 KiB]](Directory_LHCb-PAPER-2011-008/hidef_fig1a.png)
![HiDef png [147 KiB]](Directory_LHCb-PAPER-2011-008/hidef_fig1b.png)
![HiDef png [136 KiB]](Directory_LHCb-PAPER-2011-008/hidef_fig2.png)
![HiDef png [142 KiB]](Directory_LHCb-PAPER-2011-008/hidef_fig3a.png)
![HiDef png [101 KiB]](Directory_LHCb-PAPER-2011-008/hidef_fig3b.png)
Tables and captions
|
Summary of the fitted yields for the different categories. The background yields are quoted for the full mass regions. |
Table_1.pdf [62 KiB] HiDef png [38 KiB] Thumbnail [17 KiB] tex code |

|
|
Summary of the contributions to the systematic uncertainties. The uncertainty on the $r$ ratio gives the range used for the systematic uncertainty extraction on the ratios of the branching fractions. |
Table_2.pdf [54 KiB] HiDef png [66 KiB] Thumbnail [28 KiB] tex code |

|
![HiDef png [38 KiB]](Directory_LHCb-PAPER-2011-008/hidef_Table_1.png)
![HiDef png [66 KiB]](Directory_LHCb-PAPER-2011-008/hidef_Table_2.png)
Created on 02 May 2024.