Measurement of the $B^0_s-\overline{B}^0_s$ oscillation frequency $\Delta m_s$ in $B^0_s \to D^-_s (3)\pi$ decays
[to restricted-access page]Information
LHCb-PAPER-2011-010
CERN-PH-EP-2011-194
arXiv:1112.4311 [PDF]
(Submitted on 19 Dec 2011)
Phys. Lett. B709 (2012) 177
Inspire 1082063
Tools
Abstract
The B^0_s-\bar{B}^0_s oscillation frequency Delta m_s is measured with 36 pb^{-1} of data collected in pp collisions at \sqrt{s} = 7 TeV by the LHCb experiment at the Large Hadron Collider. A total of 1381 B^0_s -> D_s^- \pi^+ and \B^0_s -> D_s^- pi^+ pi^- pi^+ signal decays are reconstructed, with average decay time resolutions of 44 fs and 36 fs, respectively. An oscillation signal with a statistical significance of 4.6 sigma is observed. The measured oscillation frequency is Delta m_s = 17.63 \pm 0.11 (stat) \pm 0.02 (syst) ps^{-1}.
Figures and captions
|
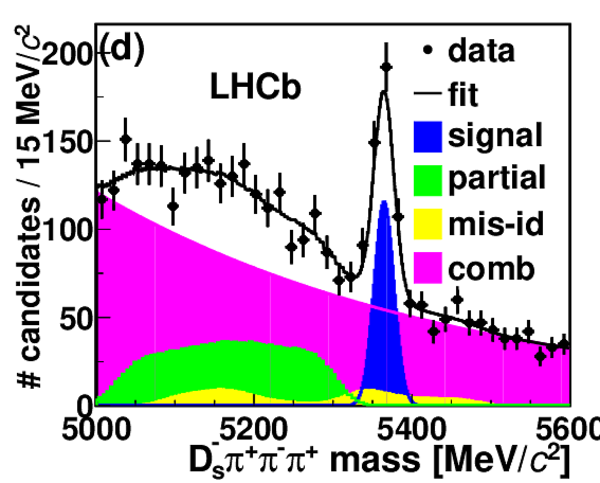
Mass distributions for a) $ B ^0_s \rightarrow D ^-_s (\phi \pi ^- )\pi ^+ $ , b) $ B ^0_s \rightarrow D ^-_s ( K ^{*0} K ^- )\pi ^+ $ , c) $ B ^0_s \rightarrow D ^-_s ( K ^+ K ^- \pi ^- )\pi ^+ $ and d) $ B ^0_s \rightarrow D ^-_s \pi ^+ \pi ^- \pi ^+ $ candidates. The fits and the various background components are described in the text. "Partial" refers to background from partially reconstructed $B^0_s$ decays, "mis-id" refers to background from fully or partially reconstructed $B^0$ and $\Lambda_b$ decays with one mis-identified daughter particle, and "comb" refers to combinatorial background. |
m_bkgphipi.pdf [30 KiB] HiDef png [215 KiB] Thumbnail [195 KiB] *.C file |

|
|
m_bkgk[..].pdf [35 KiB] HiDef png [243 KiB] Thumbnail [229 KiB] *.C file |

|
|
|
m_bkgrest.pdf [36 KiB] HiDef png [247 KiB] Thumbnail [231 KiB] *.C file |

|
|
|
m_bkgds3pi.pdf [27 KiB] HiDef png [240 KiB] Thumbnail [236 KiB] *.C file |
|
|
|
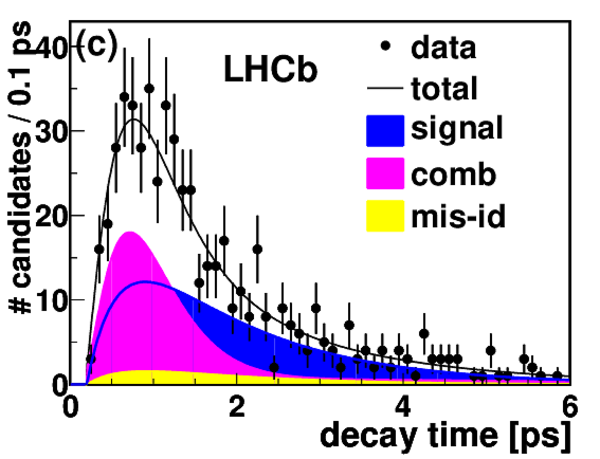
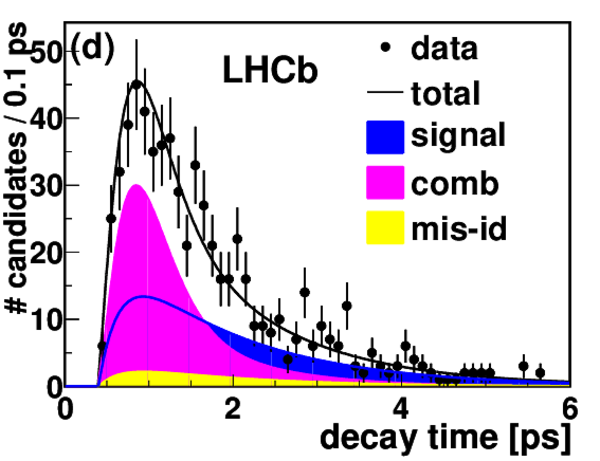
Decay time distributions for a) $ B ^0_s \rightarrow D ^-_s (\phi \pi ^- )\pi ^+ $ , b) $ B ^0_s \rightarrow D ^-_s ( K ^{*0} K ^- )\pi ^+ $ , c) $ B ^0_s \rightarrow D ^-_s ( K ^+ K ^- \pi ^- )\pi ^+ $ and d) $ B ^0_s \rightarrow D ^-_s \pi ^+ \pi ^- \pi ^+ $ candidates. The data and the fit projection are from a mass range of $\pm$ 3$\sigma_m$ around the reconstructed $ B ^0_s$ mass. The abbreviations for the various fit components are introduced in Fig. 1. |
ct_phipi.pdf [17 KiB] HiDef png [202 KiB] Thumbnail [184 KiB] *.C file |

|
|
ct_kstark.pdf [19 KiB] HiDef png [213 KiB] Thumbnail [201 KiB] *.C file |

|
|
|
ct_rest.pdf [19 KiB] HiDef png [206 KiB] Thumbnail [192 KiB] *.C file |
|
|
|
ct_ds3pi.pdf [18 KiB] HiDef png [200 KiB] Thumbnail [171 KiB] *.C file |
|
|
|
Likelihood scan for $\Delta m_{ s }$ in the range [0.0, 25.0] ps$^{-1}$. The line at $-2\Delta \ln L$ = 20.9 indicates the value in the limit $\Delta m_{ s }$ = $\infty$. |
likeli[..].pdf [12 KiB] HiDef png [193 KiB] Thumbnail [128 KiB] *.C file |

|
|
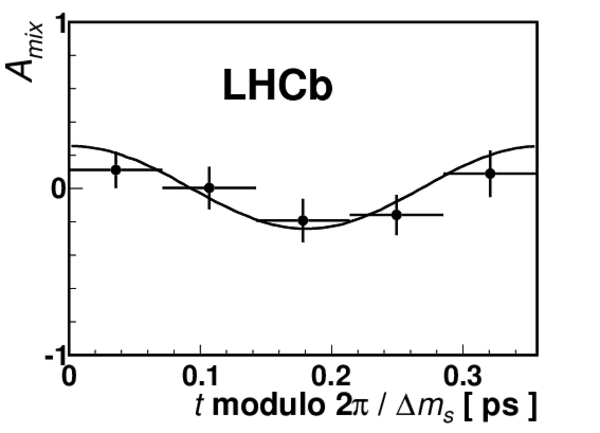
Measured asymmetry for $ B ^0_s$ candidates in bins of the decay time $t$ modulo $2\pi / \Delta m_{ s } $. The projection of the likelihood fit is superimposed. |
folded[..].pdf [4 KiB] HiDef png [62 KiB] Thumbnail [37 KiB] *.C file |
|
|
Animated gif made out of all figures. |
PAPER-2011-010.gif Thumbnail |

|
![HiDef png [215 KiB]](Directory_LHCb-PAPER-2011-010/hidef_m_bkgphipi.png)
![HiDef png [243 KiB]](Directory_LHCb-PAPER-2011-010/hidef_m_bkgkstark.png)
![HiDef png [247 KiB]](Directory_LHCb-PAPER-2011-010/hidef_m_bkgrest.png)
![HiDef png [240 KiB]](Directory_LHCb-PAPER-2011-010/hidef_m_bkgds3pi.png)
![HiDef png [202 KiB]](Directory_LHCb-PAPER-2011-010/hidef_ct_phipi.png)
![HiDef png [213 KiB]](Directory_LHCb-PAPER-2011-010/hidef_ct_kstark.png)
![HiDef png [206 KiB]](Directory_LHCb-PAPER-2011-010/hidef_ct_rest.png)
![HiDef png [200 KiB]](Directory_LHCb-PAPER-2011-010/hidef_ct_ds3pi.png)
![HiDef png [193 KiB]](Directory_LHCb-PAPER-2011-010/hidef_likelihood_scan.png)
![HiDef png [62 KiB]](Directory_LHCb-PAPER-2011-010/hidef_folded_asymmetry.png)
Tables and captions
|
$B^0_s$ signal yields. |
Table_1.pdf [51 KiB] HiDef png [83 KiB] Thumbnail [39 KiB] tex code |

|
|
Summary of the systematic uncertainties on $\Delta m_{ s }$ . The total systematic uncertainty is defined as the quadratic sum of the individual components. |
Table_2.pdf [37 KiB] HiDef png [59 KiB] Thumbnail [28 KiB] tex code |

|
![HiDef png [83 KiB]](Directory_LHCb-PAPER-2011-010/hidef_Table_1.png)
![HiDef png [59 KiB]](Directory_LHCb-PAPER-2011-010/hidef_Table_2.png)
Created on 27 April 2024.