Information
LHCb-PAPER-2011-014
CERN-PH-EP-2011-167
arXiv:1111.0521 [PDF]
(Submitted on 02 Nov 2011)
Phys. Lett. B707 (2012) 349
Inspire 944152
Tools
Abstract
A measurement of the effective $B^0_s\rightarrow K^+K^-$ lifetime is presented using approximately $37 pb^{-1}$ of data collected by LHCb during 2010. This quantity can be used to put constraints on contributions from processes beyond the Standard Model in the $B^0_s$ meson system and is determined by two complementary approaches as $\tau_{B^0_s\to K^+K^-} = 1.440 \pm 0.096 (stat) \pm 0.008 (syst) \pm 0.003 (model) ps$.
Figures and captions
|
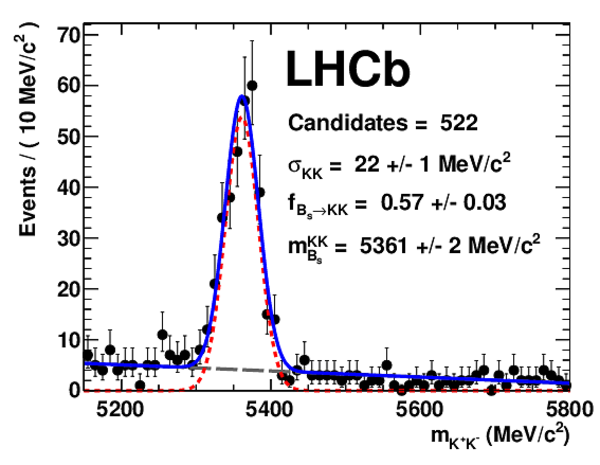
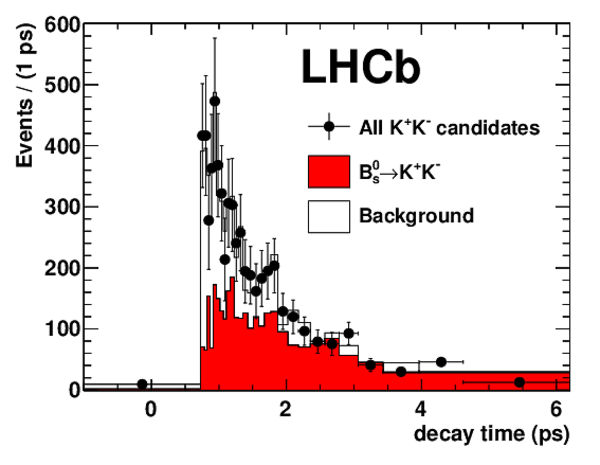
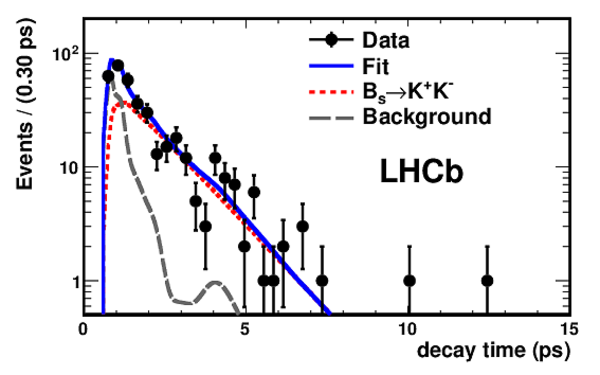
Results of the relative lifetime fit. Left: Fit to the time-integrated $KK$ mass spectrum. Right: Fit to the $KK$ decay time distribution. The black points show the total number of candidates per picosecond in each decay time bin, the stacked histogram shows the $ B ^0_ s \rightarrow K ^+ K ^- $ yield in red (dark) and the background yield in grey (light). |
Figure[..].pdf [21 KiB] HiDef png [267 KiB] Thumbnail [241 KiB] *.C file |
|
|
Figure[..].pdf [16 KiB] HiDef png [232 KiB] Thumbnail [152 KiB] *.C file |
|
|
|
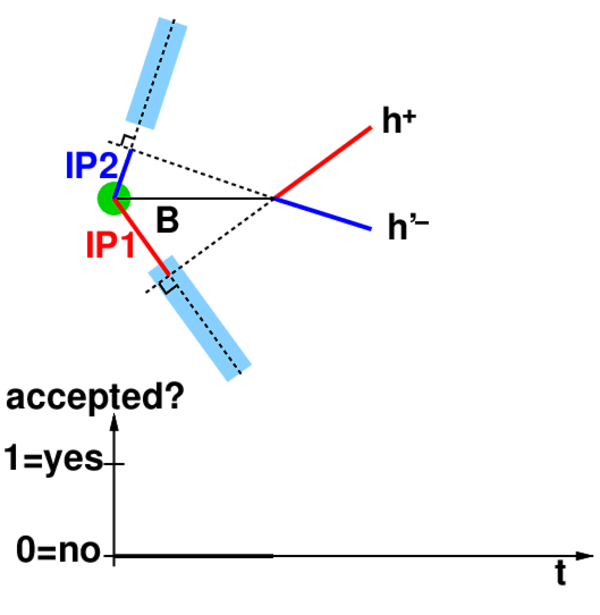
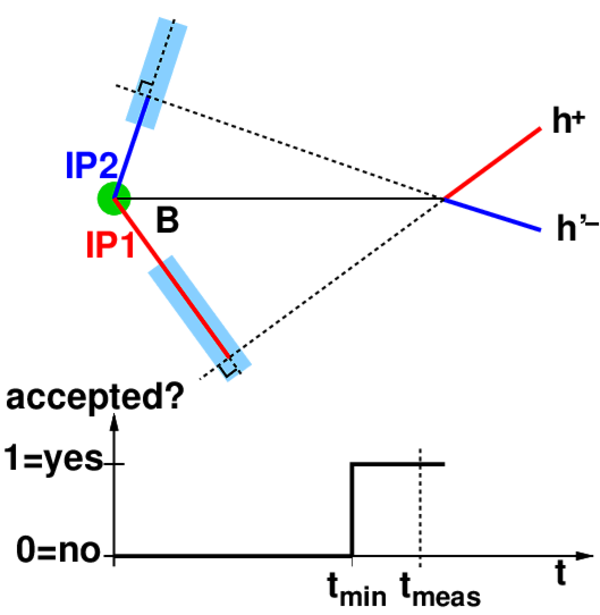
Decay-time acceptance function for an event of a two-body hadronic decay. The light blue (shaded) regions show the bands for accepting the impact parameter of a track. The impact parameter of the negative track (IP2) is too small in (a) and lies within the accepted range in (b). The actual measured decay time lies in the accepted region. The acceptance intervals give conditional likelihoods used in the lifetime fit. |
Figure[..].pdf [6 KiB] HiDef png [111 KiB] Thumbnail [85 KiB] *.C file |
|
|
Figure[..].pdf [6 KiB] HiDef png [134 KiB] Thumbnail [101 KiB] *.C file |
|
|
|
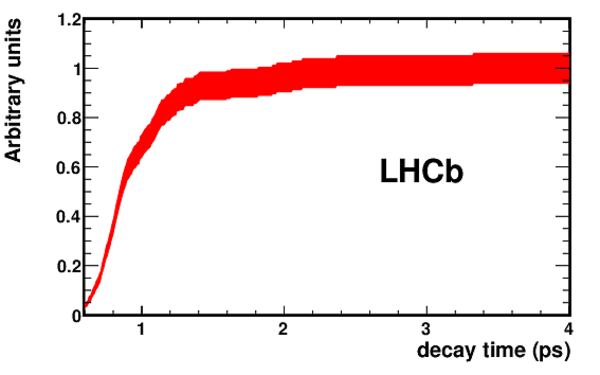
Left: Average decay-time acceptance function for signal events, where the error band is an estimate of the statistical uncertainty. The plot is scaled to 1 at large decay times, not taking into account the total signal efficiency. Right: Decay-time distribution of the $ B ^0_ s \rightarrow K ^+ K ^- $ candidates and the fitted functions. The estimation of the background distribution is sensitive to fluctuations due to the limited statistics. Both plots are for the absolute lifetime measurement. |
Figure[..].pdf [16 KiB] HiDef png [80 KiB] Thumbnail [75 KiB] *.C file |
|
|
Figure[..].pdf [28 KiB] HiDef png [157 KiB] Thumbnail [149 KiB] *.C file |
|
|
|
Animated gif made out of all figures. |
PAPER-2011-014.gif Thumbnail |

|
![HiDef png [267 KiB]](Directory_LHCb-PAPER-2011-014/hidef_Figure1Left.png)
![HiDef png [232 KiB]](Directory_LHCb-PAPER-2011-014/hidef_Figure1Right.png)
![HiDef png [111 KiB]](Directory_LHCb-PAPER-2011-014/hidef_Figure2Left.png)
![HiDef png [134 KiB]](Directory_LHCb-PAPER-2011-014/hidef_Figure2Right.png)
![HiDef png [80 KiB]](Directory_LHCb-PAPER-2011-014/hidef_Figure3Left.png)
![HiDef png [157 KiB]](Directory_LHCb-PAPER-2011-014/hidef_Figure3Right.png)
Tables and captions
|
Summary of systematic uncertainties on the $ B ^0_ s \rightarrow K ^+ K ^- $ lifetime measurements. |
Table_1.pdf [64 KiB] HiDef png [92 KiB] Thumbnail [43 KiB] tex code |

|
![HiDef png [92 KiB]](Directory_LHCb-PAPER-2011-014/hidef_Table_1.png)
Created on 27 April 2024.