Measurements of the Branching fractions for $B_{(s)} \to D_{(s)}\pi\pi\pi$ and $\Lambda_b^0 \to \Lambda_c^+\pi\pi\pi$
[to restricted-access page]Information
LHCb-PAPER-2011-016
CERN-PH-EP-2011-151
arXiv:1109.6831 [PDF]
(Submitted on 30 Sep 2011)
Phys. Rev. D84 (2011) 092001
Inspire 930219
Tools
Abstract
Branching fractions of the decays $H_b\to H_c\pi^-\pi^+\pi^-$ relative to $H_b\to H_c\pi^-$ are presented, where $H_b$ ($H_c$) represents B^0-bar($D^+$), $B^-$ ($D^0$), B_s^0-bar ($D_s^+$) and $\Lambda_b^0$ ($\Lambda_c^+$). The measurements are performed with the LHCb detector using 35${\rm pb^{-1}}$ of data collected at $\sqrt{s}=7$ TeV. The ratios of branching fractions are measured to be B(B^0-bar -> D^+\pi^-\pi^+\pi^-)/ B(B^0-bar -> D^+\pi^-) = 2.38\pm0.11\pm0.21 B(B^- -> D^0\pi^-\pi^+\pi^-) / B(B^- -> D^0\pi^-) = 1.27\pm0.06\pm0.11 B(B_s^0-bar -> D_s^+\pi^-\pi^+\pi^-) / B(B_s^0-bar -> D_s^+\pi^-) = 2.01\pm0.37\pm0.20 B(\Lambda_b^0->\Lambda_c^+\pi^-\pi^+\pi^-) / B(\Lambda_b^0 -> \Lambda_c^+\pi^-) = 1.43\pm0.16\pm0.13. We also report measurements of partial decay rates of these decays to excited charm hadrons. These results are of comparable or higher precision than existing measurements.
Figures and captions
|
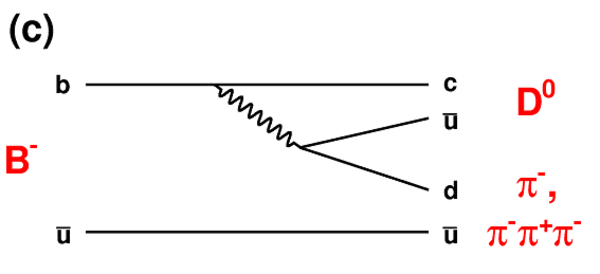
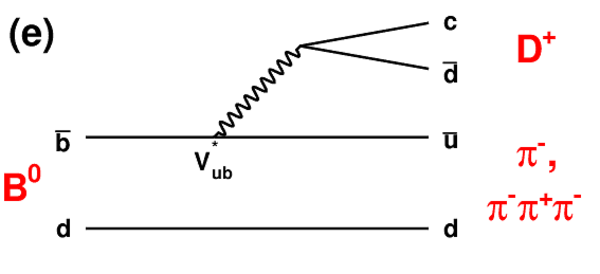
Feynman diagrams for $H_b\rightarrow H_c\pi^-$ and $H_b\rightarrow H_c\pi^-\pi^+\pi^-$ decays. Figs. (a) and (b) show external tree diagrams, (c) and (d) show color-suppressed tree diagrams ($B^-$ and $\Lambda_b^0$ only), and (e) shows the Cabibbo-suppressed external tree diagram, only accessible to $B^0$ meson. |
TreeB2[..].eps [9 KiB] HiDef png [80 KiB] Thumbnail [65 KiB] *.C file |

|
|
Lb2LcP[..].eps [7 KiB] HiDef png [63 KiB] Thumbnail [50 KiB] *.C file |

|
|
|
TreeB2[..].eps [7 KiB] HiDef png [56 KiB] Thumbnail [45 KiB] *.C file |
|
|
|
Lb2LcP[..].eps [8 KiB] HiDef png [66 KiB] Thumbnail [53 KiB] *.C file |

|
|
|
TreeB2[..].eps [7 KiB] HiDef png [61 KiB] Thumbnail [51 KiB] *.C file |
|
|
|
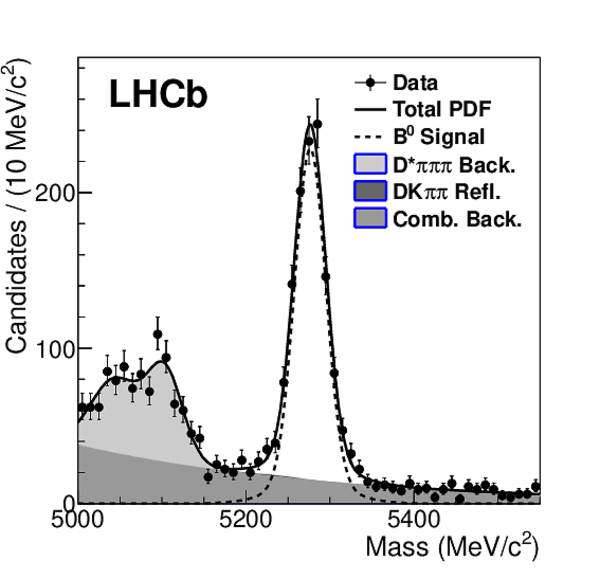
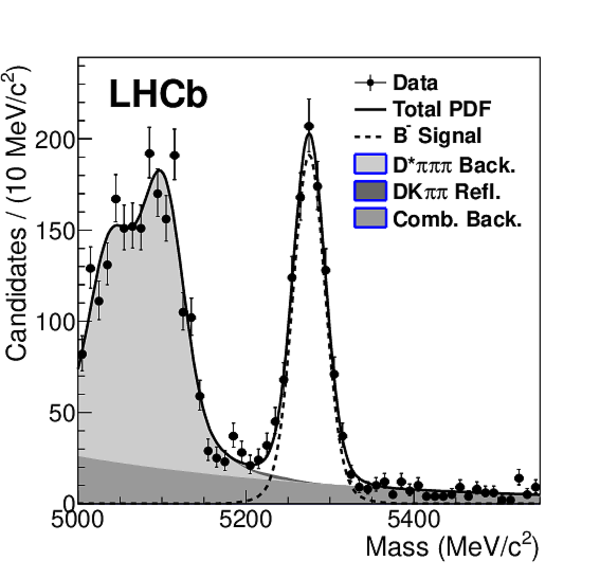
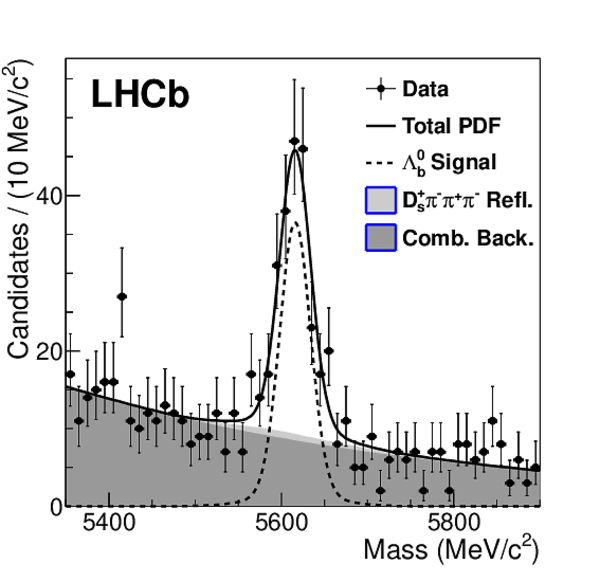
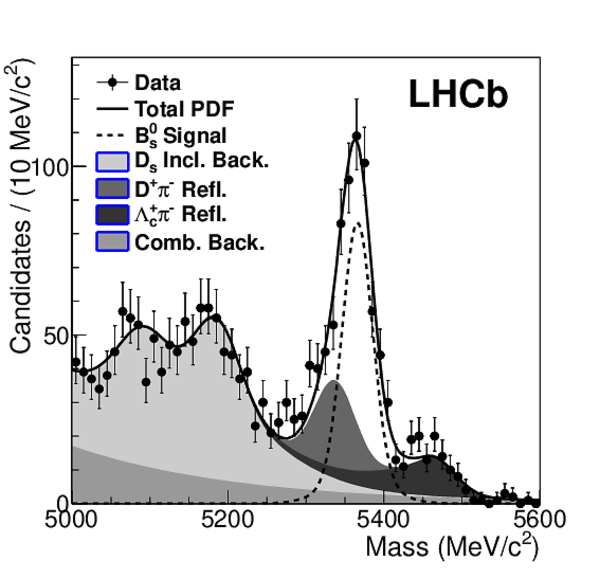
Invariant mass distributions for $\overline{ B }{} ^0 \rightarrow D^+\pi^-\pi^+\pi^-$ (top left), $B^-\rightarrow D^0\pi^-\pi^+\pi^-$ (top right), $\overline{ B }{} ^0_s \rightarrow D_s^+\pi^-\pi^+\pi^-$ (bottom left), and $\Lambda_b^0\rightarrow \Lambda_c^+\pi^-\pi^+\pi^-$ (bottom right). Fits showing the signal and background components are indicated, and are described in the text. |
b2dcha[..].eps [21 KiB] HiDef png [231 KiB] Thumbnail [228 KiB] *.C file |
|
|
b2d0a1[..].eps [26 KiB] HiDef png [253 KiB] Thumbnail [251 KiB] *.C file |
|
|
|
bs2dsa[..].eps [25 KiB] HiDef png [282 KiB] Thumbnail [287 KiB] *.C file |

|
|
|
lb2lca[..].eps [28 KiB] HiDef png [251 KiB] Thumbnail [250 KiB] *.C file |
|
|
|
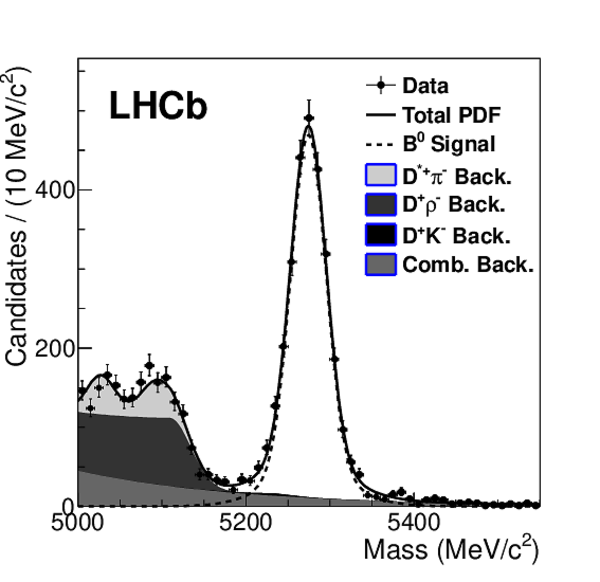
Invariant mass distributions for $\overline{ B }{} ^0 \rightarrow D^+\pi^-$ (top left), $B^{-}\rightarrow D^0\pi^{-}$ (top right), $\overline{ B }{} ^0_s \rightarrow D_s^+\pi^-$ (bottom left), and $\Lambda_b^0\rightarrow \Lambda_c^+\pi^-$ (bottom right). Fits showing the signal and background components are indicated, and are described in the text. |
b2dpi_[..].eps [29 KiB] HiDef png [226 KiB] Thumbnail [220 KiB] *.C file |
|
|
b2d0pi[..].eps [30 KiB] HiDef png [238 KiB] Thumbnail [232 KiB] *.C file |

|
|
|
bs2dsp[..].eps [24 KiB] HiDef png [274 KiB] Thumbnail [275 KiB] *.C file |
|
|
|
lb2lcp[..].eps [21 KiB] HiDef png [234 KiB] Thumbnail [232 KiB] *.C file |

|
|
|
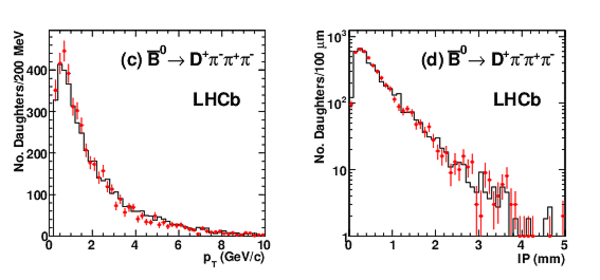
Comparisons of the $p_T$ and IP spectra for the daughters from the $D^+$ in $\overline{ B }{} ^0 \rightarrow D^+\pi^-$ [(a) and (b)], and from the $D^+$ in $\overline{ B }{} ^0 \rightarrow D^+\pi^-\pi^+\pi^-$ [(c) and (d)]; Points with error bars are data and the solid lines are simulation. |
ddau_H[..].eps [19 KiB] HiDef png [155 KiB] Thumbnail [130 KiB] *.C file |

|
|
ddau_3[..].eps [21 KiB] HiDef png [170 KiB] Thumbnail [143 KiB] *.C file |

|
|
|
Comparisons of the $p_T$ and IP spectra for the bachelor pion in $\overline{ B }{} ^0 \rightarrow D^+\pi^-$ [(a) and (b)], and for the 3 pions in $\overline{ B }{} ^0 \rightarrow D^+\pi^-\pi^+\pi^-$ [(c) and (d)]. Points with error bars are data and the solid lines are simulation. |
kdau_H[..].eps [20 KiB] HiDef png [167 KiB] Thumbnail [139 KiB] *.C file |

|
|
kdau_3[..].eps [20 KiB] HiDef png [165 KiB] Thumbnail [141 KiB] *.C file |
|
|
|
Invariant mass of the $3\pi$ system in $\overline{ B }{} ^0 \rightarrow D^+\pi^-\pi^+\pi^-$ (top left), $B^-\rightarrow D^0\pi^-\pi^+\pi^-$ (top right), $\overline{ B }{} ^0_s \rightarrow D_s^+\pi^-\pi^+\pi^-$ (bottom left) and $\Lambda_b^0\rightarrow \Lambda_c^+\pi^-\pi^+\pi^-$ (bottom right) decays. The data are the points with error bars and the simulations are the solid lines and shaded regions. |
PiPiPi[..].eps [14 KiB] HiDef png [205 KiB] Thumbnail [187 KiB] *.C file |

|
|
PiPiPi[..].eps [14 KiB] HiDef png [261 KiB] Thumbnail [193 KiB] *.C file |

|
|
|
PiPiPi[..].eps [12 KiB] HiDef png [179 KiB] Thumbnail [176 KiB] *.C file |

|
|
|
PiPiPi[..].eps [14 KiB] HiDef png [254 KiB] Thumbnail [221 KiB] *.C file |
|
|
|
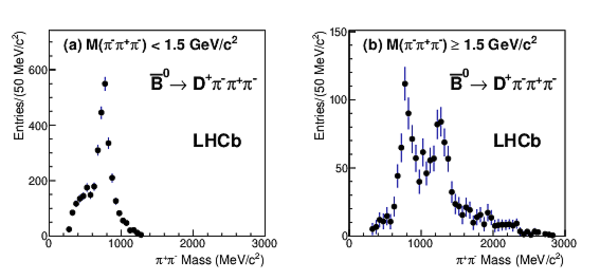
$\pi^+\pi^-$ invariant mass (2 combinations per $\overline{ B }{} ^0 $ candidate) in the $3\pi$ system for $\overline{ B }{} ^0 \rightarrow D^+\pi^-\pi^+\pi^-$ when (a) $M(\pi^-\pi^+\pi^-)<1.5$ GeV/$c^2$ and (b) $M(\pi^-\pi^+\pi^-)\ge 1.5$ GeV/$c^2$. The corresponding plots for $B^-\rightarrow D^0\pi^-\pi^+\pi^-$ are shown in (c) and (d). |
pipiMa[..].eps [16 KiB] HiDef png [129 KiB] Thumbnail [134 KiB] *.C file |
|
|
pipiMa[..].eps [16 KiB] HiDef png [130 KiB] Thumbnail [133 KiB] *.C file |

|
|
|
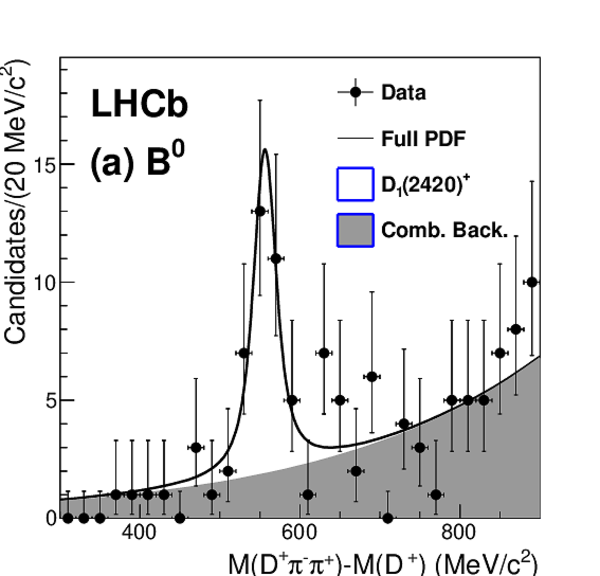
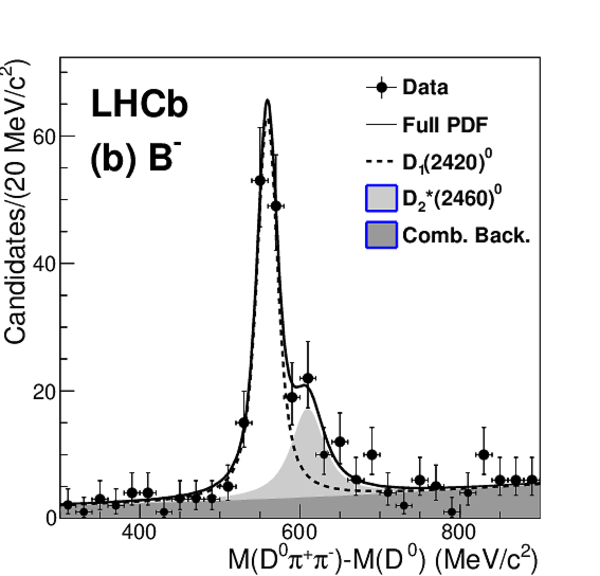
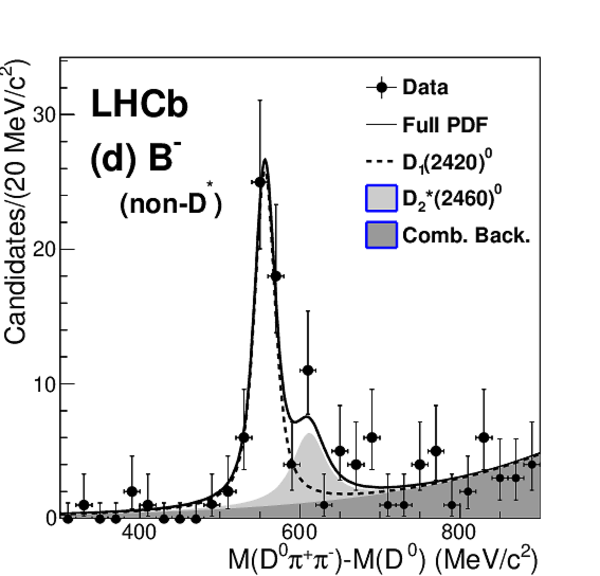
Invariant mass difference $M(D\pi^-\pi^+) - M(D)$, for (a) $\overline{ B }{} ^0 \rightarrow D^+\pi^-\pi^+\pi^-$ signal candidates, (b) $B^-\rightarrow D^0\pi^-\pi^+\pi^-$ signal candidates, (c) $B^-\rightarrow D^0\pi^-\pi^+\pi^-$ through a $D^{*+}$ intermediate state, and (d) $B^-\rightarrow D^0\pi^-\pi^+\pi^-$ not through a $D^{*+}$ intermediate state. The signal components are the white region (and lightly shaded regions for $B^-\rightarrow D^0\pi^-\pi^+\pi^-$), and the background component is the darker shaded region. |
B02D3P[..].eps [18 KiB] HiDef png [219 KiB] Thumbnail [208 KiB] *.C file |
|
|
Bp2D03[..].eps [19 KiB] HiDef png [235 KiB] Thumbnail [225 KiB] *.C file |
|
|
|
Bp2D03[..].eps [20 KiB] HiDef png [242 KiB] Thumbnail [233 KiB] *.C file |

|
|
|
Bp2D03[..].eps [19 KiB] HiDef png [242 KiB] Thumbnail [232 KiB] *.C file |
|
|
|
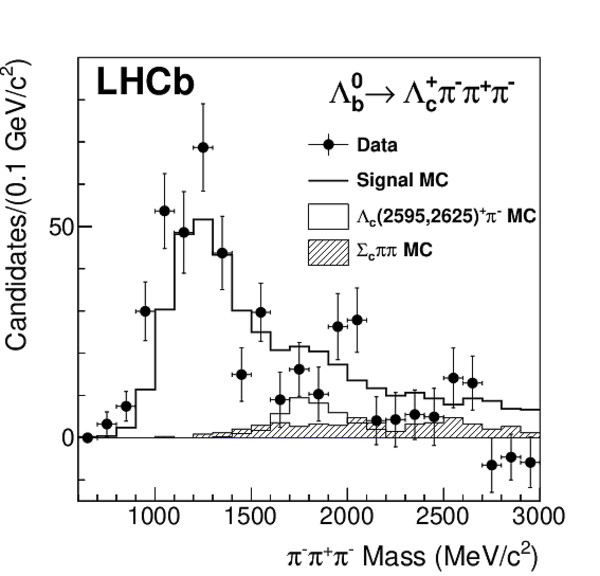
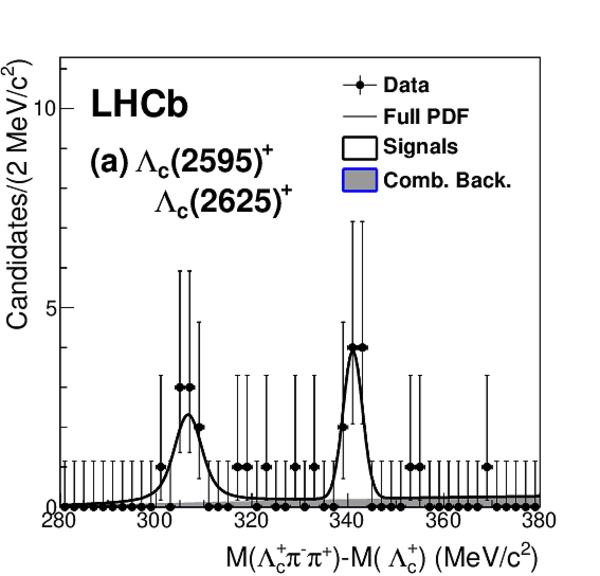
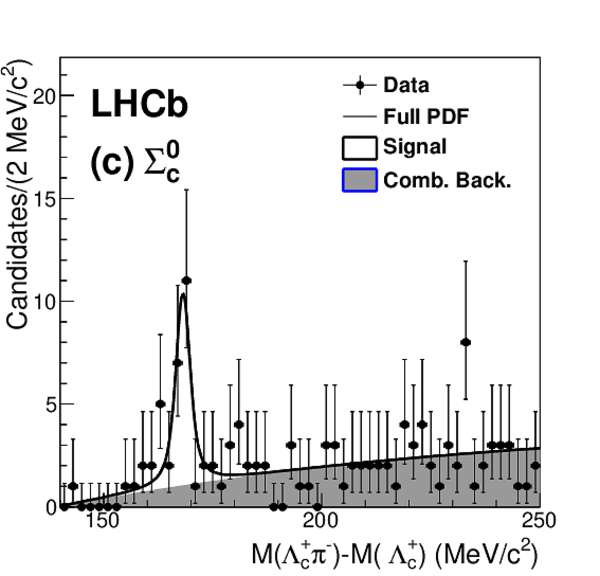
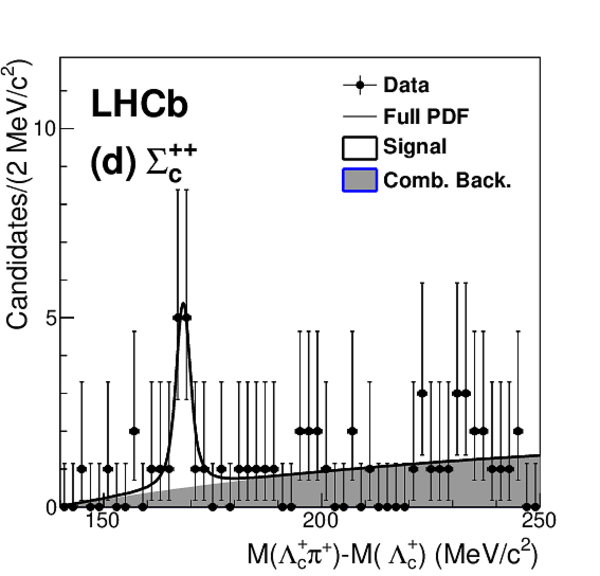
Intermediate resonances contributing to the $\Lambda_b^0\rightarrow \Lambda_c^+\pi^-\pi^+\pi^-$ decay. Shown are distributions for (a) $M(\Lambda_c^+\pi^-\pi^+) - M(\Lambda_c^+)$, with $\Lambda_c(2595)^+$ and $\Lambda_c(2625)^+$ contributions, (b) $M(\Lambda_c^+\pi^{\pm}) - M(\Lambda_c^+)$ (3 combinations per $\Lambda_b^0$ candidate) (c) $M(\Lambda_c^+\pi^{-}) - M(\Lambda_c^+)$ (2 combinations per $\Lambda_b^0$ candidate), and (d) $M(\Lambda_c^+\pi^{+}) - M(\Lambda_c^+)$ (1 combination per $\Lambda_b^0$ candidate), showing the intermediate $\Sigma_c$ states. The line is a fit as described in the text, and the shaded region is the fitted background. |
Lb2Lc3[..].eps [24 KiB] HiDef png [228 KiB] Thumbnail [211 KiB] *.C file |
|
|
Lb2Lc3[..].eps [26 KiB] HiDef png [211 KiB] Thumbnail [206 KiB] *.C file |

|
|
|
Lb2Lc3[..].eps [26 KiB] HiDef png [214 KiB] Thumbnail [208 KiB] *.C file |
|
|
|
Lb2Lc3[..].eps [25 KiB] HiDef png [211 KiB] Thumbnail [193 KiB] *.C file |
|
|
|
Animated gif made out of all figures. |
PAPER-2011-016.gif Thumbnail |

|
![HiDef png [80 KiB]](Directory_LHCb-PAPER-2011-016/hidef_TreeB2D0PiDecayCF.png)
![HiDef png [63 KiB]](Directory_LHCb-PAPER-2011-016/hidef_Lb2LcPiDecayExternal.png)
![HiDef png [56 KiB]](Directory_LHCb-PAPER-2011-016/hidef_TreeB2D0PiDecayCS.png)
![HiDef png [66 KiB]](Directory_LHCb-PAPER-2011-016/hidef_Lb2LcPiDecayInternal.png)
![HiDef png [61 KiB]](Directory_LHCb-PAPER-2011-016/hidef_TreeB2DPiDecayCS.png)
![HiDef png [231 KiB]](Directory_LHCb-PAPER-2011-016/hidef_b2dcha1_trigsel_35pb_Paper.png)
![HiDef png [253 KiB]](Directory_LHCb-PAPER-2011-016/hidef_b2d0a1_trigsel_35pb_Paper.png)
![HiDef png [282 KiB]](Directory_LHCb-PAPER-2011-016/hidef_bs2dsa1_trigsel_35pb_Paper.png)
![HiDef png [251 KiB]](Directory_LHCb-PAPER-2011-016/hidef_lb2lca1_trigsel_35pb_Paper.png)
![HiDef png [226 KiB]](Directory_LHCb-PAPER-2011-016/hidef_b2dpi_trigsel_35pb_Paper.png)
![HiDef png [238 KiB]](Directory_LHCb-PAPER-2011-016/hidef_b2d0pi_trigsel_35pb_Paper.png)
![HiDef png [274 KiB]](Directory_LHCb-PAPER-2011-016/hidef_bs2dspi_trigsel_35pb_Paper.png)
![HiDef png [234 KiB]](Directory_LHCb-PAPER-2011-016/hidef_lb2lcpi_trigsel_35pb_Paper.png)
![HiDef png [155 KiB]](Directory_LHCb-PAPER-2011-016/hidef_ddau_H_paper.png)
![HiDef png [170 KiB]](Directory_LHCb-PAPER-2011-016/hidef_ddau_3H_paper.png)
![HiDef png [167 KiB]](Directory_LHCb-PAPER-2011-016/hidef_kdau_H_paper.png)
![HiDef png [165 KiB]](Directory_LHCb-PAPER-2011-016/hidef_kdau_3H_paper.png)
![HiDef png [205 KiB]](Directory_LHCb-PAPER-2011-016/hidef_PiPiPiMass_B2DA1.png)
![HiDef png [261 KiB]](Directory_LHCb-PAPER-2011-016/hidef_PiPiPiMass_B2D0A1.png)
![HiDef png [179 KiB]](Directory_LHCb-PAPER-2011-016/hidef_PiPiPiMass_Bs2DsA1.png)
![HiDef png [254 KiB]](Directory_LHCb-PAPER-2011-016/hidef_PiPiPiMass_Lb2LcA1.png)
![HiDef png [129 KiB]](Directory_LHCb-PAPER-2011-016/hidef_pipiMass_B2DA1.png)
![HiDef png [130 KiB]](Directory_LHCb-PAPER-2011-016/hidef_pipiMass_B2D0A1.png)
![HiDef png [219 KiB]](Directory_LHCb-PAPER-2011-016/hidef_B02D3Pi_ExcCharm_Trig_Paper.png)
![HiDef png [235 KiB]](Directory_LHCb-PAPER-2011-016/hidef_Bp2D03Pi_ExcCharm_Trig_Paper.png)
![HiDef png [242 KiB]](Directory_LHCb-PAPER-2011-016/hidef_Bp2D03Pi_ExcCharmDStar_TrigSel_Paper.png)
![HiDef png [242 KiB]](Directory_LHCb-PAPER-2011-016/hidef_Bp2D03Pi_ExcCharmnonDStar_TrigSel_Paper.png)
![HiDef png [228 KiB]](Directory_LHCb-PAPER-2011-016/hidef_Lb2Lc3pi_Lcpipi_Trig.png)
![HiDef png [211 KiB]](Directory_LHCb-PAPER-2011-016/hidef_Lb2Lc3piTrigSel_SigmaCpipi.png)
![HiDef png [214 KiB]](Directory_LHCb-PAPER-2011-016/hidef_Lb2Lc3piTrigSel_SigmaC0pipi.png)
![HiDef png [211 KiB]](Directory_LHCb-PAPER-2011-016/hidef_Lb2Lc3piTrigSel_SigmaCpppipi.png)
Tables and captions
|
Summary of efficiencies for decay channels under study. Here, $\epsilon_{\rm kin}$ is the total kinematic selection efficiency, $\epsilon_{\rm trig}$ is the trigger efficiency, and $\epsilon_{\rm tot}$ is their product. The uncertainties shown are statistical only. |
Table_1.pdf [52 KiB] HiDef png [100 KiB] Thumbnail [51 KiB] tex code |

|
|
Summary of yields for the branching fraction computation. Uncertainties are statistical only. |
Table_2.pdf [50 KiB] HiDef png [52 KiB] Thumbnail [27 KiB] tex code |

|
|
Summary of corrections and systematic uncertainties to the ratio of branching fractions $\cal{B}(H_b\rightarrow H_c\pi^-\pi^+\pi^-)/\cal{B}(H_b\rightarrow H_c\pi^-)$. |
Table_3.pdf [57 KiB] HiDef png [89 KiB] Thumbnail [28 KiB] tex code |

|
|
Summary of yields for the signal and normalization modes. Below $D_1$ and $D_2^*$ refer to the $D_1(2420)$ and $D_2^*(2460)$ mesons, respectively. |
Table_4.pdf [54 KiB] HiDef png [105 KiB] Thumbnail [52 KiB] tex code |

|
|
Summary of the relative reconstruction and selection efficiencies ($\epsilon_{\rm sel}^{\rm rel}$) and trigger efficiencies ($\epsilon_{\rm trig|sel}^{\rm rel}$) for the excited charm hadron intermediate states with respect to the inclusive $H_c\pi^-\pi^+\pi^-$ final states. Below $D_1$ and $D_2^*$ refer to $D_1(2420)$ and $D_2^*(2460)$, respectively. The uncertainties shown are statistical only. |
Table_5.pdf [54 KiB] HiDef png [79 KiB] Thumbnail [39 KiB] tex code |

|
![HiDef png [100 KiB]](Directory_LHCb-PAPER-2011-016/hidef_Table_1.png)
![HiDef png [52 KiB]](Directory_LHCb-PAPER-2011-016/hidef_Table_2.png)
![HiDef png [89 KiB]](Directory_LHCb-PAPER-2011-016/hidef_Table_3.png)
![HiDef png [105 KiB]](Directory_LHCb-PAPER-2011-016/hidef_Table_4.png)
![HiDef png [79 KiB]](Directory_LHCb-PAPER-2011-016/hidef_Table_5.png)
Created on 02 May 2024.