Information
LHCb-PAPER-2011-017
CERN-PH-EP-2011-163
arXiv:1110.3970 [PDF]
(Submitted on 18 Oct 2011)
Phys. Rev. D84 (2011) 112008
Inspire 940366
Tools
Abstract
A model-independent search for direct CP violation in the Cabibbo suppressed decay $D^+ \to K^- K^+\pi^+$ in a sample of approximately 370,000 decays is carried out. The data were collected by the LHCb experiment in 2010 and correspond to an integrated luminosity of 35 pb$^{-1}$. The normalized Dalitz plot distributions for $D^+$ and $D^-$ are compared using four different binning schemes that are sensitive to different manifestations of CP violation. No evidence for CP asymmetry is found.
Figures and captions
|
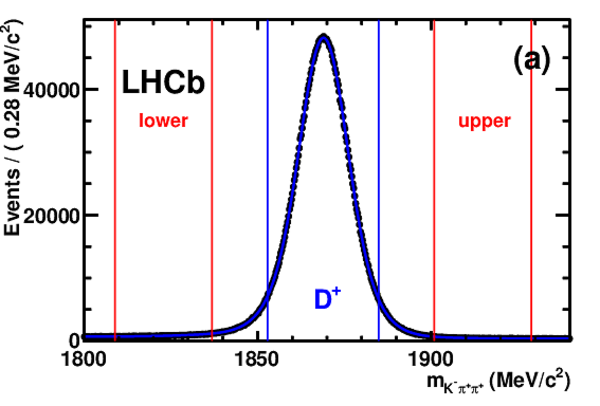
Fitted mass spectra of (a) $ K ^- \pi ^+ \pi ^+ $ and (b) $ K ^- K ^+ \pi ^+ $ candidates from samples 1 and 3, $ D ^+ $ and $ D ^- $ combined. The signal mass windows and sidebands defined in the text are labelled. |
figure1a.pdf [65 KiB] HiDef png [165 KiB] Thumbnail [131 KiB] *.C file |
|
|
figure1b.pdf [66 KiB] HiDef png [228 KiB] Thumbnail [179 KiB] *.C file |

|
|
|
Dalitz plot of the $ D ^+ \rightarrow K ^- K ^+ \pi ^+ $ decay for selected candidates in the signal window. The vertical $\overline{ K }{} ^{*}(892)^{0}$ and horizontal $\phi(1020)$ contributions are clearly visible in the data. |
figure2.pdf [43 KiB] HiDef png [840 KiB] Thumbnail [454 KiB] *.C file |

|
|
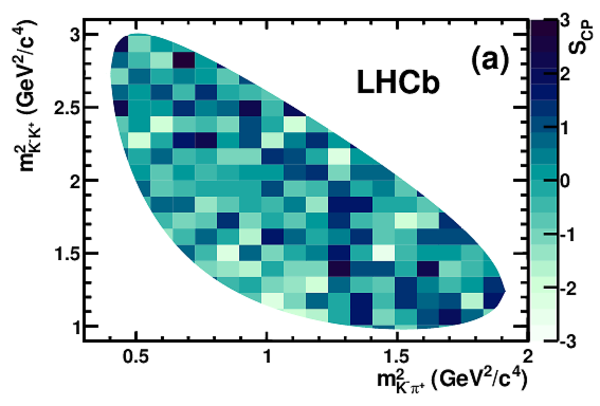
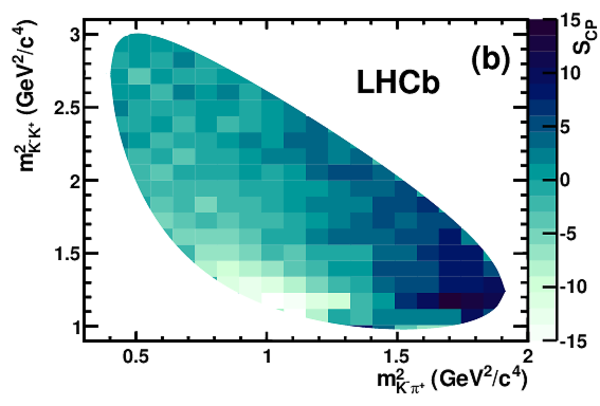
$\mathcal{S}_{CP}$ across the Dalitz plot in a Monte Carlo pseudo-experiment with a large number of events with (a) no CPV and (b) a 4$^{\circ}$ CPV in the $\phi\pi$ phase. Note the difference in colour scale between (a) and (b). |
figure3a.pdf [18 KiB] HiDef png [177 KiB] Thumbnail [161 KiB] *.C file |
|
|
figure3b.pdf [18 KiB] HiDef png [174 KiB] Thumbnail [152 KiB] *.C file |
|
|
|
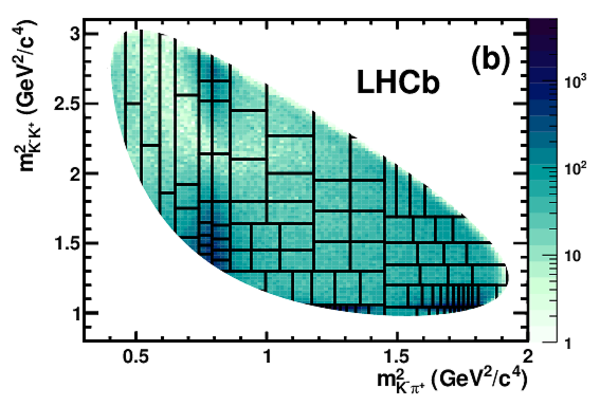
Layout of the (a) "Adaptive I" and (b) "Adaptive II" binnings on the Dalitz plot of data. |
figure4a.pdf [45 KiB] HiDef png [833 KiB] Thumbnail [440 KiB] *.C file |

|
|
figure4b.pdf [47 KiB] HiDef png [850 KiB] Thumbnail [437 KiB] *.C file |
|
|
|
(a) Distribution of $\mathcal{S}_{CP}$ values from $ D ^+ \rightarrow K ^- \pi ^+ \pi ^+ $ from a test with 900 uniform bins. The mean of the fitted Gaussian distribution is $0.015\pm0.034$ and the width is $0.996\pm0.023$. (b) Distribution of $\mathcal{S}_{CP}$ values from $ D ^+_ s \rightarrow K ^- K ^+ \pi ^+ $ with 129 bins. The fitted mean is $-0.011\pm0.084$ and the width is $0.958\pm0.060$. |
figure5a.pdf [15 KiB] HiDef png [87 KiB] Thumbnail [54 KiB] *.C file |
|
|
figure5b.pdf [15 KiB] HiDef png [82 KiB] Thumbnail [51 KiB] *.C file |

|
|
|
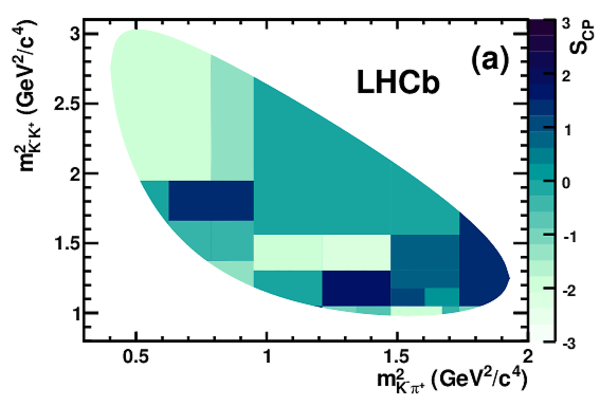
Dalitz plots of (a) $ D ^+ \rightarrow K ^- \pi ^+ \pi ^+ $, showing the 25-bin adaptive scheme with the $\mathcal{S}_{CP}$ values, and (b) $ D ^+_ s \rightarrow K ^- K ^+ \pi ^+ $, showing the three regions referred to in the text. The higher and lower $ K ^- \pi ^+ $ invariant mass combinations are plotted in (a) as there are identical pions in the final state. |
figure6a.pdf [40 KiB] HiDef png [693 KiB] Thumbnail [418 KiB] *.C file |
|
|
figure6b.pdf [44 KiB] HiDef png [891 KiB] Thumbnail [480 KiB] *.C file |

|
|
|
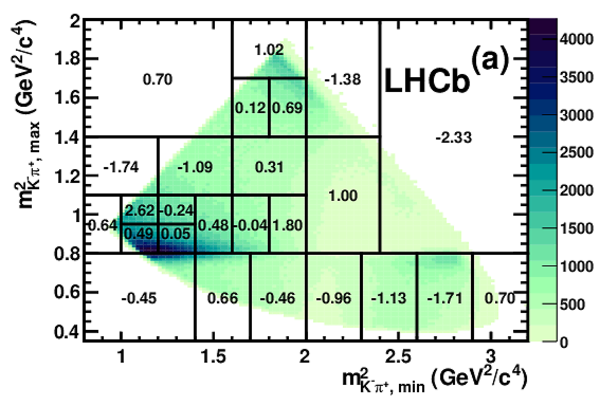
Distribution of ${\mathcal S}^i_{\it CP}$ in the Dalitz plot for (a) "Adaptive I", (b) "Adaptive II", (c) "Uniform I" and (d) "Uniform II". In (c) and (d) bins at the edges are not shown if the number of entries is not above a threshold of 50 (see Sect. III). |
figure7a.pdf [45 KiB] HiDef png [144 KiB] Thumbnail [145 KiB] *.C file |
|
|
figure7b.pdf [48 KiB] HiDef png [208 KiB] Thumbnail [177 KiB] *.C file |

|
|
|
figure7c.pdf [18 KiB] HiDef png [169 KiB] Thumbnail [160 KiB] *.C file |

|
|
|
figure7d.pdf [20 KiB] HiDef png [216 KiB] Thumbnail [218 KiB] *.C file |

|
|
|
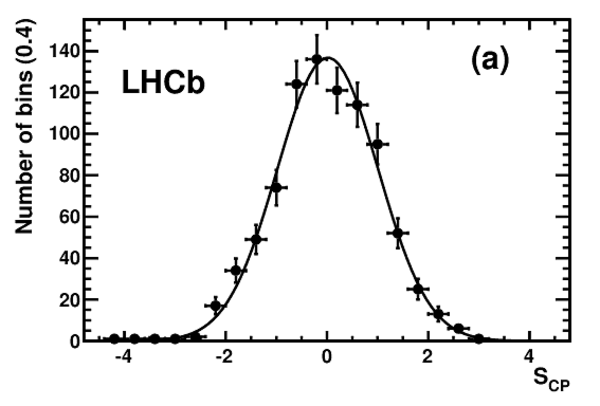
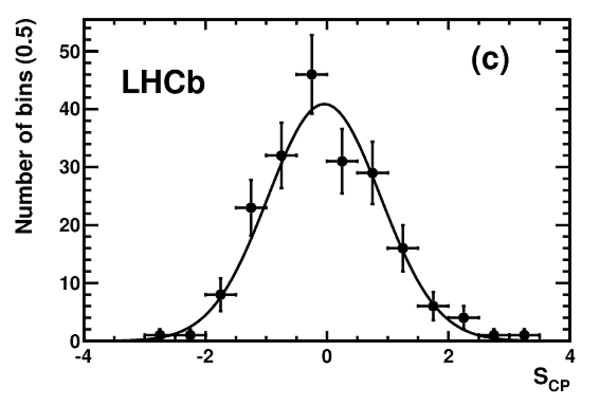
Distribution of ${\mathcal S}^i_{\it CP}$ fitted to Gaussian functions, for (a) "Adaptive I", (b) "Adaptive II", (c) "Uniform I" and (d) "Uniform II". The fit results are given in Table IX. |
figure8a.pdf [14 KiB] HiDef png [80 KiB] Thumbnail [50 KiB] *.C file |

|
|
figure8b.pdf [14 KiB] HiDef png [80 KiB] Thumbnail [50 KiB] *.C file |

|
|
|
figure8c.pdf [15 KiB] HiDef png [78 KiB] Thumbnail [49 KiB] *.C file |
|
|
|
figure8d.pdf [15 KiB] HiDef png [81 KiB] Thumbnail [49 KiB] *.C file |

|
|
|
Animated gif made out of all figures. |
PAPER-2011-017.gif Thumbnail |

|
![HiDef png [165 KiB]](Directory_LHCb-PAPER-2011-017/hidef_figure1a.png)
![HiDef png [228 KiB]](Directory_LHCb-PAPER-2011-017/hidef_figure1b.png)
![HiDef png [840 KiB]](Directory_LHCb-PAPER-2011-017/hidef_figure2.png)
![HiDef png [177 KiB]](Directory_LHCb-PAPER-2011-017/hidef_figure3a.png)
![HiDef png [174 KiB]](Directory_LHCb-PAPER-2011-017/hidef_figure3b.png)
![HiDef png [833 KiB]](Directory_LHCb-PAPER-2011-017/hidef_figure4a.png)
![HiDef png [850 KiB]](Directory_LHCb-PAPER-2011-017/hidef_figure4b.png)
![HiDef png [87 KiB]](Directory_LHCb-PAPER-2011-017/hidef_figure5a.png)
![HiDef png [82 KiB]](Directory_LHCb-PAPER-2011-017/hidef_figure5b.png)
![HiDef png [693 KiB]](Directory_LHCb-PAPER-2011-017/hidef_figure6a.png)
![HiDef png [891 KiB]](Directory_LHCb-PAPER-2011-017/hidef_figure6b.png)
![HiDef png [144 KiB]](Directory_LHCb-PAPER-2011-017/hidef_figure7a.png)
![HiDef png [208 KiB]](Directory_LHCb-PAPER-2011-017/hidef_figure7b.png)
![HiDef png [169 KiB]](Directory_LHCb-PAPER-2011-017/hidef_figure7c.png)
![HiDef png [216 KiB]](Directory_LHCb-PAPER-2011-017/hidef_figure7d.png)
![HiDef png [80 KiB]](Directory_LHCb-PAPER-2011-017/hidef_figure8a.png)
![HiDef png [80 KiB]](Directory_LHCb-PAPER-2011-017/hidef_figure8b.png)
![HiDef png [78 KiB]](Directory_LHCb-PAPER-2011-017/hidef_figure8c.png)
![HiDef png [81 KiB]](Directory_LHCb-PAPER-2011-017/hidef_figure8d.png)
Tables and captions
|
Yield ($S$) and purity for samples 1 and 3 after the final selection. The purity is estimated in the 2$\sigma$ mass window. |
Table_1.pdf [52 KiB] HiDef png [47 KiB] Thumbnail [22 KiB] tex code |

|
|
Number of candidates $(S+B)$ in the signal windows shown in Fig. 1 after the final selection, for use in the subsequent analysis. |
Table_2.pdf [49 KiB] HiDef png [49 KiB] Thumbnail [23 KiB] tex code |

|
|
The CLEO-c amplitude model "B" [7] used in the simulation studies. The uncertainties are statistical, experimental systematic and model systematic respectively. |
Table_3.pdf [55 KiB] HiDef png [102 KiB] Thumbnail [49 KiB] tex code |

|
|
Results from sets of 100 pseudo-experiments with different $ C P$ asymmetries and Adaptive I and II binnings. $p(3\sigma)$ is the probability of a 3$\sigma$ observation of CPV. $\langle S \rangle$ is the mean significance with which CPV is observed. |
Table_4.pdf [39 KiB] HiDef png [92 KiB] Thumbnail [42 KiB] tex code |

|
|
Results from sets of 100 pseudo-experiments with $4^{\circ}$ CPV in the $\phi(1020)$ phase and different Dalitz plot models. $p(3\sigma)$ is the probability of a 3$\sigma$ observation of CPV. $\langle S \rangle$ is the mean significance with which CPV is observed. The sample size is comparable to that seen in data. |
Table_5.pdf [46 KiB] HiDef png [63 KiB] Thumbnail [29 KiB] tex code |

|
|
Results ($p$-values, in %) from tests with the $ D ^+ \rightarrow K ^- \pi ^+ \pi ^+ $ control channel using the uniform and adaptive binning schemes. The values correspond to tests performed on the whole dataset in the mass windows defined in Sect. II. |
Table_6.pdf [15 KiB] HiDef png [29 KiB] Thumbnail [13 KiB] tex code |

|
|
Results ($p$-values, in %) from tests with the $ D ^+_ s \rightarrow K ^- K ^+ \pi ^+ $ control channel using the uniform binning scheme. The values correspond to tests performed separately on Zones A-C, with samples 1-3 and both magnet polarities combined. |
Table_7.pdf [14 KiB] HiDef png [59 KiB] Thumbnail [26 KiB] tex code |

|
|
Results ($p$-values, in %) from tests with the $ D ^+ \rightarrow K ^- \pi ^+ \pi ^+ $ and $ D ^+_ s \rightarrow K ^- K ^+ \pi ^+ $ samples divided according to the impact parameter with respect to the primary vertex. The tests are performed using the adaptive binning scheme with 25 bins. |
Table_8.pdf [48 KiB] HiDef png [36 KiB] Thumbnail [17 KiB] tex code |

|
|
Fitted means and widths, $\chi^2/{\rm ndf}$ and $p$-values for consistency with no CPV for the $ D ^+ \rightarrow K ^- K ^+ \pi ^+ $ decay mode with four different binnings. |
Table_9.pdf [39 KiB] HiDef png [56 KiB] Thumbnail [26 KiB] tex code |

|
![HiDef png [47 KiB]](Directory_LHCb-PAPER-2011-017/hidef_Table_1.png)
![HiDef png [49 KiB]](Directory_LHCb-PAPER-2011-017/hidef_Table_2.png)
![HiDef png [102 KiB]](Directory_LHCb-PAPER-2011-017/hidef_Table_3.png)
![HiDef png [92 KiB]](Directory_LHCb-PAPER-2011-017/hidef_Table_4.png)
![HiDef png [63 KiB]](Directory_LHCb-PAPER-2011-017/hidef_Table_5.png)
![HiDef png [29 KiB]](Directory_LHCb-PAPER-2011-017/hidef_Table_6.png)
![HiDef png [59 KiB]](Directory_LHCb-PAPER-2011-017/hidef_Table_7.png)
![HiDef png [36 KiB]](Directory_LHCb-PAPER-2011-017/hidef_Table_8.png)
![HiDef png [56 KiB]](Directory_LHCb-PAPER-2011-017/hidef_Table_9.png)
Created on 27 April 2024.