Measurement of the cross-section ratio $\sigma(\chi_{c2})/\sigma(\chi_{c1})$ for prompt $\chi_c$ production at $\sqrt{s}=7$ TeV
[to restricted-access page]Information
LHCb-PAPER-2011-019
CERN-PH-EP-2011-227
arXiv:1202.1080 [PDF]
(Submitted on 06 Feb 2012)
Phys. Lett. B714 (2012) 215
Inspire 1087907
Tools
Abstract
The prompt production of the charmonium $\chi_{c1}$ and $\chi_{c2}$ mesons has been studied in proton-proton collisions at the Large Hadron Collider at a centre-of-mass energy of $\sqrt{s}=7$ TeV. The $\chi_c$ mesons are identified through their decays $\chi_c\to J/\psi \gamma$ with $J/\psi \to \mu^+ \mu^-$ using 36 $\mathrm{pb^{-1}}$ of data collected by the LHCb detector in 2010. The ratio of the prompt production cross-sections for the two $\chi_c$ spin states, $\sigma(\chi_{c2})/\sigma(\chi_{c1})$, has been determined as a function of the $J/\psi$ transverse momentum, $p_{\mathrm{T}}^{J/\psi}$, in the range from 2 to 15 GeV/$c$. The results are in agreement with the next-to-leading order non-relativistic QCD model at high $p_{\mathrm{T}}^{J/\psi}$ and lie consistently above the pure leading-order colour singlet prediction.
Figures and captions
|
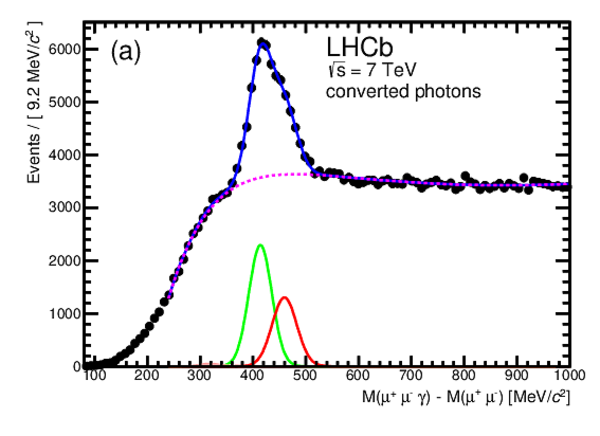
Distribution of $\Delta M {=} M\left(\mu ^+ \mu ^- \gamma\right) {-} M\left(\mu ^+ \mu ^- \right)$ for selected candidates with $ 3 {<} p_{\mathrm{T}}^{ { J \mskip -3mu/\mskip -2mu\psi \mskip 2mu} } {<} {15}\:{ {\mathrm{ Ge V /}c} }$ for (a) converted and (b) non-converted photons. The lower solid curves correspond to the $\chi _{ c 0}$ , $\chi _{ c 1}$ and $\chi _{ c 2}$ peaks from left to right, respectively (the $\chi _{ c 0}$ peak is barely visible). The background distribution is shown as a dashed curve. The upper solid curve corresponds to the overall fit function. |
Fig1a.pdf [16 KiB] HiDef png [209 KiB] Thumbnail [180 KiB] *.C file |
|
|
Fig1b.pdf [16 KiB] HiDef png [226 KiB] Thumbnail [193 KiB] *.C file |

|
|
|
Reconstruction and selection efficiency ratios in bins of $ p_{\mathrm{T}}^{ { J \mskip -3mu/\mskip -2mu\psi \mskip 2mu} }$ . The ratio of the $ { J \mskip -3mu/\mskip -2mu\psi \mskip 2mu}$ efficiency ( $\epsilon^{\chi _{ c 2} }_{ { J \mskip -3mu/\mskip -2mu\psi \mskip 2mu} } {/} \epsilon^{\chi _{ c 1} }_{ { J \mskip -3mu/\mskip -2mu\psi \mskip 2mu} }$ ) is shown with red circles. The ratio of the photon reconstruction and selection efficiency times the $\chi _{c}$ selection efficiency ( $\epsilon^{\chi _{ c 2} }_{\gamma}\epsilon^{\chi _{ c 2} }_{\mathrm{sel}} {/} \epsilon^{\chi _{ c 1} }_{\gamma}\epsilon^{\chi _{ c 1} }_{\mathrm{sel}}$ ) is shown with blue triangles. |
Fig2.pdf [15 KiB] HiDef png [135 KiB] Thumbnail [142 KiB] *.C file |

|
|
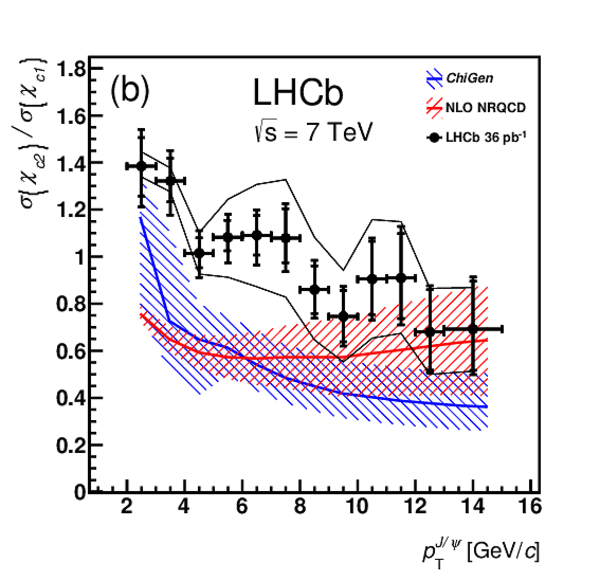
Ratio $\sigma(\chi _{ c 2} ) / \sigma(\chi _{ c 1} )$ in bins of $ 2 {<} p_{\mathrm{T}}^{ { J \mskip -3mu/\mskip -2mu\psi \mskip 2mu} } {<} {15}\:{ {\mathrm{ Ge V /}c} }$ . The LHCb results, in the rapidity range $ 2.0 {<} y^{ { J \mskip -3mu/\mskip -2mu\psi \mskip 2mu} } {<} 4.5$ and assuming the production of unpolarised $\chi _{c}$ mesons, are shown with solid black circles and the internal error bars correspond to the statistical error; the external error bars include the contribution from the systematic uncertainties (apart from the polarisation). The lines surrounding the data points show the maximum effect of the unknown $\chi _{c}$ \ polarisations on the result. The upper and lower limits correspond to the spin states as described in the text. The CDF data points, at $\sqrt{s} {=} {1.96}\:{\mathrm{ Te V} }$ in $ p\bar{p}$ collisions and in the $ { J \mskip -3mu/\mskip -2mu\psi \mskip 2mu}$ pseudo-rapidity range $ |\eta^{ { J \mskip -3mu/\mskip -2mu\psi \mskip 2mu} }|<1.0$ , are shown in (a) with open blue circles [6]. The two hatched bands in (b) correspond to the ChiGen Monte Carlo generator [15] and NLO NRQCD [3] predictions. |
Fig3a.pdf [7 KiB] HiDef png [177 KiB] Thumbnail [174 KiB] *.C file |

|
|
Fig3b.pdf [7 KiB] HiDef png [446 KiB] Thumbnail [296 KiB] *.C file |
|
|
|
Animated gif made out of all figures. |
PAPER-2011-019.gif Thumbnail |

|
![HiDef png [209 KiB]](Directory_LHCb-PAPER-2011-019/hidef_Fig1a.png)
![HiDef png [226 KiB]](Directory_LHCb-PAPER-2011-019/hidef_Fig1b.png)
![HiDef png [135 KiB]](Directory_LHCb-PAPER-2011-019/hidef_Fig2.png)
![HiDef png [177 KiB]](Directory_LHCb-PAPER-2011-019/hidef_Fig3a.png)
![HiDef png [446 KiB]](Directory_LHCb-PAPER-2011-019/hidef_Fig3b.png)
Tables and captions
|
Signal $\chi _{c}$ yields and fit quality from the fit to the converted and non-converted candidates in each $ p_{\mathrm{T}}^{ { J \mskip -3mu/\mskip -2mu\psi \mskip 2mu} }$ bin. |
Table_1.pdf [46 KiB] HiDef png [117 KiB] Thumbnail [55 KiB] tex code |

|
|
Polarisation weights in $ p_{\mathrm{T}}^{ { J \mskip -3mu/\mskip -2mu\psi \mskip 2mu} }$ bins for different combinations of $\chi _{ c 1}$ and $\chi _{ c 2}$ polarisation states $ |J,m_{\chi_{cJ}}\rangle$ with $ |m_{\chi_{cJ}}|=0,\cdots J$ . The polarisation axis is defined as the direction of the $\chi _{c}$ in the laboratory frame. Unpol. means the $\chi _{c}$ is unpolarised. |
Table_2.pdf [58 KiB] HiDef png [123 KiB] Thumbnail [55 KiB] tex code |

|
|
Summary of the systematic uncertainties (absolute values) on $\sigma(\chi _{ c 2} ) / \sigma(\chi _{ c 1} )$ \ in each $ p_{\mathrm{T}}^{ { J \mskip -3mu/\mskip -2mu\psi \mskip 2mu} }$ bin. |
Table_3.pdf [54 KiB] HiDef png [114 KiB] Thumbnail [51 KiB] tex code |

|
|
Ratio $\sigma(\chi _{ c 2} ) / \sigma(\chi _{ c 1} )$ in bins of $ p_{\mathrm{T}}^{ { J \mskip -3mu/\mskip -2mu\psi \mskip 2mu} }$ in the range $ 2 {<} p_{\mathrm{T}}^{ { J \mskip -3mu/\mskip -2mu\psi \mskip 2mu} } {<} {15}\:{ {\mathrm{ Ge V /}c} }$ and in the rapidity range $ 2.0 {<} y^{ { J \mskip -3mu/\mskip -2mu\psi \mskip 2mu} } {<} 4.5$ . The first error is the statistical error, the second is the systematic uncertainty (apart from the branching fraction and polarisation) and the third is due to the $\chi _{c} \rightarrow { J \mskip -3mu/\mskip -2mu\psi \mskip 2mu} \gamma$ branching fractions. Also given is the maximum effect of the unknown $\chi _{c}$ \ polarisations on the result as described in Sect. 3.2. |
Table_4.pdf [54 KiB] HiDef png [147 KiB] Thumbnail [75 KiB] tex code |

|
![HiDef png [117 KiB]](Directory_LHCb-PAPER-2011-019/hidef_Table_1.png)
![HiDef png [123 KiB]](Directory_LHCb-PAPER-2011-019/hidef_Table_2.png)
![HiDef png [114 KiB]](Directory_LHCb-PAPER-2011-019/hidef_Table_3.png)
![HiDef png [147 KiB]](Directory_LHCb-PAPER-2011-019/hidef_Table_4.png)
Created on 26 April 2024.