Differential branching fraction and angular analysis of the decay $B^{0} \rightarrow K^{*0} \mu^+ \mu^-$
[to restricted-access page]Information
LHCb-PAPER-2011-020
CERN-PH-EP-2011-211
arXiv:1112.3515 [PDF]
(Submitted on 15 Dec 2011)
Phys. Rev. Lett. 108 (2012) 181806
Inspire 1081581
Tools
Abstract
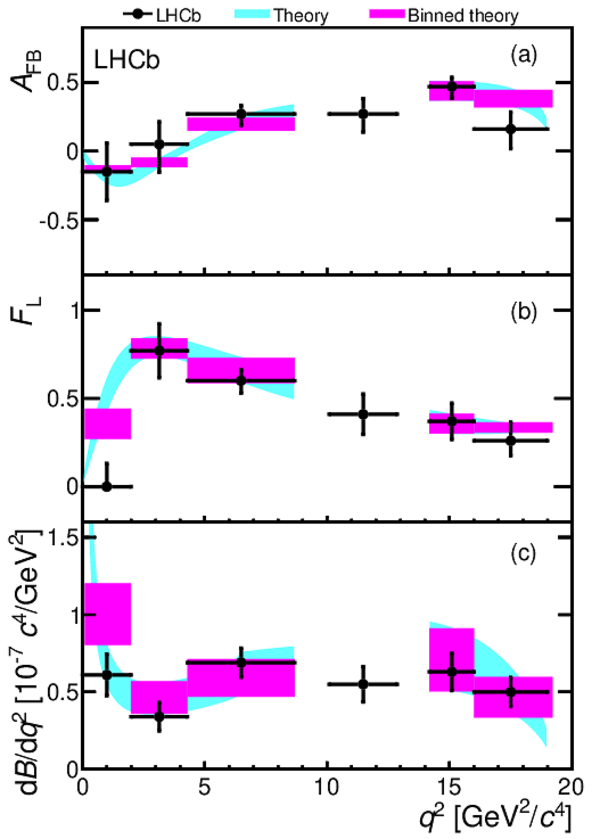
The angular distributions and the partial branching fraction of the decay $B^{0} \rightarrow K^{*0} \mu^+ \mu^-$ are studied using an integrated luminosity of $0.37 fb^{-1}$ of data collected with the LHCb detector. The forward-backward asymmetry of the muons, $A_{\mathrm{FB}}$, the fraction of longitudinal polarisation, $F_{\mathrm{L}}$, and the partial branching fraction, $\mathrm{d}{\mathcal B}/\mathrm{d}q^{2}$, are determined as a function of the dimuon invariant mass. The measurements are in good agreement with the Standard Model predictions and are the most precise to date. In the dimuon invariant mass squared range $1.00-6.00{\mathrm{ Ge V}}^2/c^4$, the results are $A_{\mathrm{FB}}=-0.06 ^{+0.13}_{-0.14} \pm 0.04$, $F_{\mathrm{L}}=0.55\pm 0.10\pm 0.03$ and $\mathrm{d}{\mathcal B}/\mathrm{d}q^{2}=(0.42 \pm 0.06\pm 0.03) \times 10^{-7}c^4/{\mathrm{ Ge V}}^2$. In each case, the first error is statistical and the second systematic.
Figures and captions
|
$K^+\pi^-\mu ^+ \mu ^- $ invariant mass distribution after the application of the full selection as data points with the fit overlaid. The signal component is the green (light) line, the background the red (dashed) line and the full distribution the blue (dark) line. |
Fig1.pdf [18 KiB] HiDef png [208 KiB] Thumbnail [172 KiB] *.C file |

|
|
$ A_{\mathrm{FB}}$ , $ F_{\mathrm{L}}$ and $\mathrm{d}\cal B /\mathrm{d}q^{2}$ as a function of $q^{2}$. The SM prediction is given by the cyan (light) band, and this prediction rate-averaged across the $ q^2$ bins is indicated by the purple (dark) regions. No SM prediction is shown for the region between the two regimes in which the theoretical calculations are made (see text). |
Fig2.pdf [26 KiB] HiDef png [211 KiB] Thumbnail [190 KiB] *.C file |
|
|
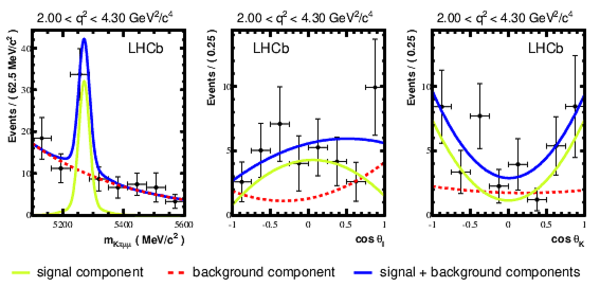
Fit projections for $m_{K\pi\mu\mu}$, $\cos{\theta_l}$ and $\cos{\theta_K}$ for the $ q^2$ bins: $0.10 < q^{2} < 2.00$, $2.00 < q^{2} < 4.30$ and $4.30 < q^{2} < 8.68\mathrm{ Ge V} ^{2}/c^4$. |
fits_f[..].pdf [11 KiB] HiDef png [269 KiB] Thumbnail [163 KiB] *.C file |

|
|
fits_f[..].pdf [11 KiB] HiDef png [278 KiB] Thumbnail [167 KiB] *.C file |
|
|
|
fits_f[..].pdf [11 KiB] HiDef png [268 KiB] Thumbnail [160 KiB] *.C file |

|
|
|
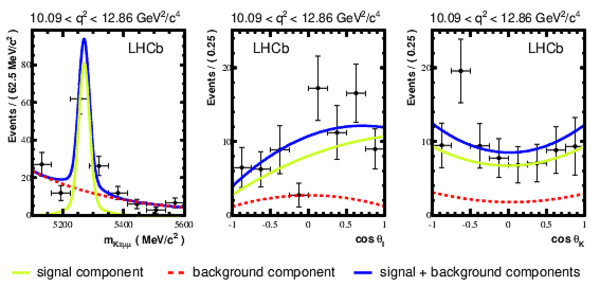
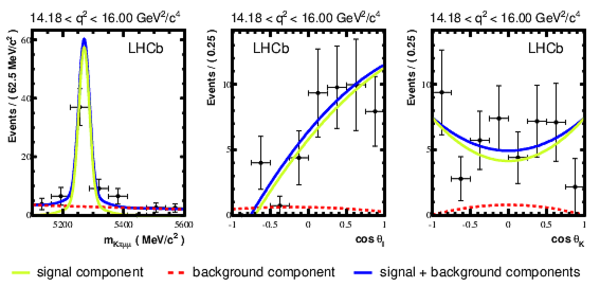
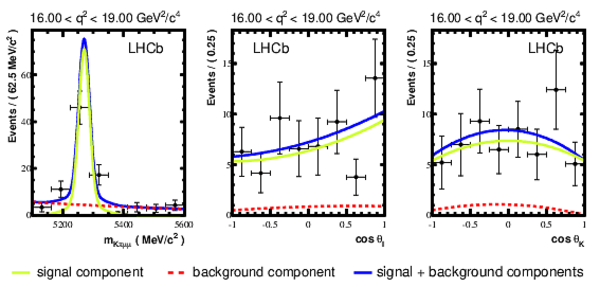
Fit projections for $m_{K\pi\mu\mu}$, $\cos{\theta_l}$ and $\cos{\theta_K}$ for the $ q^2$ bins: $10.09 < q^{2} < 12.86$, $14.18 < q^{2} < 16.00$ and $16.00 < q^{2} < 19.00\mathrm{ Ge V} ^{2}/c^4$. |
fits_f[..].pdf [11 KiB] HiDef png [267 KiB] Thumbnail [164 KiB] *.C file |
|
|
fits_f[..].pdf [11 KiB] HiDef png [267 KiB] Thumbnail [158 KiB] *.C file |
|
|
|
fits_f[..].pdf [11 KiB] HiDef png [264 KiB] Thumbnail [161 KiB] *.C file |
|
|
|
Animated gif made out of all figures. |
PAPER-2011-020.gif Thumbnail |

|
![HiDef png [208 KiB]](Directory_LHCb-PAPER-2011-020/hidef_Fig1.png)
![HiDef png [211 KiB]](Directory_LHCb-PAPER-2011-020/hidef_Fig2.png)
![HiDef png [269 KiB]](Directory_LHCb-PAPER-2011-020/hidef_fits_for_bin_0.png)
![HiDef png [278 KiB]](Directory_LHCb-PAPER-2011-020/hidef_fits_for_bin_1.png)
![HiDef png [268 KiB]](Directory_LHCb-PAPER-2011-020/hidef_fits_for_bin_2.png)
![HiDef png [267 KiB]](Directory_LHCb-PAPER-2011-020/hidef_fits_for_bin_3.png)
![HiDef png [267 KiB]](Directory_LHCb-PAPER-2011-020/hidef_fits_for_bin_4.png)
![HiDef png [264 KiB]](Directory_LHCb-PAPER-2011-020/hidef_fits_for_bin_5.png)
Tables and captions
|
Central values with statistical and systematic uncertainties for $ A_{\mathrm{FB}}$ , $ F_{\mathrm{L}}$ and $\mathrm{d}\cal B /\mathrm{d}q^{2}$ as a function of $ q^2$ . The $ B ^0 \rightarrow K ^{*0} \mu ^+ \mu ^- $ signal and background yields in the $\pm50 {\mathrm{ Me V /}c^2} $ signal mass window with their statistical uncertainties are also indicated, together with the statistical significance of the signal peak that is observed. \\ |
Table_1.pdf [56 KiB] HiDef png [79 KiB] Thumbnail [34 KiB] tex code |

|
![HiDef png [79 KiB]](Directory_LHCb-PAPER-2011-020/hidef_Table_1.png)
Created on 27 April 2024.