Measurement of the CP-violating phase $\phi_s$ in the decay $B^{0}_s \to J/\psi \phi$
[to restricted-access page]Information
LHCb-PAPER-2011-021
CERN-PH-EP-2011-214
arXiv:1112.3183 [PDF]
(Submitted on 14 Dec 2011)
Phys. Rev. Lett. 108 (2012) 101803
Inspire 1081275
Tools
Abstract
We present a measurement of the time-dependent CP-violating asymmetry in B_s -> J/psi phi decays, using data collected with the LHCb detector at the LHC. The decay time distribution of B_s -> J/psi phi is characterized by the decay widths Gamma_H and Gamma_L of the heavy and light mass eigenstates of the B_s-B_s-bar system and by a CP-violating phase phi_s. In a sample of about 8500 B_s -> J/psi phi events isolated from 0.37 fb^-1 of pp collisions at sqrt(s)=7 TeV we measure phi_s = 0.15 +/- 0.18 (stat) +/- 0.06 (syst) rad. We also find an average B_s decay width Gamma_s == (Gamma_L + Gamma_H)/2 = 0.657 +/- 0.009 (stat) +/- 0.008 (syst) ps^-1 and a decay width difference Delta Gamma_s == Gamma_L - Gamma_H} = 0.123 +/- 0.029 (stat) +/- 0.011 (syst) ps^-1. Our measurement is insensitive to the transformation (phi_s,DeltaGamma_s --> pi - phi_s, - Delta Gamma_s.
Figures and captions
|
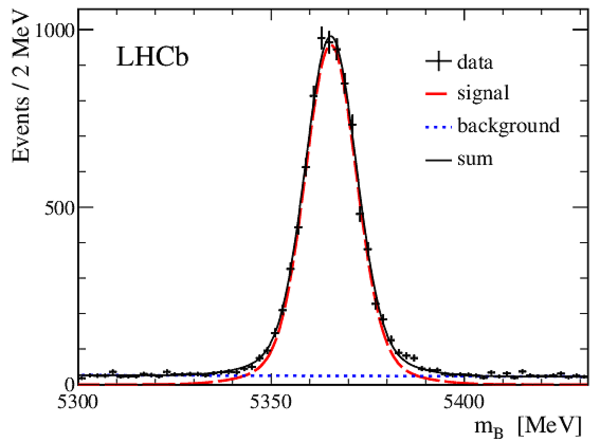
Invariant mass distribution for $ B ^0_s \to\mu^+\mu^- K^+K^-$ candidates with the mass of the $\mu^+\mu^-$ pair constrained to the nominal $J/\psi$ mass. Curves for fitted contributions from signal (dashed), background (dotted) and their sum (solid) are overlaid. |
fig1.pdf [11 KiB] HiDef png [166 KiB] Thumbnail [133 KiB] *.C file |
|
|
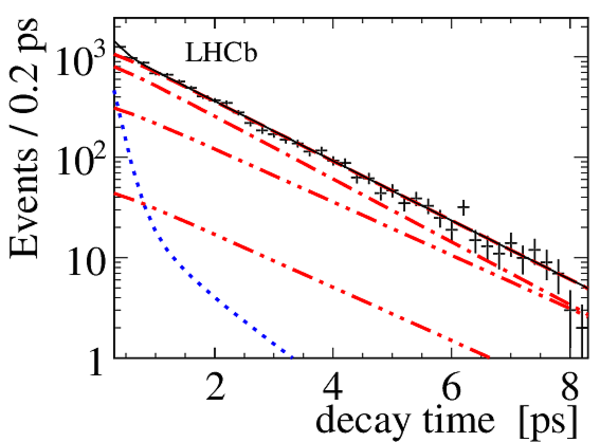
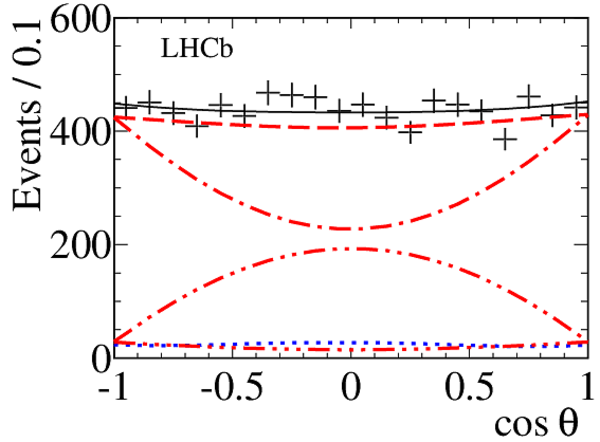
Projections for the decay time and transversity angle distributions for events with $m_B$ in a $\pm 20$ $\mathrm{ Me V}$ {} range around the $ B ^0_s$ {} mass. The points are the data. The dashed, dotted and solid lines represent the fitted contributions from signal, background and their sum. The remaining curves correspond to different contributions to the signal, namely the $ C P$ -even P-wave (dashed with single dot), the $ C P$ -odd P-wave (dashed with double dot) and the S-wave (dashed with triple dot). |
fig2a.pdf [7 KiB] HiDef png [204 KiB] Thumbnail [173 KiB] *.C file |
|
|
fig2b.pdf [5 KiB] HiDef png [181 KiB] Thumbnail [154 KiB] *.C file |
|
|
|
fig2c.pdf [5 KiB] HiDef png [189 KiB] Thumbnail [169 KiB] *.C file |

|
|
|
fig2d.pdf [5 KiB] HiDef png [189 KiB] Thumbnail [162 KiB] *.C file |

|
|
|
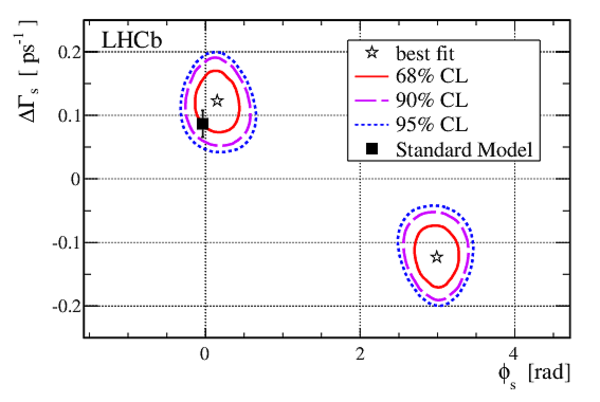
Likelihood confidence regions in the $\Delta\Gamma_{s}$-$\phi_s$ plane. The black square and error bar corresponds to the Standard Model prediction [10,7]. |
fig3.pdf [6 KiB] HiDef png [198 KiB] Thumbnail [155 KiB] *.C file |
|
|
Animated gif made out of all figures. |
PAPER-2011-021.gif Thumbnail |

|
![HiDef png [166 KiB]](Directory_LHCb-PAPER-2011-021/hidef_fig1.png)
![HiDef png [204 KiB]](Directory_LHCb-PAPER-2011-021/hidef_fig2a.png)
![HiDef png [181 KiB]](Directory_LHCb-PAPER-2011-021/hidef_fig2b.png)
![HiDef png [189 KiB]](Directory_LHCb-PAPER-2011-021/hidef_fig2c.png)
![HiDef png [189 KiB]](Directory_LHCb-PAPER-2011-021/hidef_fig2d.png)
![HiDef png [198 KiB]](Directory_LHCb-PAPER-2011-021/hidef_fig3.png)
Tables and captions
|
Fit results for the solution with $\Delta\Gamma_{s}>0$ with statistical and systematic uncertainties. \\ |
Table_1.pdf [52 KiB] HiDef png [49 KiB] Thumbnail [23 KiB] tex code |

|
![HiDef png [49 KiB]](Directory_LHCb-PAPER-2011-021/hidef_Table_1.png)
Created on 27 April 2024.