Measurements of the branching fractions and $C P$ asymmetries of $B^{\pm} \to J / \psi \pi^{\pm}$ and $B^{\pm} \to \psi(2S) \pi^{\pm}$ decays
[to restricted-access page]Information
LHCb-PAPER-2011-024
CERN-PH-EP-2012-070
arXiv:1203.3592 [PDF]
(Submitted on 16 Mar 2012)
Phys. Rev. D85 (2012) 091105(R)
Inspire 1094045
Tools
Abstract
A study of B+ to J/psi pi+ and B+ to psi(2S) pi+ decays is performed with data corresponding to 0.37 fb-1 of proton-proton collisions at sqrt(s)=7 TeV. Their branching fractions are found to be B(B+ to J/psi pi+) = (3.88 +- 0.11 +- 0.15) x 10^{-5} and B(B+ to psi(2S) pi+) = (2.52 +- 0.26 +- 0.15) x 10^{-5}, where the first uncertainty is related to the statistical size of the sample and the second quantifies systematic effects. The measured CP asymmetries in these modes are ACP(J/psi pi) = 0.005 +- 0.027 +- 0.011 and ACP(psi(2S) pi) = 0.048 +- 0.090 +- 0.011 with no evidence of direct CP violation seen.
Figures and captions
|
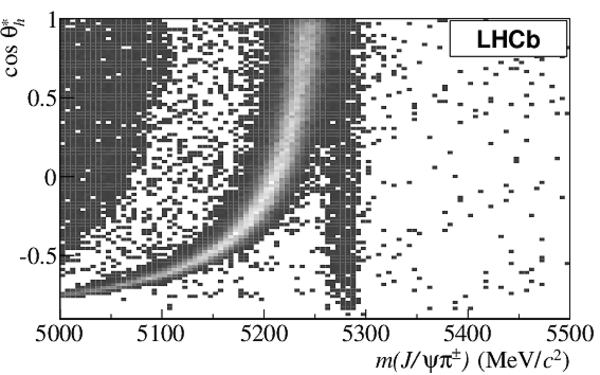
Distribution of $\cos(\theta^*_h)$ versus the invariant mass of $ B ^+ \rightarrow { J \mskip -3mu/\mskip -2mu\psi \mskip 2mu} \pi ^+ $ candidates. The curved structure contains misidentified $ B ^+ \rightarrow { J \mskip -3mu/\mskip -2mu\psi \mskip 2mu} K ^+ $ decays which separate from the $ B ^+ \rightarrow { J \mskip -3mu/\mskip -2mu\psi \mskip 2mu} \pi ^+ $ vertical band for $\cos(\theta^*_h)<0$. The partially reconstructed background, $B\rightarrow { J \mskip -3mu/\mskip -2mu\psi \mskip 2mu} K\pi$ enters top left. |
Fig1.eps [114 KiB] HiDef png [320 KiB] Thumbnail [204 KiB] *.C file |
|
|
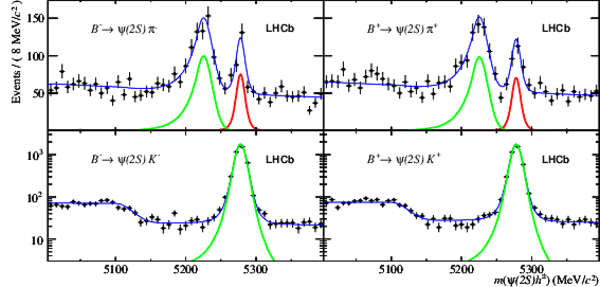
Distributions of $ B ^\pm \rightarrow { J \mskip -3mu/\mskip -2mu\psi \mskip 2mu} h^{\pm}$ invariant mass, overlain by the total fitted PDF (thin line). Pion-like events, with DLL$_{K\pi}<6$ are reconstructed as $ { J \mskip -3mu/\mskip -2mu\psi \mskip 2mu} \pi ^\pm $ and enter in the top plots. All other events are reconstructed as $ { J \mskip -3mu/\mskip -2mu\psi \mskip 2mu} K ^\pm $ and are shown in the bottom plots on a logarithmic scale. $ B ^- $ decays are shown on the left, $ B ^+ $ on the right. The dark [red] curve shows the $ B ^\pm \rightarrow { J \mskip -3mu/\mskip -2mu\psi \mskip 2mu} \pi ^\pm $ component, the light [green] curve represents $ B ^\pm \rightarrow { J \mskip -3mu/\mskip -2mu\psi \mskip 2mu} K ^\pm $. The partially reconstructed contributions are shaded. In the lower plots these are visualised with a dark (light) shade for $ B ^0_ s $ ( $ B ^+$ or $ B ^0$ ) decays. In the top plots the shaded component are contributions from $ B \rightarrow { J \mskip -3mu/\mskip -2mu\psi \mskip 2mu} K ^\pm \pi$ (dark) and $ B \rightarrow { J \mskip -3mu/\mskip -2mu\psi \mskip 2mu} \pi ^\pm \pi$ (light). |
Fig2.eps [46 KiB] HiDef png [474 KiB] Thumbnail [174 KiB] *.C file |

|
|
Distributions of $ B ^\pm \rightarrow \psi {(2S)} h^{\pm}$ invariant mass. See the caption of Fig. 2 for details. The partially reconstructed background in the pion-like sample is present but negligible yields are found. |
Fig3.eps [43 KiB] HiDef png [369 KiB] Thumbnail [187 KiB] *.C file |
|
|
Animated gif made out of all figures. |
PAPER-2011-024.gif Thumbnail |

|
![HiDef png [320 KiB]](Directory_LHCb-PAPER-2011-024/hidef_Fig1.png)
![HiDef png [474 KiB]](Directory_LHCb-PAPER-2011-024/hidef_Fig2.png)
![HiDef png [369 KiB]](Directory_LHCb-PAPER-2011-024/hidef_Fig3.png)
Tables and captions
|
Signal shape parameters from the $ B ^\pm \rightarrow \psi h^{\pm}$ fits. |
Table_1.pdf [43 KiB] HiDef png [59 KiB] Thumbnail [29 KiB] tex code |

|
|
Raw fitted yields. The labels `D' and `U' refer to the two polarities of the LHCb dipole. |
Table_2.pdf [41 KiB] HiDef png [78 KiB] Thumbnail [40 KiB] tex code |

|
|
Summary of systematic uncertainties. The statistical fit errors are included for comparison. |
Table_3.pdf [57 KiB] HiDef png [74 KiB] Thumbnail [30 KiB] tex code |

|
![HiDef png [59 KiB]](Directory_LHCb-PAPER-2011-024/hidef_Table_1.png)
![HiDef png [78 KiB]](Directory_LHCb-PAPER-2011-024/hidef_Table_2.png)
![HiDef png [74 KiB]](Directory_LHCb-PAPER-2011-024/hidef_Table_3.png)
Created on 27 April 2024.