Search for the rare decays $B^0_s \to \mu^+\mu^-$ and $B^0 \to \mu^+\mu^-$
[to restricted-access page]Information
LHCb-PAPER-2011-025
CERN-PH-EP-2011-186
arXiv:1112.1600 [PDF]
(Submitted on 07 Dec 2011)
Phys. Lett. B708 (2012) 55
Inspire 1080385
Tools
Abstract
A search for the decays Bs -> mu+ mu- and B0 -> mu+ mu- is performed with 0.37 fb^-1 of pp collisions at sqrt{s} = 7 TeV collected by the LHCb experiment in 2011. The upper limits on the branching fractions are BR (Bs -> mu+ mu-) < 1.6 x 10^-8 and BR(B0 -> mu+ mu-) < 3.6 x 10^-9 at 95 confidence level. A combination of these results with the LHCb limits obtained with the 2010 dataset leads to BR (Bs -> mu+ mu-) < 1.4 x 10^-8 and BR (B0 -> mu+ mu-) < 3.2 x 10^-9 at 95 confidence level.
Figures and captions
|
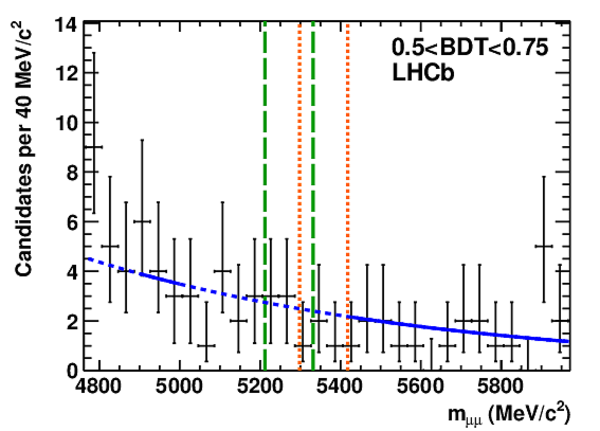
Distribution of the $\mu^+\mu^-$ invariant mass for events in each BDT output bin. The curve shows the model used to fit the sidebands and extract the expected number of combinatorial background events in the $ B ^0_s$ and $ B ^0$ signal regions, delimited by the vertical dotted orange and dashed green lines respectively. Only events in the region in which the line is solid have been considered in the fit. |
Fig1a.pdf [18 KiB] HiDef png [207 KiB] Thumbnail [208 KiB] *.C file |

|
|
Fig1b.pdf [17 KiB] HiDef png [201 KiB] Thumbnail [208 KiB] *.C file |

|
|
|
Fig1c.pdf [17 KiB] HiDef png [192 KiB] Thumbnail [194 KiB] *.C file |
|
|
|
Fig1d.pdf [17 KiB] HiDef png [181 KiB] Thumbnail [177 KiB] *.C file |

|
|
|
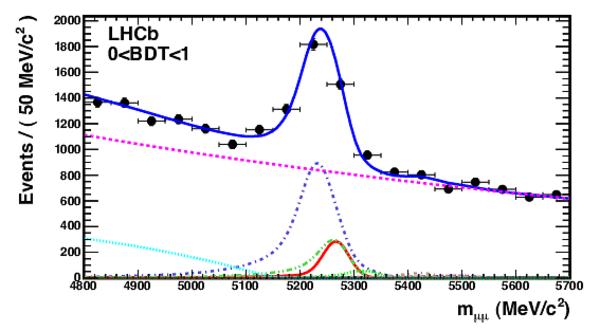
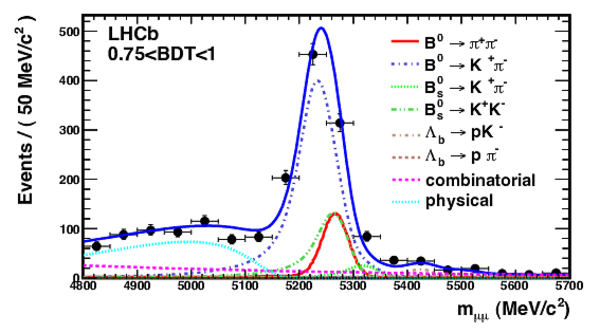
Invariant mass distributions of $ B^0_{(s)}\rightarrow h^+h^{'-}$ candidates in the $\mu^+\mu^-$ mass hypothesis for the whole sample (top left) and for the samples in the three highest bins of the BDT output (top right, bottom left, bottom right). The $ B^0_{(s)}\rightarrow h^+h^{'-}$ exclusive decays, the combinatorial background and the physical background components are drawn under the fit to the data (solid blue line). |
Fig2a.pdf [26 KiB] HiDef png [258 KiB] Thumbnail [179 KiB] *.C file |
|
|
Fig2b.pdf [26 KiB] HiDef png [250 KiB] Thumbnail [176 KiB] *.C file |

|
|
|
Fig2c.pdf [26 KiB] HiDef png [268 KiB] Thumbnail [177 KiB] *.C file |

|
|
|
Fig2d.pdf [32 KiB] HiDef png [303 KiB] Thumbnail [211 KiB] *.C file |
|
|
|
BDT probability distribution functions of signal events (solid squares) and combinatorial background (open circles): the PDF for the signal is obtained from the inclusive sample of TIS $ B^0_{(s)}\rightarrow h^+h^{'-}$ events, the PDF for the combinatorial background is obtained from the events in the mass sidebands. |
Fig3.png [10 KiB] HiDef png [82 KiB] Thumbnail [41 KiB] *.C file |

|
|
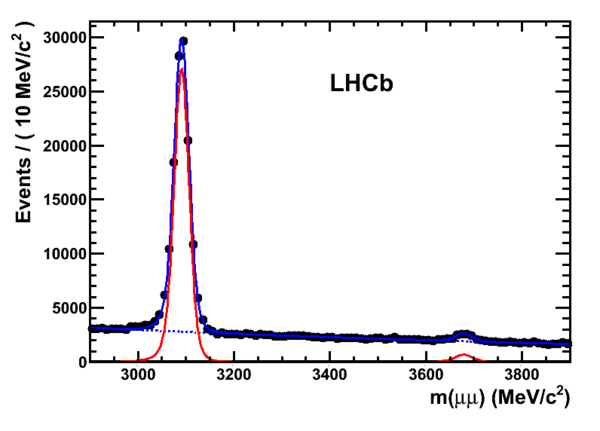
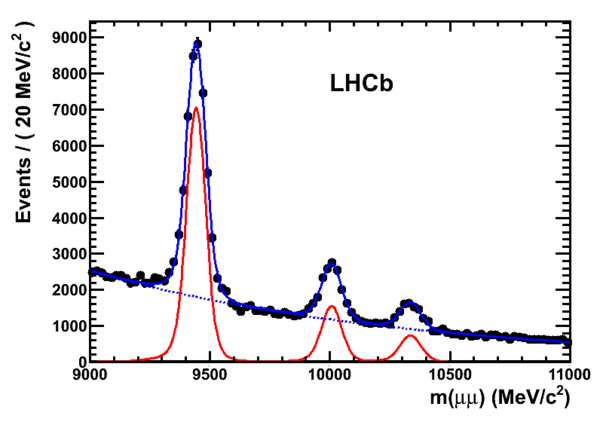
Di-muon invariant mass spectrum in the ranges (2.9 -- 3.9) $ {\mathrm{ Ge V /}c^2}$ (left) and (9--11) $ {\mathrm{ Me V /}c^2}$ (right). |
Fig4a.png [17 KiB] HiDef png [106 KiB] Thumbnail [52 KiB] *.C file |
|
|
Fig4b.png [21 KiB] HiDef png [137 KiB] Thumbnail [67 KiB] *.C file |
|
|
|
Invariant mass distributions of the $ B^+\rightarrow J/\psi K^+$ (left) and $ B^0_s\rightarrow J/\psi \phi$ (right) candidates used in the normalization procedure. |
Fig5a.pdf [39 KiB] HiDef png [184 KiB] Thumbnail [151 KiB] *.C file |

|
|
Fig5b.pdf [39 KiB] HiDef png [171 KiB] Thumbnail [146 KiB] *.C file |

|
|
|
Distribution of selected di-muon events in the invariant mass--BDT plane. The orange short-dashed (green long-dashed) lines indicate the $\pm 60 {\mathrm{ Me V /}c^2} $ search window around the mean $ B ^0_s$ ( $ B ^0$ ) mass. |
Fig6.pdf [1000 KiB] HiDef png [405 KiB] Thumbnail [274 KiB] *.C file |

|
|
Distribution of selected di-muon events in the $ B ^0_s \rightarrow \mu^+\mu^-$ mass window for the four BDT output bins. The black dots are data, the light grey histogram shows the contribution of the combinatorial background, the black filled histogram shows the contribution of the $ B^0_{(s)}\rightarrow h^+h^{'-}$ background and the dark grey filled histogram the contribution of $ B ^0_s \rightarrow \mu^+\mu^-$ signal events according to the SM rate. The hatched area depicts the uncertainty on the sum of the expected contributions. |
Fig7_new.pdf [21 KiB] HiDef png [301 KiB] Thumbnail [166 KiB] *.C file |

|
|
Distribution of selected di-muon events in the $ B ^0 \rightarrow \mu^+\mu^-$ mass window for the four BDT output bins. The black dots are data, the light grey histogram shows the contribution of the combinatorial background, the black filled histogram shows the contribution of the $ B^0_{(s)}\rightarrow h^+h^{'-}$ background and the dark grey filled histogram shows the cross-feed of $ B ^0_s \rightarrow \mu^+\mu^-$ events in the $ B ^0$ mass window assuming the the SM rate. The hatched area depicts the uncertainty on the sum of the expected contributions. |
Fig8_new.pdf [21 KiB] HiDef png [309 KiB] Thumbnail [171 KiB] *.C file |

|
|
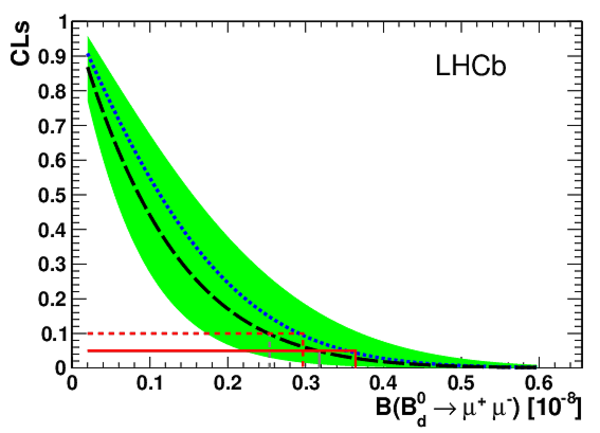
$\textrm{CL}_{\textrm{s}}$ as a function of the assumed $\cal B$ . Expected (observed) values are shown by dashed black (dotted blue) lines. The expected $\textrm{CL}_{\textrm{s}}$ values have been computed assuming a signal yield corresponding to the SM branching fractions. The green (grey) shaded areas cover the region of $\pm 1 \sigma$ of compatible observations. The measured upper limits at 90% and 95% CL are also shown. Left: $ B ^0_s \rightarrow \mu^+\mu^-$ , right: $ B ^0 \rightarrow \mu^+\mu^-$ . |
Fig9a.pdf [19 KiB] HiDef png [158 KiB] Thumbnail [145 KiB] *.C file |

|
|
Fig9b.pdf [19 KiB] HiDef png [162 KiB] Thumbnail [150 KiB] *.C file |
|
|
|
Animated gif made out of all figures. |
PAPER-2011-025.gif Thumbnail |

|
![HiDef png [207 KiB]](Directory_LHCb-PAPER-2011-025/hidef_Fig1a.png)
![HiDef png [201 KiB]](Directory_LHCb-PAPER-2011-025/hidef_Fig1b.png)
![HiDef png [192 KiB]](Directory_LHCb-PAPER-2011-025/hidef_Fig1c.png)
![HiDef png [181 KiB]](Directory_LHCb-PAPER-2011-025/hidef_Fig1d.png)
![HiDef png [258 KiB]](Directory_LHCb-PAPER-2011-025/hidef_Fig2a.png)
![HiDef png [250 KiB]](Directory_LHCb-PAPER-2011-025/hidef_Fig2b.png)
![HiDef png [268 KiB]](Directory_LHCb-PAPER-2011-025/hidef_Fig2c.png)
![HiDef png [303 KiB]](Directory_LHCb-PAPER-2011-025/hidef_Fig2d.png)
![Fig3.png [10 KiB]](Directory_LHCb-PAPER-2011-025/Fig3.png)
![HiDef png [82 KiB]](Directory_LHCb-PAPER-2011-025/hidef_Fig3.png)
![Fig4a.png [17 KiB]](Directory_LHCb-PAPER-2011-025/Fig4a.png)
![HiDef png [106 KiB]](Directory_LHCb-PAPER-2011-025/hidef_Fig4a.png)
![Fig4b.png [21 KiB]](Directory_LHCb-PAPER-2011-025/Fig4b.png)
![HiDef png [137 KiB]](Directory_LHCb-PAPER-2011-025/hidef_Fig4b.png)
![HiDef png [184 KiB]](Directory_LHCb-PAPER-2011-025/hidef_Fig5a.png)
![HiDef png [171 KiB]](Directory_LHCb-PAPER-2011-025/hidef_Fig5b.png)
![HiDef png [405 KiB]](Directory_LHCb-PAPER-2011-025/hidef_Fig6.png)
![HiDef png [301 KiB]](Directory_LHCb-PAPER-2011-025/hidef_Fig7_new.png)
![HiDef png [309 KiB]](Directory_LHCb-PAPER-2011-025/hidef_Fig8_new.png)
![HiDef png [158 KiB]](Directory_LHCb-PAPER-2011-025/hidef_Fig9a.png)
![HiDef png [162 KiB]](Directory_LHCb-PAPER-2011-025/hidef_Fig9b.png)
Tables and captions
|
Summary of the quantities and their uncertainties required to calculate the normalization factors ($\alpha^{\rm norm}_{ B^0_{(s)}\rightarrow \mu^+\mu^- }$) for the three normalization channels considered. The branching fractions are taken from Refs. [19,24]. The trigger efficiency and the number of $ B ^0 \rightarrow K^+\pi^-$ candidates correspond to TIS events. |
Table_1.pdf [75 KiB] HiDef png [43 KiB] Thumbnail [18 KiB] tex code |

|
|
Expected combinatorial background events, expected peaking ( $ B^0_{(s)}\rightarrow h^+h^{'-}$ ) background events, expected signal events assuming the SM branching fraction prediction, and observed events in the $ B ^0_s \rightarrow \mu^+\mu^-$ search window. |
Table_2.pdf [50 KiB] HiDef png [244 KiB] Thumbnail [101 KiB] tex code |

|
|
Expected combinatorial background events, expected peaking ( $ B^0_{(s)}\rightarrow h^+h^{'-}$ ) background events, expected $ B ^0 \rightarrow \mu ^+ \mu ^- $ signal events assuming the SM branching fraction , expected cross-feed events from $ B ^0_s \rightarrow \mu^+\mu^-$ assuming the SM branching fraction and observed events in the $ B ^0 \rightarrow \mu^+\mu^-$ search window. |
Table_3.pdf [51 KiB] HiDef png [297 KiB] Thumbnail [119 KiB] tex code |

|
|
Expected and observed limits on the $ B ^0_s \rightarrow \mu^+\mu^-$ branching fraction for the 2011 data and for the combination of 2010 and 2011 data. The expected limits are computed allowing the presence of $ B ^0_s \rightarrow \mu^+\mu^-$ events according to the SM branching fraction. |
Table_4.pdf [43 KiB] HiDef png [47 KiB] Thumbnail [19 KiB] tex code |

|
|
Expected and observed limits on the $ B ^0 \rightarrow \mu^+\mu^-$ branching fraction for 2011 data and for the combination of 2010 and 2011 data. The expected limits are computed in the background only hypothesis. |
Table_5.pdf [44 KiB] HiDef png [49 KiB] Thumbnail [21 KiB] tex code |

|
![HiDef png [43 KiB]](Directory_LHCb-PAPER-2011-025/hidef_Table_1.png)
![HiDef png [244 KiB]](Directory_LHCb-PAPER-2011-025/hidef_Table_2.png)
![HiDef png [297 KiB]](Directory_LHCb-PAPER-2011-025/hidef_Table_3.png)
![HiDef png [47 KiB]](Directory_LHCb-PAPER-2011-025/hidef_Table_4.png)
![HiDef png [49 KiB]](Directory_LHCb-PAPER-2011-025/hidef_Table_5.png)
Created on 27 April 2024.