Information
LHCb-PAPER-2011-027
CERN-PH-EP-2012-039
arXiv:1202.4979 [PDF]
(Submitted on 22 Feb 2012)
Eur. Phys. J. C72 (2012) 2022
Inspire 1090061
Tools
Abstract
The calibration and performance of the opposite-side flavour tagging algorithms used for the measurements of time-dependent asymmetries at the LHCb experiment are described. The algorithms have been developed using simulated events and optimized and calibrated with B+ -> J/psi K+, B0 -> J/psi K*0 and B0 -> D*- mu+ nu_mu decay modes with 0.37 fb^-1 of data collected in pp collisions at sqrt(s) = 7 TeV during the 2011 physics run. The opposite-side tagging power is determined in the B+ -> J/psi K+ channel to be (2.10 +- 0.08 +- 0.24) , where the first uncertainty is statistical and the second is systematic.
Figures and captions
|
Mass distribution of OS tagged $ B ^+ \rightarrow { J \mskip -3mu/\mskip -2mu\psi \mskip 2mu} K ^+ $ events. Black points are data, the solid blue line, red dotted line and green area are the overall fit, the signal and the background components, respectively. |
Fig1.pdf [34 KiB] HiDef png [209 KiB] Thumbnail [171 KiB] *.C file |

|
|
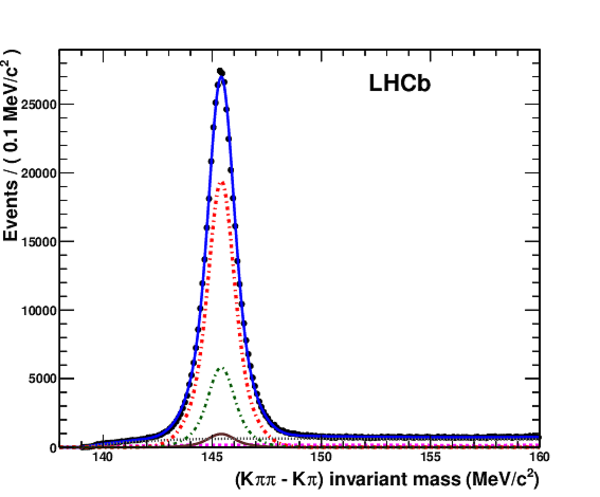
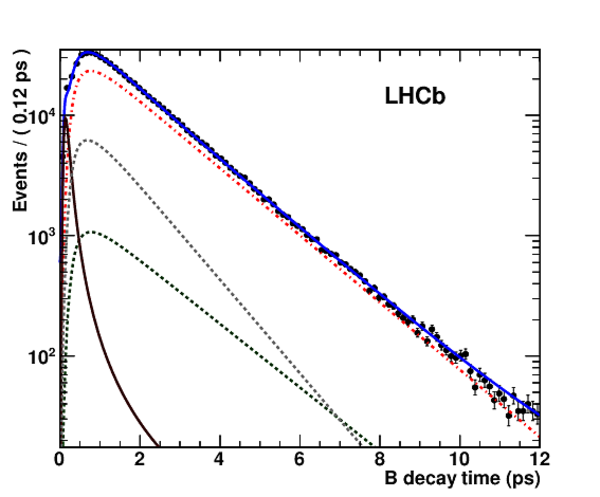
Distributions of (a) $K^+\pi^-$ invariant mass, (b) mass difference $m(K\pi\pi)$$-$$m(K\pi)$ and (c) decay time of the $ B ^0 \rightarrow D ^{*-} \mu ^+ \nu _\mu $ events. Black points with errors are data, the blue curve is the fit result. The other lines represent signal (red dot-dashed), $\overline{ D }{} ^0$ -from-$B$ decay background (gray dashed), $ B ^+$ background (green short dashed), $D^*$ prompt background (magenta solid). The combinatorial background is the magenta filled area. |
Fig2a.pdf [25 KiB] HiDef png [274 KiB] Thumbnail [183 KiB] *.C file |

|
|
Fig2b.pdf [37 KiB] HiDef png [245 KiB] Thumbnail [166 KiB] *.C file |
|
|
|
Fig2c.pdf [28 KiB] HiDef png [527 KiB] Thumbnail [178 KiB] *.C file |
|
|
|
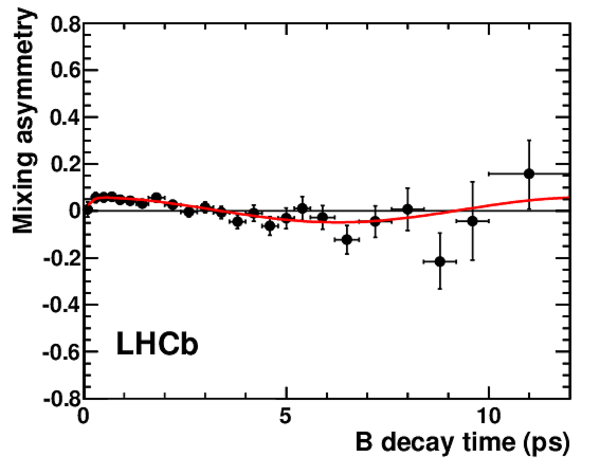
Raw mixing asymmetry of $ B ^0 \rightarrow D ^{*-} \mu ^+ \nu _\mu $ events in the signal mass region when using the combination of all OS taggers. Black points are data and the red solid line is the result of the fit. The lower plot shows the pulls of the residuals with respect to the fit. |
Fig3.pdf [9 KiB] HiDef png [173 KiB] Thumbnail [171 KiB] *.C file |

|
|
Mass distribution of OS tagged $ B ^0 \rightarrow { J \mskip -3mu/\mskip -2mu\psi \mskip 2mu} K ^{*0} $ events. Black points are data, the solid blue line, red dotted line and green area are the overall fit, the signal and the background components, respectively. |
Fig4.pdf [18 KiB] HiDef png [201 KiB] Thumbnail [175 KiB] *.C file |

|
|
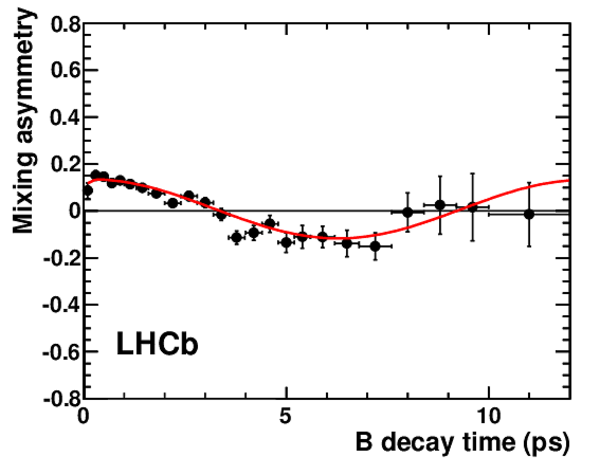
Raw mixing asymmetry of the $ B ^0 \rightarrow { J \mskip -3mu/\mskip -2mu\psi \mskip 2mu} K ^{*0} $ events in the signal mass region, for all OS tagged events. Black points are data and the red solid line is the result of the fit. The lower plot shows the pulls of the residuals with respect to the fit. |
Fig5.pdf [6 KiB] HiDef png [160 KiB] Thumbnail [152 KiB] *.C file |

|
|
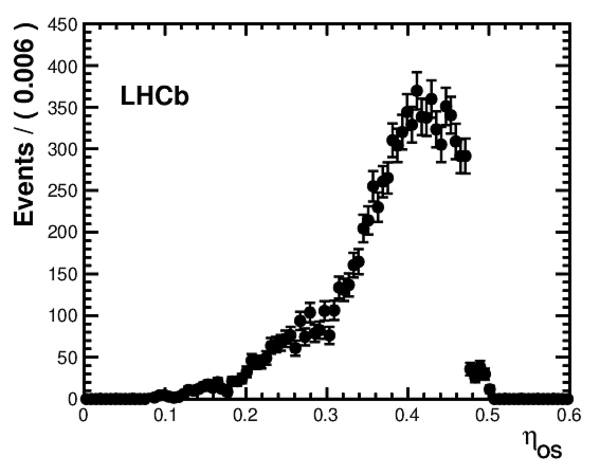
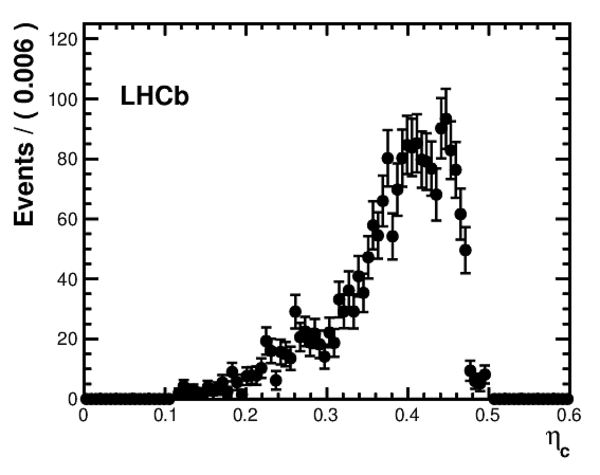
Distribution of the calibrated mistag probability for the single OS taggers and their combination for $ B ^+ \rightarrow { J \mskip -3mu/\mskip -2mu\psi \mskip 2mu} K ^+ $ events selected in a $\pm24$ $ {\mathrm{ Me V /}c^2}$ mass window around the $ B ^+$ mass. |
Fig6.pdf [34 KiB] HiDef png [525 KiB] Thumbnail [263 KiB] *.C file |

|
|
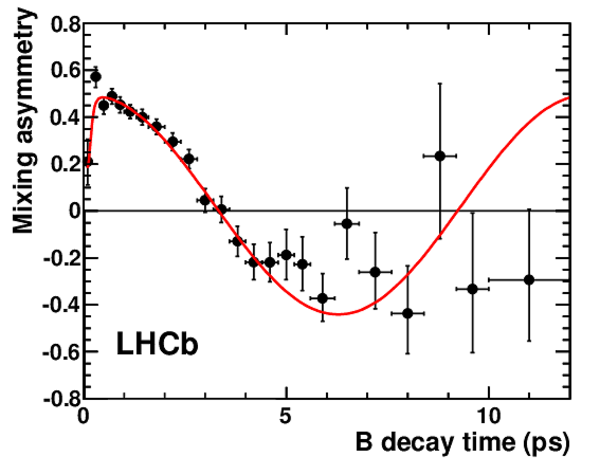
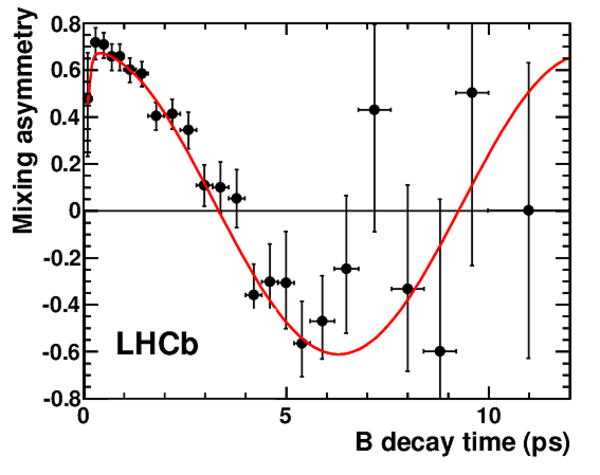
Raw mixing asymmetry as a function of $ B $ decay time in $ B ^0 \rightarrow D ^{*-} \mu ^+ \nu _\mu $ events, in the signal mass region, using the OS tagger. Events are split into seven samples of decreasing mistag probability $\eta_c$. |
Fig7a.pdf [11 KiB] HiDef png [131 KiB] Thumbnail [134 KiB] *.C file |
|
|
Fig7b.pdf [11 KiB] HiDef png [132 KiB] Thumbnail [134 KiB] *.C file |
|
|
|
Fig7c.pdf [11 KiB] HiDef png [138 KiB] Thumbnail [140 KiB] *.C file |

|
|
|
Fig7d.pdf [11 KiB] HiDef png [140 KiB] Thumbnail [144 KiB] *.C file |

|
|
|
Fig7e.pdf [11 KiB] HiDef png [150 KiB] Thumbnail [147 KiB] *.C file |

|
|
|
Fig7f.pdf [11 KiB] HiDef png [156 KiB] Thumbnail [151 KiB] *.C file |
|
|
|
Fig7g.pdf [11 KiB] HiDef png [171 KiB] Thumbnail [159 KiB] *.C file |
|
|
|
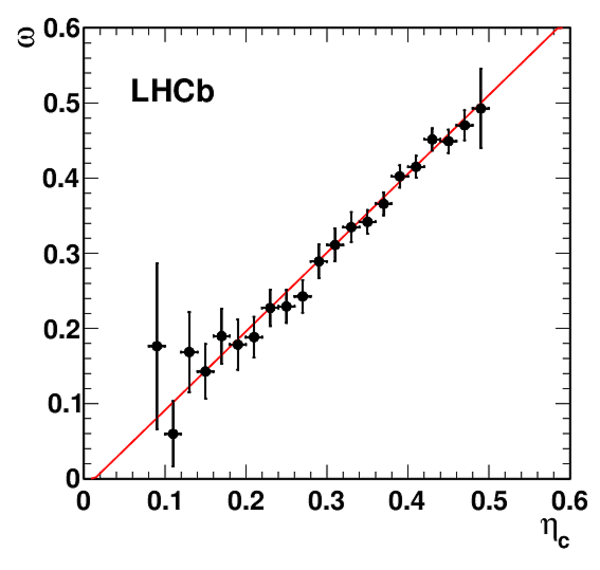
Measured mistag fraction ( $\omega$ ) versus calculated mistag probability ($\eta_c$) calibrated on $ B ^+ \rightarrow { J \mskip -3mu/\mskip -2mu\psi \mskip 2mu} K ^+ $ signal events for the OS tagger, in background subtracted events. Left and right plots correspond to $ B ^+ \rightarrow { J \mskip -3mu/\mskip -2mu\psi \mskip 2mu} K ^+ $ and $ B ^0 \rightarrow D ^{*-} \mu ^+ \nu _\mu $ signal events. Points with errors are data, the red lines represent the result of the mistag calibration, corresponding to the parameters of Table ???. |
Fig8a.pdf [16 KiB] HiDef png [134 KiB] Thumbnail [131 KiB] *.C file |
|
|
Fig8b.pdf [8 KiB] HiDef png [118 KiB] Thumbnail [110 KiB] *.C file |

|
|
|
Top: calibrated mistag probability distribution for (a) $ B ^+ \rightarrow { J \mskip -3mu/\mskip -2mu\psi \mskip 2mu} K ^+ $ , (b) $ B ^0 \rightarrow { J \mskip -3mu/\mskip -2mu\psi \mskip 2mu} K ^{*0} $ and (c) $ B ^0_s \rightarrow { J \mskip -3mu/\mskip -2mu\psi \mskip 2mu} \phi$ events. Bottom: distributions of the mean calibrated OS mistag probability as a function of signal $p_{\rm T}$ for the (d) $ B ^+$ , (e) $ B ^0$ and (f) $ B ^0_s$ channels. The plots show signal events extracted with the {\it sPlot} technique and with the requirement $t>0.3$ $ {\rm ps}$ . The three $p_{\rm T}$ distributions are fitted with straight lines and the slopes are compatible with zero. |
Fig9a.pdf [22 KiB] HiDef png [94 KiB] Thumbnail [54 KiB] *.C file |

|
|
Fig9b.pdf [23 KiB] HiDef png [107 KiB] Thumbnail [65 KiB] *.C file |
|
|
|
Fig9c.pdf [22 KiB] HiDef png [98 KiB] Thumbnail [61 KiB] *.C file |
|
|
|
Fig9d.pdf [16 KiB] HiDef png [107 KiB] Thumbnail [61 KiB] *.C file |

|
|
|
Fig9e.pdf [16 KiB] HiDef png [110 KiB] Thumbnail [63 KiB] *.C file |

|
|
|
Fig9f.pdf [17 KiB] HiDef png [111 KiB] Thumbnail [64 KiB] *.C file |

|
|
|
Animated gif made out of all figures. |
PAPER-2011-027.gif Thumbnail |

|
![HiDef png [209 KiB]](Directory_LHCb-PAPER-2011-027/hidef_Fig1.png)
![HiDef png [274 KiB]](Directory_LHCb-PAPER-2011-027/hidef_Fig2a.png)
![HiDef png [245 KiB]](Directory_LHCb-PAPER-2011-027/hidef_Fig2b.png)
![HiDef png [527 KiB]](Directory_LHCb-PAPER-2011-027/hidef_Fig2c.png)
![HiDef png [173 KiB]](Directory_LHCb-PAPER-2011-027/hidef_Fig3.png)
![HiDef png [201 KiB]](Directory_LHCb-PAPER-2011-027/hidef_Fig4.png)
![HiDef png [160 KiB]](Directory_LHCb-PAPER-2011-027/hidef_Fig5.png)
![HiDef png [525 KiB]](Directory_LHCb-PAPER-2011-027/hidef_Fig6.png)
![HiDef png [131 KiB]](Directory_LHCb-PAPER-2011-027/hidef_Fig7a.png)
![HiDef png [132 KiB]](Directory_LHCb-PAPER-2011-027/hidef_Fig7b.png)
![HiDef png [138 KiB]](Directory_LHCb-PAPER-2011-027/hidef_Fig7c.png)
![HiDef png [140 KiB]](Directory_LHCb-PAPER-2011-027/hidef_Fig7d.png)
![HiDef png [150 KiB]](Directory_LHCb-PAPER-2011-027/hidef_Fig7e.png)
![HiDef png [156 KiB]](Directory_LHCb-PAPER-2011-027/hidef_Fig7f.png)
![HiDef png [171 KiB]](Directory_LHCb-PAPER-2011-027/hidef_Fig7g.png)
![HiDef png [134 KiB]](Directory_LHCb-PAPER-2011-027/hidef_Fig8a.png)
![HiDef png [118 KiB]](Directory_LHCb-PAPER-2011-027/hidef_Fig8b.png)
![HiDef png [94 KiB]](Directory_LHCb-PAPER-2011-027/hidef_Fig9a.png)
![HiDef png [107 KiB]](Directory_LHCb-PAPER-2011-027/hidef_Fig9b.png)
![HiDef png [98 KiB]](Directory_LHCb-PAPER-2011-027/hidef_Fig9c.png)
![HiDef png [107 KiB]](Directory_LHCb-PAPER-2011-027/hidef_Fig9d.png)
![HiDef png [110 KiB]](Directory_LHCb-PAPER-2011-027/hidef_Fig9e.png)
![HiDef png [111 KiB]](Directory_LHCb-PAPER-2011-027/hidef_Fig9f.png)
Tables and captions
|
Selection criteria for the OS muon, electron and kaon taggers. |
Table_1.pdf [63 KiB] HiDef png [32 KiB] Thumbnail [15 KiB] tex code |

|
|
Tagging performance in the $ B ^+ \rightarrow { J \mskip -3mu/\mskip -2mu\psi \mskip 2mu} K ^+ $ channel. Uncertainties are statistical only. |
Table_2.pdf [47 KiB] HiDef png [65 KiB] Thumbnail [33 KiB] tex code |

|
|
Tagging performance in the $ B ^0 \rightarrow { J \mskip -3mu/\mskip -2mu\psi \mskip 2mu} K ^{*0} $ channel. Uncertainties are statistical only. |
Table_3.pdf [47 KiB] HiDef png [63 KiB] Thumbnail [33 KiB] tex code |

|
|
Tagging performance in the $B^0 \rightarrow D^{*-} \mu^+ \nu_\mu$ channel. Uncertainties are statistical only. |
Table_4.pdf [47 KiB] HiDef png [70 KiB] Thumbnail [34 KiB] tex code |

|
|
Fit values and correlations of the OS combined mistag calibration parameters measured in the $ B ^+ \rightarrow { J \mskip -3mu/\mskip -2mu\psi \mskip 2mu} K ^+ $ , $ B ^0 \rightarrow { J \mskip -3mu/\mskip -2mu\psi \mskip 2mu} K ^{*0} $ and $ B ^0 \rightarrow D ^{*-} \mu ^+ \nu _\mu $ channels. The uncertainties are statistical only. |
Table_5.pdf [53 KiB] HiDef png [41 KiB] Thumbnail [19 KiB] tex code |

|
|
Systematic uncertainties on the calibration parameters $p_0$ and $p_1$ obtained with $ B ^+ \rightarrow { J \mskip -3mu/\mskip -2mu\psi \mskip 2mu} K ^+ $ events. |
Table_6.pdf [47 KiB] HiDef png [47 KiB] Thumbnail [22 KiB] tex code |

|
|
Tagging efficiency, mistag probability and tagging power calculated from event-by-event probabilities for $ B ^+ \rightarrow { J \mskip -3mu/\mskip -2mu\psi \mskip 2mu} K ^+ $ , $ B ^0 \rightarrow { J \mskip -3mu/\mskip -2mu\psi \mskip 2mu} K ^{*0} $ , $ B ^0 \rightarrow D ^{*-} \mu ^+ \nu _\mu $ and $ B ^0_s \rightarrow { J \mskip -3mu/\mskip -2mu\psi \mskip 2mu} \phi$ signal events. The quoted uncertainties are obtained propagating the statistical (first) and systematic (second) uncertainties on the calibration parameters determined from the $ B ^+ \rightarrow { J \mskip -3mu/\mskip -2mu\psi \mskip 2mu} K ^+ $ events. |
Table_7.pdf [80 KiB] HiDef png [55 KiB] Thumbnail [27 KiB] tex code |

|
![HiDef png [32 KiB]](Directory_LHCb-PAPER-2011-027/hidef_Table_1.png)
![HiDef png [65 KiB]](Directory_LHCb-PAPER-2011-027/hidef_Table_2.png)
![HiDef png [63 KiB]](Directory_LHCb-PAPER-2011-027/hidef_Table_3.png)
![HiDef png [70 KiB]](Directory_LHCb-PAPER-2011-027/hidef_Table_4.png)
![HiDef png [41 KiB]](Directory_LHCb-PAPER-2011-027/hidef_Table_5.png)
![HiDef png [47 KiB]](Directory_LHCb-PAPER-2011-027/hidef_Table_6.png)
![HiDef png [55 KiB]](Directory_LHCb-PAPER-2011-027/hidef_Table_7.png)
Created on 27 April 2024.