Determination of the sign of the decay width difference in the $B^0_s$ system
[to restricted-access page]Information
LHCb-PAPER-2011-028
CERN-PH-EP-2012-050
arXiv:1202.4717 [PDF]
(Submitted on 21 Feb 2012)
Phys. Rev. Lett. 108 (2012) 241801
Inspire 1089837
Tools
Abstract
The interference between the K+K- S-wave and P-wave amplitudes in B_s -> J/psi K+K- decays with the K+K- pairs in the region around the phi(1020) resonance is used to determine the variation of the difference of the strong phase between these amplitudes as a function of K+K- invariant mass. Combined with the results from our CP asymmetry measurements in B_s -> J/psi phi decays, we conclude that the B_s mass eigenstate that is almost CP =+1 is lighter and decays faster than the mass eigenstate that is almost CP =-1. This determines the sign of the decay width difference DeltaGamma_s == Gamma_L -Gamma_H to be positive. Our result also resolves the ambiguity in the past measurements of the CP violating phase phi_s to be close to zero rather than pi. These conclusions are in agreement with the Standard Model expectations.
Figures and captions
|
Invariant mass distribution for $ B ^0_s \rightarrow \mu ^+\mu ^- K^+K^-$ candidates, with the mass of the $\mu^+\mu^-$ pair constrained to the nominal $J/\psi$ mass. The result of the fit is shown with signal (dashed curve) and combinatorial background (dotted curve) components and their sum (solid curve). |
Fig1.pdf [24 KiB] HiDef png [204 KiB] Thumbnail [172 KiB] *.C file |

|
|
Background subtracted $ K ^+ K ^- $ invariant mass distribution for $ B ^0_s \rightarrow { J \mskip -3mu/\mskip -2mu\psi \mskip 2mu} K ^+ K ^- $ candidates. The vertical dotted lines separate the four intervals. |
Fig2.pdf [14 KiB] HiDef png [128 KiB] Thumbnail [115 KiB] *.C file |

|
|
Distribution of (a) $ K ^+ K ^- $ S-wave signal events, and (b) $ K ^+ K ^- $ P-wave signal events, both in four invariant mass intervals. In (b), the distribution of simulated $ B ^0_s \rightarrow { J \mskip -3mu/\mskip -2mu\psi \mskip 2mu} \phi$ events in the four intervals assuming the same total number of P-wave events is also shown (dashed lines). Note the interference between the $ K ^+ K ^- $ S-wave and P-wave amplitudes integrated over the angular variables has vanishing contribution in these distributions. |
Fig3a.pdf [13 KiB] HiDef png [80 KiB] Thumbnail [42 KiB] *.C file |

|
|
Fig3b.pdf [13 KiB] HiDef png [119 KiB] Thumbnail [112 KiB] *.C file |

|
|
|
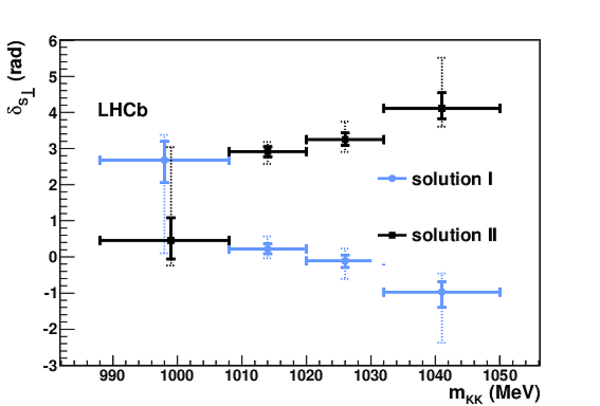
Measured phase differences between S-wave and perpendicular P-wave amplitudes in four intervals of $m_{KK}$ for solution I (full blue circles) and solution II (full black squares). The asymmetric error bars correspond to $\Delta\ln L =-0.5$ (solid lines) and $\Delta\ln L =-2$ (dash-dotted lines). |
Fig4.pdf [14 KiB] HiDef png [111 KiB] Thumbnail [110 KiB] *.C file |

|
|
Animated gif made out of all figures. |
PAPER-2011-028.gif Thumbnail |

|
Tables and captions
|
Numbers of signal and background events in the $m_{J/\psi KK}$ range of 5200--5550 MeV and statistical power per signal event in four intervals of $m_{KK}$.\\ |
Table_1.pdf [46 KiB] HiDef png [60 KiB] Thumbnail [29 KiB] tex code |

|
|
Results from a simultaneous fit of the four intervals of $m_{KK}$, where the uncertainties are statistical only. Only parameters which are needed for the ambiguity resolution are shown.\\ |
Table_2.pdf [54 KiB] HiDef png [160 KiB] Thumbnail [73 KiB] tex code |

|
Created on 27 April 2024.
