Measurement of the CP violating phase $\phi_s$ in $\overline{B}^0_s \to J/\psi f_0(980)$
[to restricted-access page]Information
LHCb-PAPER-2011-031
CERN-PH-EP-2011-205
arXiv:1112.3056 [PDF]
(Submitted on 13 Dec 2011)
Phys. Lett. B707 (2012) 497
Inspire 1081268
Tools
Abstract
Measurement of mixing-induced CP violation in Bs decays is of prime importance in probing new physics. So far only the channel Bs->J/\psi \phi has been used. Here we report on a measurement using an LHCb data sample of 0.41/fb in the CP odd eigenstate J\psi f0(980), where f0(980)->\pi+ \pi-. A time dependent fit of the data with the Bs lifetime and the difference in widths of the heavy and light eigenstates constrained to the values obtained from Bs-> J/\psi\phi yields a value of the CP violating phase of -0.44 +/- 0.44 +/- 0.02 rad, consistent with the Standard Model expectation.
Figures and captions
|
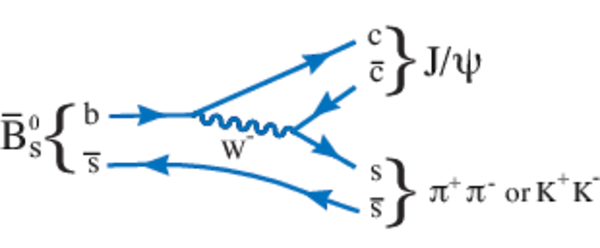
Dominant decay diagrams for $\overline{ B }{} ^0_s \rightarrow J/\psi f_0(980)$ or $J/\psi\phi$ decays. |
psi_f0-phi.pdf [49 KiB] HiDef png [92 KiB] Thumbnail [118 KiB] *.C file |
|
|
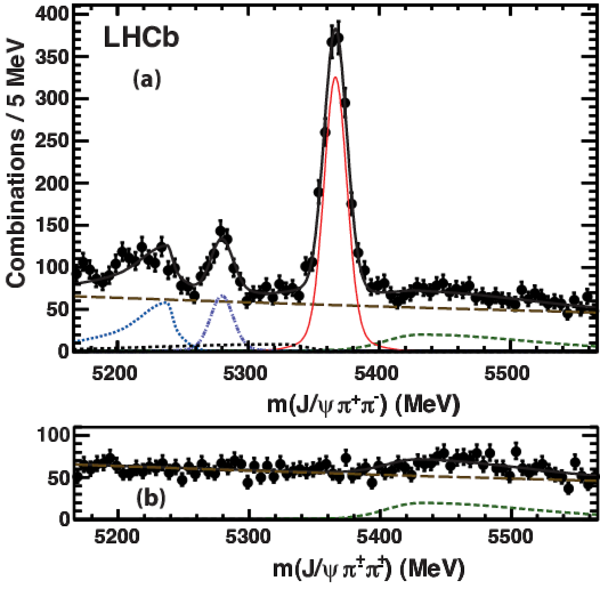
(a) Invariant mass of $J/\psi\pi^+\pi^-$ combinations when the $\pi^+\pi^-$ pair is required to be within $\pm$90 MeV of the nominal $f_0(980)$ mass. The data have been fitted with a double-Gaussian signal and several background functions. The thin (red) solid line shows the signal, the long-dashed (brown) line the combinatoric background, the dashed (green) line the $B^-$ background (mostly at masses above the signal peak), the dotted (blue) line the $\overline{B}^0\rightarrow J/\psi \overline{K}^{*0}$ background, the dash-dot line (purple) the $\overline{B}^0\rightarrow J/\psi \pi^+\pi^-$ background, the dotted line (black) the sum of $\overline{ B }{} ^0_s \rightarrow J/\psi \eta'$ and $J/\psi\phi$ backgrounds (barely visible), and the thick-solid (black) line the total. (b) The mass distribution for like-sign candidates. |
fitmass_f0.pdf [68 KiB] HiDef png [449 KiB] Thumbnail [347 KiB] *.C file |
|
|
Invariant mass of $\pi^+\pi^-$ combinations (points) and a fit to the $\pi^{\pm}\pi^{\pm}$ data (dashed line) for events in the $\overline{ B }{} ^0_s $ signal region. The region between the vertical arrows contains the events selected for further analysis. |
mpipi.pdf [61 KiB] HiDef png [162 KiB] Thumbnail [141 KiB] *.C file |

|
|
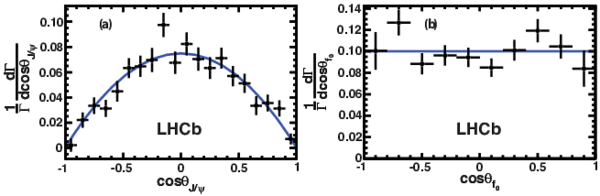
Efficiency corrected, background subtracted angular distributions in the $\pi^+\pi^-$ mass region within $\pm$90 MeV of 980 MeV and within $\pm$20 MeV of the $\overline{ B }{} ^0_s $ mass for (a) $\cos^2\theta_{J/\psi}$, and (b) $\cos\theta_{f_0}$. The solid lines show the expectations for a spin-0 object. |
ang_jp[..].pdf [61 KiB] HiDef png [125 KiB] Thumbnail [96 KiB] *.C file |
|
|
Decay time distribution for prompt $J/\psi\pi^+\pi^-$ events. The dashed line (red) shows the long lived components, while the solid line (blue) shows the total. |
time2011.pdf [62 KiB] HiDef png [279 KiB] Thumbnail [197 KiB] *.C file |

|
|
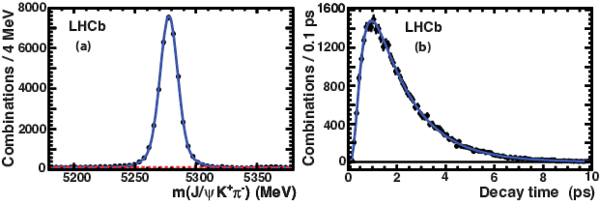
Distributions for $\overline{B}^0\rightarrow J/\psi \overline{K}^{*0}$ events (a) $\overline{B}^0$ candidate mass distribution and (b) decay time distribution, where the small background has been subtracted using the $\overline{B}^0$ candidate mass sidebands. |
Jpsikstar.pdf [68 KiB] HiDef png [185 KiB] Thumbnail [133 KiB] *.C file |
|
|
Log-likelihood profile of $\phi_s$ for $\overline{ B }{} ^0_s \rightarrow J/\psi f_0$ events. |
dll_dg[..].pdf [55 KiB] HiDef png [88 KiB] Thumbnail [99 KiB] *.C file |

|
|
Decay time distribution from the fit for $J/\psi f_0$ candidates. The solid line shows the results of the fit, the dashed line shows the signal, and the shaded region the background. |
time2.pdf [59 KiB] HiDef png [168 KiB] Thumbnail [151 KiB] *.C file |

|
|
Animated gif made out of all figures. |
PAPER-2011-031.gif Thumbnail |

|
![HiDef png [92 KiB]](Directory_LHCb-PAPER-2011-031/hidef_psi_f0-phi.png)
![HiDef png [449 KiB]](Directory_LHCb-PAPER-2011-031/hidef_fitmass_f0.png)
![HiDef png [162 KiB]](Directory_LHCb-PAPER-2011-031/hidef_mpipi.png)
![HiDef png [125 KiB]](Directory_LHCb-PAPER-2011-031/hidef_ang_jpsi_swave.png)
![HiDef png [279 KiB]](Directory_LHCb-PAPER-2011-031/hidef_time2011.png)
![HiDef png [185 KiB]](Directory_LHCb-PAPER-2011-031/hidef_Jpsikstar.png)
![HiDef png [88 KiB]](Directory_LHCb-PAPER-2011-031/hidef_dll_dgp_new.png)
![HiDef png [168 KiB]](Directory_LHCb-PAPER-2011-031/hidef_time2.png)
Tables and captions
|
The PDFs for the invariant mass and proper time describing the signal and background. $P_t^{\rm sig}$ refers to the decay time distribution in Eq. 9 and $A$ is given in Eq. 6. Where two numbers are listed, the first refers to the 2011 data and the second to the 2010 data. If only one number is listed they are the same for both years. The symbol $\hat{t}$ refers to the true time. |
Table_1.pdf [69 KiB] HiDef png [139 KiB] Thumbnail [64 KiB] tex code |

|
|
Summary of systematic uncertainties. Here $N_{\rm bkg}$ refers to the number of background events, $N_{\rm sig}$ the number of signal, $N_{\eta'}$ the number of $\eta'$, $\alpha$ the exponential background parameter for the $\overline{ B }{} ^0_s $ candidate mass, $N_{\rm LL}/N_{\rm bkg}$ the long-lived background fraction. The Gaussian signal parameters are the mean $m_0$, the width $\sigma(m)$; $t_0$, $a$ and $n$ are the three parameters in the acceptance time function. The resolution in signal time is given by $\sigma(t)$, and the background lifetime by $\tau_{\rm bkg}$. The final uncertainty is found by adding all the sources in quadrature. |
Table_2.pdf [65 KiB] HiDef png [149 KiB] Thumbnail [73 KiB] tex code |

|
![HiDef png [139 KiB]](Directory_LHCb-PAPER-2011-031/hidef_Table_1.png)
![HiDef png [149 KiB]](Directory_LHCb-PAPER-2011-031/hidef_Table_2.png)
Created on 27 April 2024.