Measurement of mixing and CP violation parameters in two-body charm decays
[to restricted-access page]Information
LHCb-PAPER-2011-032
CERN-PH-EP-2011-206
arXiv:1112.4698 [PDF]
(Submitted on 20 Dec 2011)
JHEP 04 (2012) 129
Inspire 1082327
Tools
Abstract
A study of mixing and indirect CP violation in D0 mesons through the determination of the parameters y_CP and A_\Gamma is presented. The parameter y_CP is the deviation from unity of the ratio of effective lifetimes measured in D0 decays to the CP eigenstate K+K- with respect to decays to the Cabibbo favoured mode K-\pi+. The result measured using data collected by LHCb in 2010, corresponding to an integrated luminosity of 29 pb^-1, is y_CP = (5.5+/-6.3_{stat}+/-4.1_{syst}) x 10^-3. The parameter A_\Gamma is the asymmetry of effective lifetimes measured in decays of D0 and anti-D0 mesons to K+K-. The result is A_\Gamma = (-5.9+/-5.9_{stat}+/-2.1_{syst}) x 10^-3. A data-driven technique is used to correct for lifetime-biasing effects.
Figures and captions
|
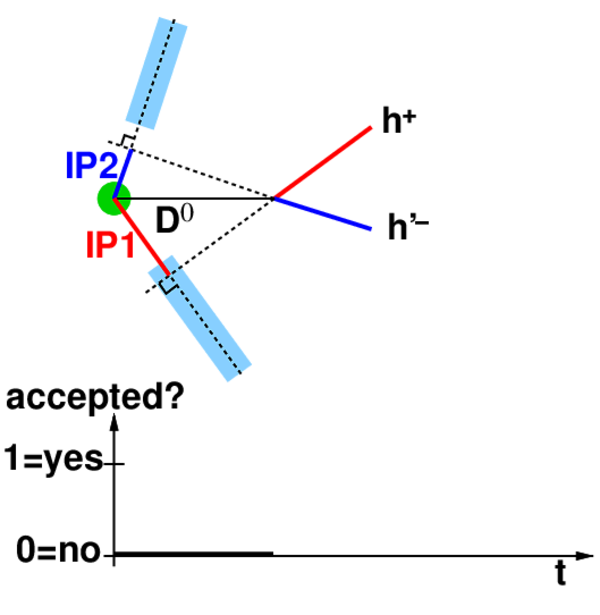
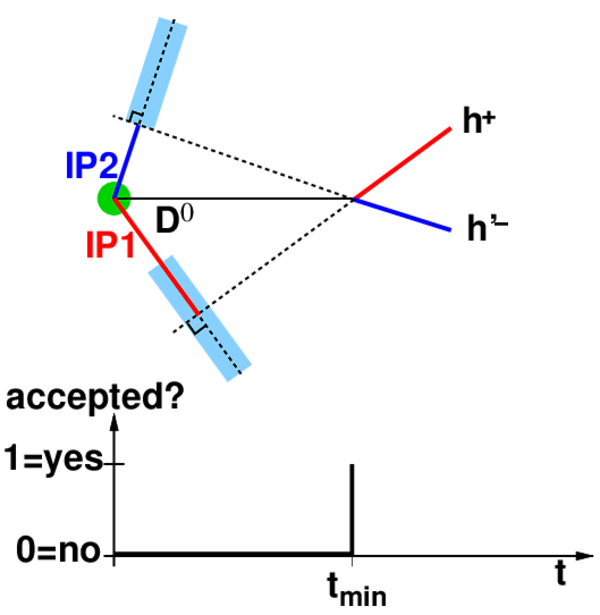
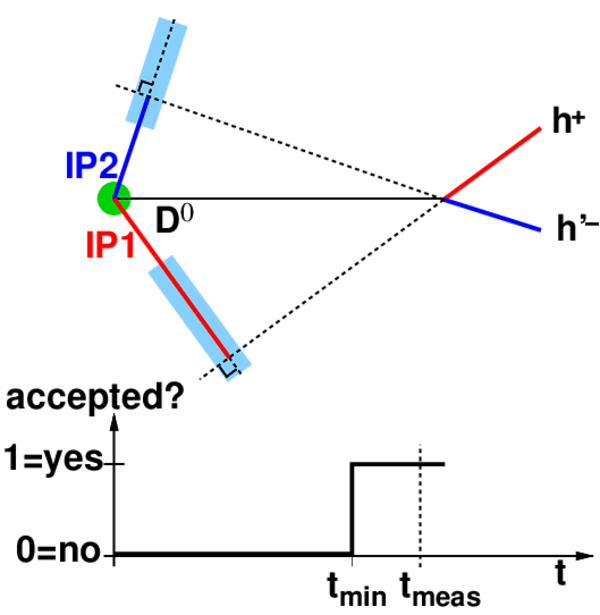
Variation of the decay-time acceptance function for a two-body $ D ^0$ decay when moving the primary vertex along the $ D ^0$ momentum vector. The shaded, light blue regions show the bands for accepting a track impact parameter. While the impact parameter of the negative track (IP2) is too low in (a) it reaches the accepted range in (b). The actual measured decay time, $t_{\rm meas}$, lies in the accepted region which continues to larger decay times (c). |
Figure_1a.eps [8 KiB] HiDef png [114 KiB] Thumbnail [86 KiB] *.C file |
|
|
Figure_1b.eps [8 KiB] HiDef png [123 KiB] Thumbnail [91 KiB] *.C file |
|
|
|
Figure_1c.eps [8 KiB] HiDef png [137 KiB] Thumbnail [102 KiB] *.C file |
|
|
|
$\Delta m$ vs $m_{ D ^0 }$ distribution for $ D ^0 \rightarrow K ^- \pi ^+ $ candidates. The contribution of random slow pions extends around the signal peak in the vertical direction while background is visible as a horizontal band. |
Figure_2.eps [286 KiB] HiDef png [1 MiB] Thumbnail [594 KiB] *.C file |

|
|
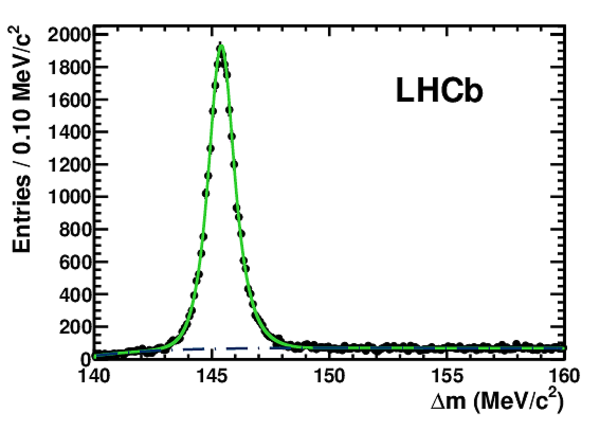
$\Delta m$ fit projections of (left) $ D ^0 \rightarrow K ^- \pi ^+ $ and (right) $ D ^0 \rightarrow K ^+ K ^- $ candidates. Shown are data (points), the total fit (green, solid) and the background component (blue, dot-dashed). |
Figure_3l.eps [16 KiB] HiDef png [195 KiB] Thumbnail [157 KiB] *.C file |

|
|
Figure_3r.eps [17 KiB] HiDef png [205 KiB] Thumbnail [172 KiB] *.C file |
|
|
|
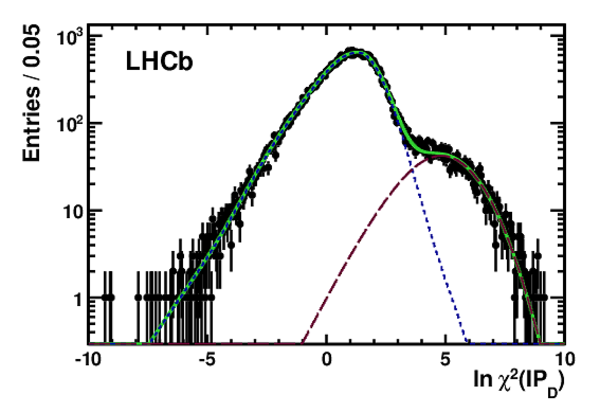
$\ln\chi^2( {\rm IP}_ D )$ fit projection of $ D ^0 \rightarrow K ^+ K ^- $ candidates in logarithmic scale. Shown are data (points), the total fit (green, solid), the prompt signal (blue, short-dashed), and the secondary signal (purple, long-dashed). |
Figure_4.eps [30 KiB] HiDef png [238 KiB] Thumbnail [167 KiB] *.C file |
|
|
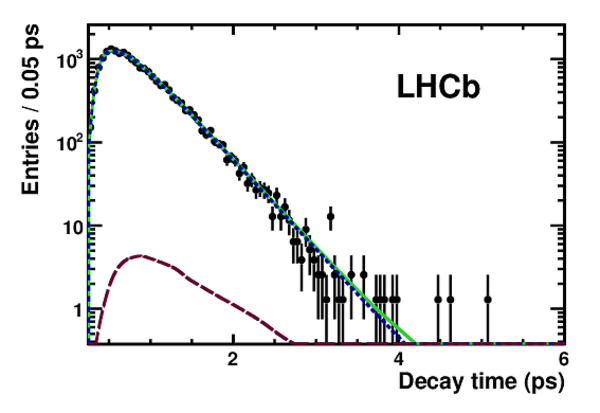
Proper-time fit projections of (left) $ D ^0 \rightarrow K ^+ K ^- $ and (right) $\overline{ D }{} ^0 \rightarrow K ^+ K ^- $ candidates after application of the $\ln\chi^2( {\rm IP}_ D )<2$ cut. Shown are data (points), the total fit (green, solid), the prompt signal (blue, short-dashed), and the secondary signal (purple, long-dashed). |
Figure_5l.eps [32 KiB] HiDef png [195 KiB] Thumbnail [139 KiB] *.C file |

|
|
Figure_5r.eps [33 KiB] HiDef png [204 KiB] Thumbnail [144 KiB] *.C file |
|
|
|
Animated gif made out of all figures. |
PAPER-2011-032.gif Thumbnail |

|
![HiDef png [114 KiB]](Directory_LHCb-PAPER-2011-032/hidef_Figure_1a.png)
![HiDef png [123 KiB]](Directory_LHCb-PAPER-2011-032/hidef_Figure_1b.png)
![HiDef png [137 KiB]](Directory_LHCb-PAPER-2011-032/hidef_Figure_1c.png)
![HiDef png [1 MiB]](Directory_LHCb-PAPER-2011-032/hidef_Figure_2.png)
![HiDef png [195 KiB]](Directory_LHCb-PAPER-2011-032/hidef_Figure_3l.png)
![HiDef png [205 KiB]](Directory_LHCb-PAPER-2011-032/hidef_Figure_3r.png)
![HiDef png [238 KiB]](Directory_LHCb-PAPER-2011-032/hidef_Figure_4.png)
![HiDef png [195 KiB]](Directory_LHCb-PAPER-2011-032/hidef_Figure_5l.png)
![HiDef png [204 KiB]](Directory_LHCb-PAPER-2011-032/hidef_Figure_5r.png)
Tables and captions
|
Summary of systematic uncertainties. |
Table_1.pdf [47 KiB] HiDef png [66 KiB] Thumbnail [32 KiB] tex code |

|
![HiDef png [66 KiB]](Directory_LHCb-PAPER-2011-032/hidef_Table_1.png)
Created on 27 April 2024.