Measurement of $\Upsilon$ production in $pp$ collisions at $\sqrt{s} = 7$ TeV
[to restricted-access page]Information
LHCb-PAPER-2011-036
CERN-PH-EP-2012-051
arXiv:1202.6579 [PDF]
(Submitted on 29 Feb 2012)
Eur. Phys. J. C72 (2012) 2025
Inspire 1091071
Tools
Abstract
The production of Upsilon(1S), Upsilon(2S) and Upsilon(3S) mesons in proton-proton collisions at the centre-of-mass energy of sqrt(s)=7 TeV is studied with the LHCb detector. The analysis is based on a data sample of 25 pb-1 collected at the Large Hadron Collider. The Upsilon mesons are reconstructed in the decay mode Upsilon -> mu+ mu- and the signal yields are extracted from a fit to the mu+ mu- invariant mass distributions. The differential production cross-sections times dimuon branching fractions are measured as a function of the Upsilon transverse momentum pT and rapidity y, over the range pT < 15 GeV/c and 2.0 < y < 4.5. The cross-sections times branching fractions, integrated over these kinematic ranges, are measured to be sigma(pp -> Upsilon(1S) X) x B(Upsilon(1S)->mu+ mu-) = 2.29 {\pm} 0.01 {\pm} 0.10 -0.37 +0.19 nb, sigma(pp -> Upsilon(2S) X) x B(Upsilon(2S)->mu+ mu-) = 0.562 {\pm} 0.007 {\pm} 0.023 -0.092 +0.048 nb, sigma(pp -> Upsilon(3S) X) x B(Upsilon(3S)->mu+ mu-) = 0.283 {\pm} 0.005 {\pm} 0.012 -0.048 +0.025 nb, where the first uncertainty is statistical, the second systematic and the third is due to the unknown polarisation of the three Upsilon states.
Figures and captions
|
Invariant mass distribution of the selected $\varUpsilon\rightarrow \mu^+\mu^-$ candidates in the range $ p_{\rm T} <15 {\mathrm{ Ge V /}c} $ and $2.0<y<4.5$. The three peaks correspond to the $\varUpsilon(1S)$, $\varUpsilon(2S)$ and $\varUpsilon(3S)$ signals (from left to right). The superimposed curves are the result of the fit as described in the text. |
fig1.eps [112 KiB] HiDef png [198 KiB] Thumbnail [172 KiB] *.C file |

|
|
Total efficiency $\varepsilon$ of the $\varUpsilon(1S)$ as a function of (a) the $\varUpsilon(1S)$ transverse momentum and (b) rapidity, estimated using the Monte Carlo simulation, for three different $\varUpsilon(1S)$ polarisation scenarios, indicated by the parameter $\alpha$ described in the text. |
fig2a.eps [13 KiB] HiDef png [160 KiB] Thumbnail [164 KiB] *.C file |

|
|
fig2b.eps [11 KiB] HiDef png [133 KiB] Thumbnail [138 KiB] *.C file |

|
|
|
Double differential ${\varUpsilon\rightarrow \mu^+\mu^-}$ cross-sections times dimuon branching fractions as a function of $p_{\rm T}$ in bins of rapidity for (a) the $\varUpsilon(1S)$, (b) the $\varUpsilon(2S)$ and (c) the $\varUpsilon(3S)$. The error bars correspond to the total uncertainty for each bin. |
fig3a.eps [23 KiB] HiDef png [255 KiB] Thumbnail [339 KiB] *.C file |

|
|
fig3b.eps [22 KiB] HiDef png [245 KiB] Thumbnail [328 KiB] *.C file |

|
|
|
fig3c.eps [22 KiB] HiDef png [247 KiB] Thumbnail [327 KiB] *.C file |

|
|
|
Differential $\varUpsilon(1S)\rightarrow\mu^+\mu^-$ production cross-section times dimuon branching fraction as a function of $p_{\rm T}$ integrated over $y$ in the range 2.0--4.5, compared with the predictions from (a) the NNLO* CSM [29] for direct production, and (b) the NLO NRQCD [31] and CEM [14]. The error bars on the data correspond to the total uncertainties for each bin, while the bands indicate the uncertainty on the theory prediction. |
fig4a.eps [19 KiB] HiDef png [939 KiB] Thumbnail [302 KiB] *.C file |

|
|
fig4b.eps [18 KiB] HiDef png [546 KiB] Thumbnail [227 KiB] *.C file |

|
|
|
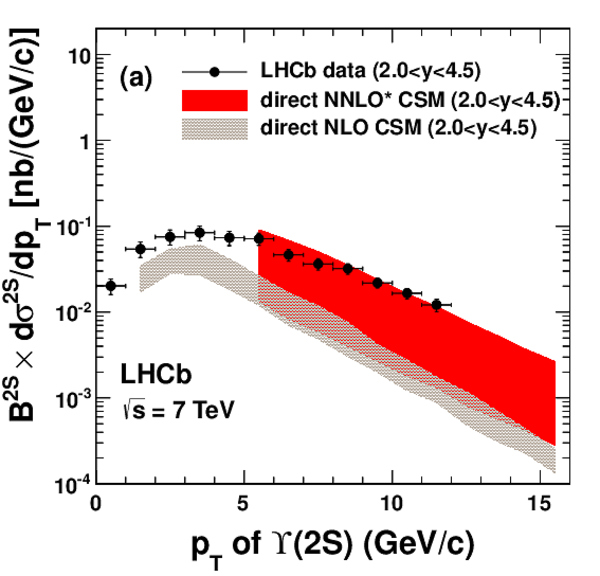
Differential (a) $\varUpsilon(2S)\rightarrow\mu^+\mu^-$ and (b) $\varUpsilon(3S)\rightarrow\mu^+\mu^-$ production cross-sections times dimuon branching fractions as a function of $p_{\rm T}$ integrated over $y$ in the range 2.0--4.5, compared with the predictions from the NNLO* CSM for direct production [29]. The error bars on the data correspond to the total uncertainties for each bin, while the bands indicate the uncertainty on the theory prediction. |
fig5a.eps [18 KiB] HiDef png [956 KiB] Thumbnail [304 KiB] *.C file |
|
|
fig5b.eps [18 KiB] HiDef png [949 KiB] Thumbnail [298 KiB] *.C file |

|
|
|
Differential cross-sections of $\varUpsilon(1S),\varUpsilon(2S)$ and $\varUpsilon(3S)$ times dimuon branching fractions as a function of (a) $ p_{\rm T} $ integrated over $y$ and (b) $y$ integrated over $ p_{\rm T} $. The error bars on the data correspond to the total uncertainties for each bin. |
fig6a.eps [16 KiB] HiDef png [176 KiB] Thumbnail [185 KiB] *.C file |

|
|
fig6b.eps [13 KiB] HiDef png [148 KiB] Thumbnail [162 KiB] *.C file |

|
|
|
Ratios of $\varUpsilon(2S)\rightarrow\mu^+\mu^-$ and $\varUpsilon(3S)\rightarrow\mu^+\mu^-$ with respect to $\varUpsilon(1S)\rightarrow\mu^+\mu^-$ as a function of $ p_{\rm T} $ of the $\varUpsilon$ in the range $2.0<y<4.5$, assuming no polarisation. The error bars on the data correspond to the total uncertainties for each bin except for that due to the unknown polarisation, which ranges between 15% and 26% as listed in Table 5. |
fig7.eps [12 KiB] HiDef png [152 KiB] Thumbnail [166 KiB] *.C file |

|
|
Animated gif made out of all figures. |
PAPER-2011-036.gif Thumbnail |

|
![HiDef png [198 KiB]](Directory_LHCb-PAPER-2011-036/hidef_fig1.png)
![HiDef png [160 KiB]](Directory_LHCb-PAPER-2011-036/hidef_fig2a.png)
![HiDef png [133 KiB]](Directory_LHCb-PAPER-2011-036/hidef_fig2b.png)
![HiDef png [255 KiB]](Directory_LHCb-PAPER-2011-036/hidef_fig3a.png)
![HiDef png [245 KiB]](Directory_LHCb-PAPER-2011-036/hidef_fig3b.png)
![HiDef png [247 KiB]](Directory_LHCb-PAPER-2011-036/hidef_fig3c.png)
![HiDef png [939 KiB]](Directory_LHCb-PAPER-2011-036/hidef_fig4a.png)
![HiDef png [546 KiB]](Directory_LHCb-PAPER-2011-036/hidef_fig4b.png)
![HiDef png [956 KiB]](Directory_LHCb-PAPER-2011-036/hidef_fig5a.png)
![HiDef png [949 KiB]](Directory_LHCb-PAPER-2011-036/hidef_fig5b.png)
![HiDef png [176 KiB]](Directory_LHCb-PAPER-2011-036/hidef_fig6a.png)
![HiDef png [148 KiB]](Directory_LHCb-PAPER-2011-036/hidef_fig6b.png)
![HiDef png [152 KiB]](Directory_LHCb-PAPER-2011-036/hidef_fig7.png)
Tables and captions
|
Summary of the relative systematic uncertainties on the cross-section measurements. Ranges indicate variations depending on the ($ p_{\rm T} ,y$) bin and the $\varUpsilon$ state. All uncertainties are fully correlated among the bins. |
Table_1.pdf [34 KiB] HiDef png [88 KiB] Thumbnail [40 KiB] tex code |

|
|
Double differential cross-section $\varUpsilon(1S)\rightarrow\mu^+\mu^-$ as a function of rapidity and transverse momentum, in pb/( $ {\mathrm{ Ge V /}c}$ ). The first uncertainty is statistical, the second is systematic, and the third is due to the unknown polarisation of the $\varUpsilon(1S)$. |
Table_2.pdf [67 KiB] HiDef png [156 KiB] Thumbnail [72 KiB] tex code |

|
|
Double differential cross-section $\varUpsilon(2S)\rightarrow\mu^+\mu^-$ as a function of rapidity and transverse momentum, in pb/( $ {\mathrm{ Ge V /}c}$ ). The first uncertainty is statistical, the second is systematic, and the third is due to the unknown polarisation of the $\varUpsilon(2S)$. Regions where the number of events was not sufficient to perform a measurement are indicated with a dash. |
Table_3.pdf [67 KiB] HiDef png [140 KiB] Thumbnail [69 KiB] tex code |

|
|
Double differential cross-section $\varUpsilon(3S)\rightarrow\mu^+\mu^-$ as a function of rapidity and transverse momentum, in pb/( $ {\mathrm{ Ge V /}c}$ ). The first uncertainty is statistical, the second is systematic, and the third is due to the unknown polarisation of the $\varUpsilon(3S)$. Regions where the number of events was not sufficient to perform a measurement are indicated with a dash. |
Table_4.pdf [66 KiB] HiDef png [138 KiB] Thumbnail [68 KiB] tex code |

|
|
Ratios of cross-sections $\varUpsilon(2S)\rightarrow\mu^+\mu^-$ and $\varUpsilon(3S)\rightarrow\mu^+\mu^-$ with respect to {$\varUpsilon(1S)\rightarrow\mu^+\mu^-$} as a function of $ p_{\rm T} $ in the range $2.0<y<4.5$, assuming no polarisation. The first uncertainty is statistical, the second is systematic and the third is due to the unknown polarisation of the three states. |
Table_5.pdf [56 KiB] HiDef png [130 KiB] Thumbnail [60 KiB] tex code |

|
![HiDef png [88 KiB]](Directory_LHCb-PAPER-2011-036/hidef_Table_1.png)
![HiDef png [156 KiB]](Directory_LHCb-PAPER-2011-036/hidef_Table_2.png)
![HiDef png [140 KiB]](Directory_LHCb-PAPER-2011-036/hidef_Table_3.png)
![HiDef png [138 KiB]](Directory_LHCb-PAPER-2011-036/hidef_Table_4.png)
![HiDef png [130 KiB]](Directory_LHCb-PAPER-2011-036/hidef_Table_5.png)
Created on 26 April 2024.