Measurement of prompt hadron production ratios in $pp$ collisions at $\sqrt{s} = $ 0.9 and 7 TeV
[to restricted-access page]Information
LHCb-PAPER-2011-037
CERN-PH-EP-2012-171
arXiv:1206.5160 [PDF]
(Submitted on 22 Jun 2012)
Eur. Phys. J. C72 (2012) 2168
Inspire 1119400
Tools
Abstract
The charged-particle production ratios $\bar{p}/p$, $K^-/K^+$, $\pi^-/\pi^+$, $(p + \bar{p})/(\pi^+ + \pi^-)$, $(K^+ + K^-)/(\pi^+ + \pi^-)$ and $(p + \bar{p})/(K^+ + K^-)$ are measured with the LHCb detector using $0.3 {\rm nb^{-1}}$ of $pp$ collisions delivered by the LHC at $\sqrt{s} = 0.9$ TeV and $1.8 {\rm nb^{-1}}$ at $\sqrt{s} = 7$ TeV. The measurements are performed as a function of transverse momentum $p_{\rm T}$ and pseudorapidity $\eta$. The production ratios are compared to the predictions of several Monte Carlo generator settings, none of which are able to describe adequately all observables. The ratio $\bar{p}/p$ is also considered as a function of rapidity loss, $\Delta y \equiv y_{\rm beam} - y$, and is used to constrain models of baryon transport.
Figures and captions
|
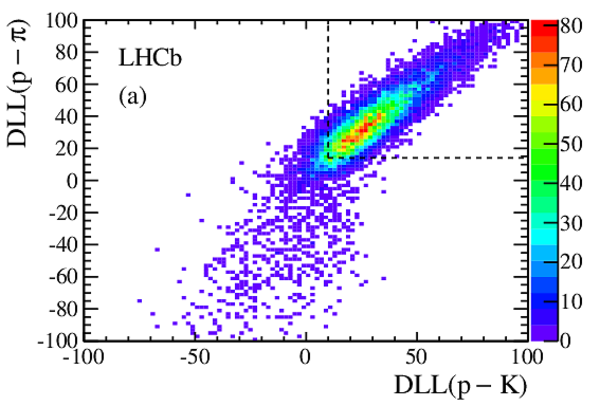
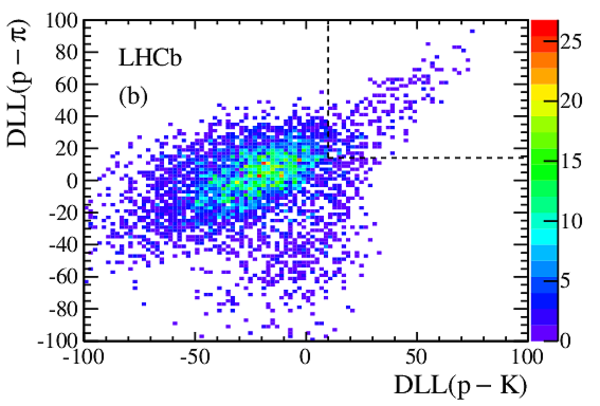
Two-dimensional distribution of the change in log likelihood DLL($p-K$) and DLL($p-\pi$) for (a) protons, (b) kaons and (c) pions (here shown for negative tracks and one magnet polarity) in the calibration sample with $p_{\rm T} > 1.2$ GeV/$c$ and $3.5 < \eta \le 4.0$. The region indicated by the dotted lines in the top right corner of each plot is that which is selected in the analysis to isolate the proton sample. The selection of the calibration sample is discussed in Sect. ???. |
DLLKpi[..].eps [44 KiB] HiDef png [302 KiB] Thumbnail [271 KiB] *.C file |
|
|
DLLKpi[..].eps [58 KiB] HiDef png [357 KiB] Thumbnail [309 KiB] *.C file |
|
|
|
DLLKpi[..].eps [65 KiB] HiDef png [369 KiB] Thumbnail [309 KiB] *.C file |

|
|
|
Invariant mass distributions reconstructed for one magnet polarity from the $\sqrt{s}=7 \mathrm{TeV}$ data in the analysis bin for which the positive final-state particle has $ p_{\rm T} \ge 1.2 {\rm GeV}$ and $3.5\le \eta<4.0$ for (a) $K^0_{\rm S} \rightarrow \pi^+\pi^-$, (b) $\Lambda \rightarrow p \pi^-$ and (c) $\phi \rightarrow K^+K^-$. The results of unbinned maximum likelihood fits to the data are superimposed. |
K0S_Mass.eps [24 KiB] HiDef png [165 KiB] Thumbnail [141 KiB] *.C file |

|
|
Lambda[..].eps [25 KiB] HiDef png [173 KiB] Thumbnail [156 KiB] *.C file |

|
|
|
Phi_Mass.eps [25 KiB] HiDef png [199 KiB] Thumbnail [180 KiB] *.C file |

|
|
|
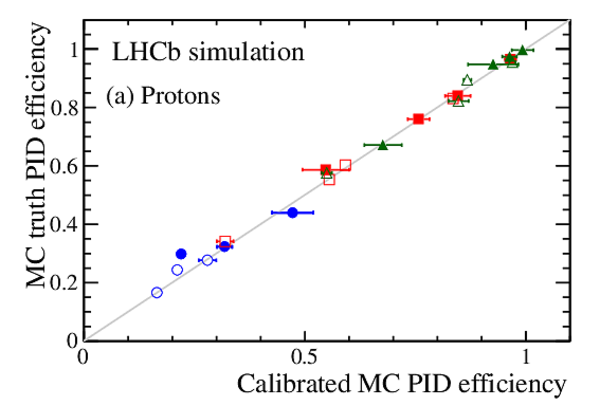
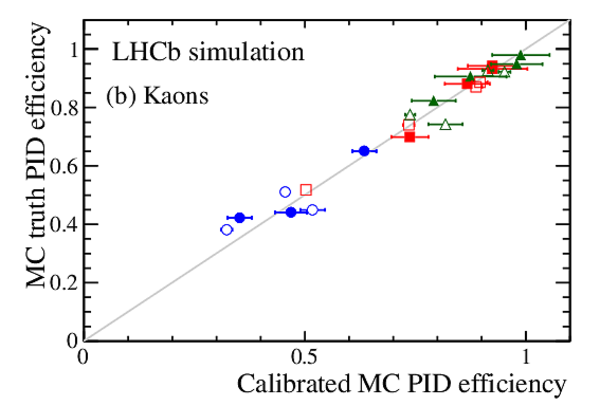
Monte Carlo PID efficiency study for protons (a), kaons (b) and pions (c). Shown is a comparison of measured efficiencies from a Monte Carlo calibration sample, after background subtraction and reweighting, with the true values in the Monte Carlo analysis sample. The diagonal line on each plot is drawn with unit gradient. |
MC_Pro[..].eps [7 KiB] HiDef png [155 KiB] Thumbnail [134 KiB] *.C file |
|
|
MC_Kao[..].eps [8 KiB] HiDef png [158 KiB] Thumbnail [138 KiB] *.C file |
|
|
|
MC_Pio[..].eps [10 KiB] HiDef png [193 KiB] Thumbnail [178 KiB] *.C file |

|
|
|
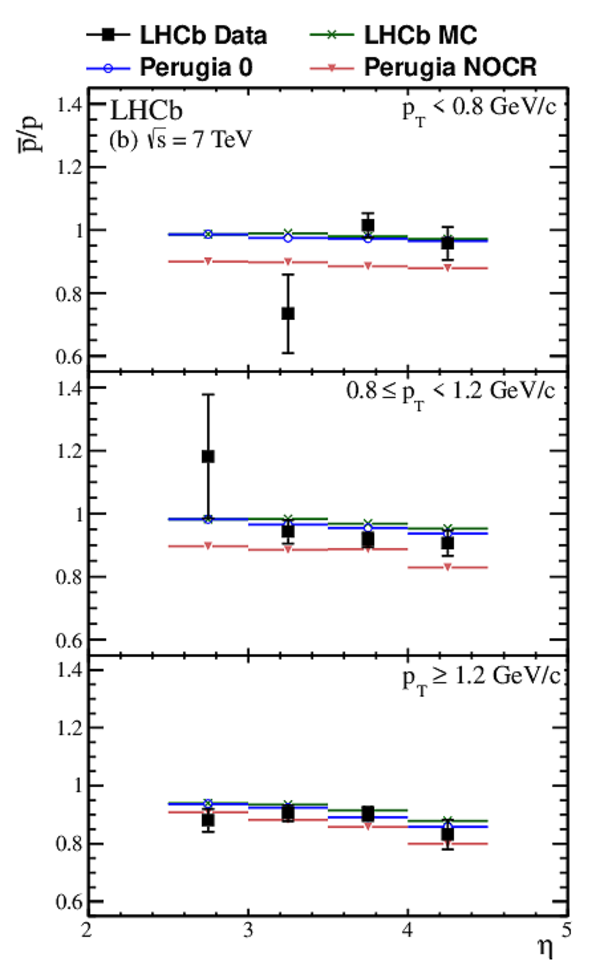
Results for the $\bar{p}/p$ ratio at 0.9 TeV (a) and 7 TeV (b). |
Public[..].eps [15 KiB] HiDef png [224 KiB] Thumbnail [250 KiB] *.C file |

|
|
Public[..].eps [17 KiB] HiDef png [238 KiB] Thumbnail [275 KiB] *.C file |
|
|
|
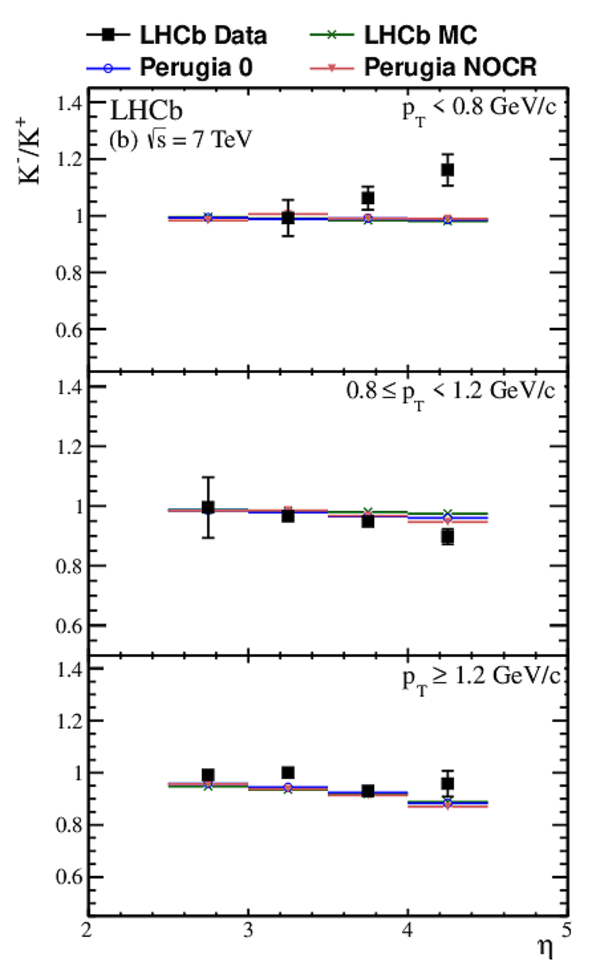
Results for the $K^{-}/K^{+}$ ratio at 0.9 TeV (a) and 7 TeV (b). |
Public[..].eps [16 KiB] HiDef png [217 KiB] Thumbnail [242 KiB] *.C file |

|
|
Public[..].eps [17 KiB] HiDef png [224 KiB] Thumbnail [268 KiB] *.C file |
|
|
|
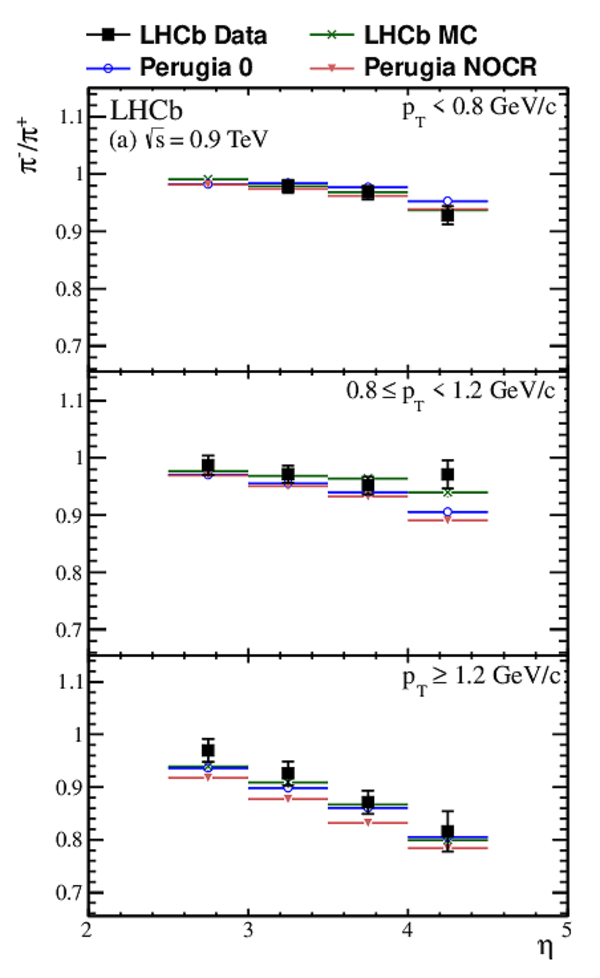
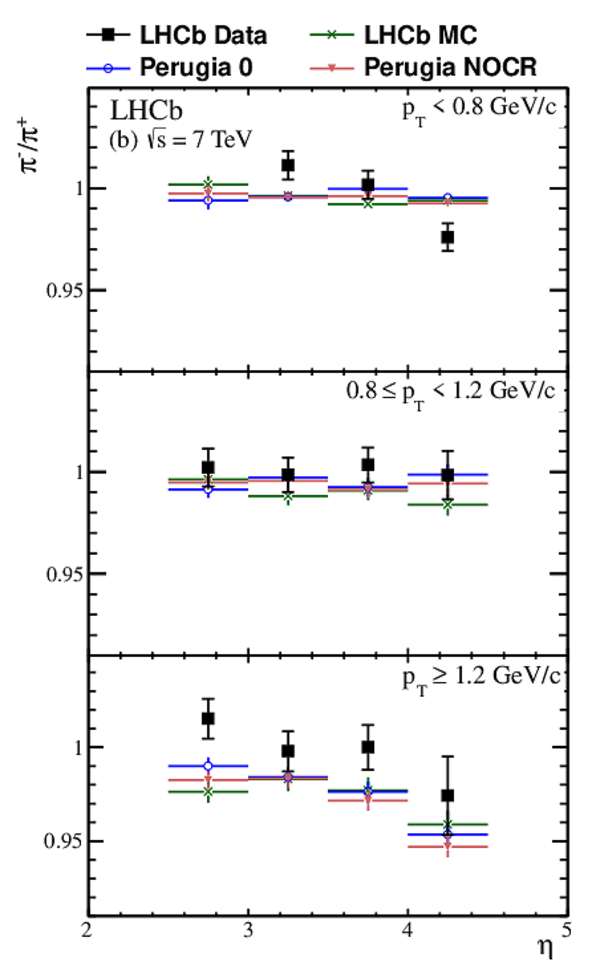
Results for the $\pi^{-}/\pi^{+}$ ratio at 0.9 TeV (a) and 7 TeV (b). |
Public[..].eps [18 KiB] HiDef png [241 KiB] Thumbnail [292 KiB] *.C file |
|
|
Public[..].eps [17 KiB] HiDef png [232 KiB] Thumbnail [258 KiB] *.C file |
|
|
|
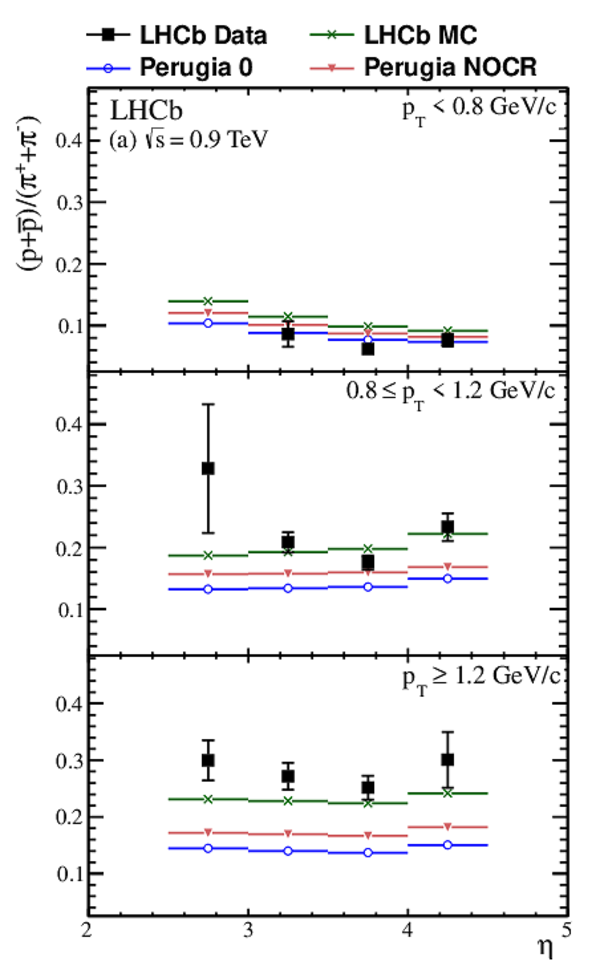
Results for the $(p + \bar{p})/(\pi^+ + \pi^-)$ ratio at 0.9 TeV (a) and 7 TeV (b). |
Public[..].eps [18 KiB] HiDef png [262 KiB] Thumbnail [311 KiB] *.C file |
|
|
Public[..].eps [17 KiB] HiDef png [244 KiB] Thumbnail [277 KiB] *.C file |

|
|
|
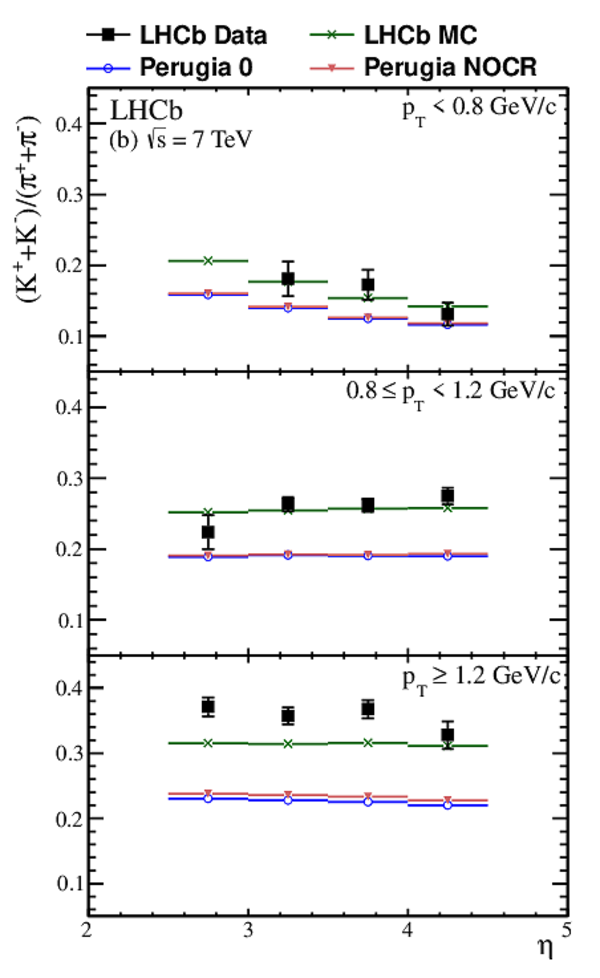
Results for the $(K^+ + K^-)/(\pi^+ + \pi^-)$ ratio at 0.9 TeV (a) and 7 TeV (b). |
Public[..].eps [18 KiB] HiDef png [254 KiB] Thumbnail [299 KiB] *.C file |

|
|
Public[..].eps [18 KiB] HiDef png [252 KiB] Thumbnail [293 KiB] *.C file |
|
|
|
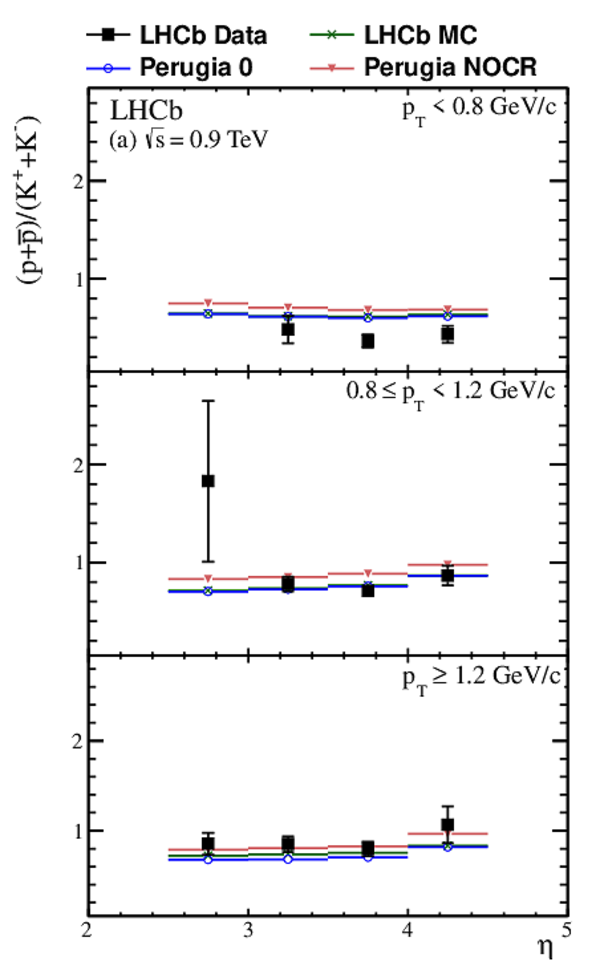
Results for the $(p + \bar{p})/(K^+ + K^-)$ ratio at 0.9 TeV (a) and 7 TeV (b). |
Public[..].eps [16 KiB] HiDef png [220 KiB] Thumbnail [250 KiB] *.C file |
|
|
Public[..].eps [16 KiB] HiDef png [231 KiB] Thumbnail [260 KiB] *.C file |

|
|
|
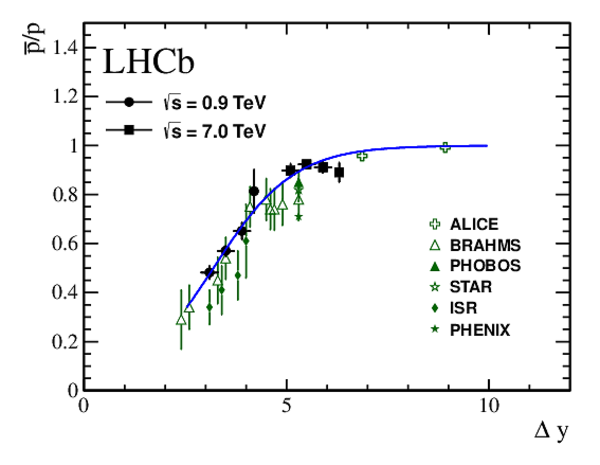
Results for the $\bar{p}/p$ ratio against the rapidity loss $\Delta y$ from LHCb. Results from other experiments are also shown \cite{ALICEPBARP,ISR,BRAHMS, PHENIX,PHOBOS,STAR}. Superimposed is a fit to the LHCb and ALICE \cite{ALICEPBARP} measurements that is described in the text. |
Deltay[..].eps [13 KiB] HiDef png [154 KiB] Thumbnail [137 KiB] *.C file |
|
|
Animated gif made out of all figures. |
PAPER-2011-037.gif Thumbnail |

|
![HiDef png [302 KiB]](Directory_LHCb-PAPER-2011-037/hidef_DLLKpiVsDLLPpi_Protons.png)
![HiDef png [357 KiB]](Directory_LHCb-PAPER-2011-037/hidef_DLLKpiVsDLLPpi_Kaons.png)
![HiDef png [369 KiB]](Directory_LHCb-PAPER-2011-037/hidef_DLLKpiVsDLLPpi_Pions.png)
![HiDef png [165 KiB]](Directory_LHCb-PAPER-2011-037/hidef_K0S_Mass.png)
![HiDef png [173 KiB]](Directory_LHCb-PAPER-2011-037/hidef_Lambda_Mass.png)
![HiDef png [199 KiB]](Directory_LHCb-PAPER-2011-037/hidef_Phi_Mass.png)
![HiDef png [155 KiB]](Directory_LHCb-PAPER-2011-037/hidef_MC_Proton_eff.png)
![HiDef png [158 KiB]](Directory_LHCb-PAPER-2011-037/hidef_MC_Kaon_eff.png)
![HiDef png [193 KiB]](Directory_LHCb-PAPER-2011-037/hidef_MC_Pion_eff.png)
![HiDef png [224 KiB]](Directory_LHCb-PAPER-2011-037/hidef_Public_FP_450GeV_proton_v3_ptbin3_average.png)
![HiDef png [238 KiB]](Directory_LHCb-PAPER-2011-037/hidef_Public_FP_3500GeV_proton_v3_ptbin3_average.png)
![HiDef png [217 KiB]](Directory_LHCb-PAPER-2011-037/hidef_Public_FP_450GeV_kaon_v3_ptbin3_average.png)
![HiDef png [224 KiB]](Directory_LHCb-PAPER-2011-037/hidef_Public_FP_3500GeV_kaon_v3_ptbin3_average.png)
![HiDef png [241 KiB]](Directory_LHCb-PAPER-2011-037/hidef_Public_FP_450GeV_pion_v3_ptbin3_average.png)
![HiDef png [232 KiB]](Directory_LHCb-PAPER-2011-037/hidef_Public_FP_3500GeV_pion_v3_ptbin3_average.png)
![HiDef png [262 KiB]](Directory_LHCb-PAPER-2011-037/hidef_Public_FP_450GeV_ppi_v3_ptbin3_average.png)
![HiDef png [244 KiB]](Directory_LHCb-PAPER-2011-037/hidef_Public_FP_3500GeV_ppi_v3_ptbin3_average.png)
![HiDef png [254 KiB]](Directory_LHCb-PAPER-2011-037/hidef_Public_FP_450GeV_Kpi_v3_ptbin3_average.png)
![HiDef png [252 KiB]](Directory_LHCb-PAPER-2011-037/hidef_Public_FP_3500GeV_Kpi_v3_ptbin3_average.png)
![HiDef png [220 KiB]](Directory_LHCb-PAPER-2011-037/hidef_Public_FP_450GeV_pK_v3_ptbin3_average.png)
![HiDef png [231 KiB]](Directory_LHCb-PAPER-2011-037/hidef_Public_FP_3500GeV_pK_v3_ptbin3_average.png)
![HiDef png [154 KiB]](Directory_LHCb-PAPER-2011-037/hidef_Deltay_4paper_withfit.png)
Tables and captions
|
Number of particle candidates in the analysis sample at $\sqrt{s}=0.9$ TeV, separated into positive and negative charge ($Q$). |
Table_1.pdf [37 KiB] HiDef png [71 KiB] Thumbnail [31 KiB] tex code |

|
|
Number of particle candidates in the analysis sample at $\sqrt{s}=7.0$ TeV, separated into positive and negative charge ($Q$). |
Table_2.pdf [37 KiB] HiDef png [81 KiB] Thumbnail [35 KiB] tex code |

|
|
Range of systematic uncertainties, in percent, for same-particle ratios at $\sqrt{s}=0.9$ TeV. |
Table_3.pdf [46 KiB] HiDef png [64 KiB] Thumbnail [33 KiB] tex code |

|
|
Range of systematic uncertainties, in percent, for same-particle ratios at $\sqrt{s}=7$ TeV. |
Table_4.pdf [46 KiB] HiDef png [65 KiB] Thumbnail [33 KiB] tex code |

|
|
Range of systematic uncertainties, in percent, for different-particle ratios at $\sqrt{s}=0.9$ TeV. |
Table_5.pdf [46 KiB] HiDef png [48 KiB] Thumbnail [23 KiB] tex code |

|
|
Range of systematic uncertainties, in percent, for different-particle ratios at $\sqrt{s}=7$ TeV. |
Table_6.pdf [46 KiB] HiDef png [48 KiB] Thumbnail [23 KiB] tex code |

|
|
Results for $\bar{p}/p$ ratio integrated over $p_{\rm T}$ in $\eta$ bins as a function of the rapidity loss $\Delta y$. |
Table_7.pdf [30 KiB] HiDef png [114 KiB] Thumbnail [58 KiB] tex code |

|
|
Results for the $\bar{p}/p$ ratio with statistical and systematic uncertainties, as a function of $p_{\rm T}$ and $\eta$. Also shown is the mean rapidity, $y$, and RMS spread for the sample in each $\eta$ bin. |
Table_8.pdf [38 KiB] HiDef png [99 KiB] Thumbnail [40 KiB] tex code |

|
|
Results for the $K^-/K^+$ ratio with statistical and systematic uncertainties, as a function of $p_{\rm T}$ and $\eta$. Also shown is the mean rapidity, $y$, and RMS spread for the sample in each $\eta$ bin. |
Table_9.pdf [38 KiB] HiDef png [98 KiB] Thumbnail [39 KiB] tex code |

|
|
Results for the $\pi^-/\pi^+$ ratio with statistical and systematic uncertainties, as a function of $p_{\rm T}$ and $\eta$. Also shown is the mean rapidity, $y$, and RMS spread for the sample in each $\eta$ bin. |
Table_10.pdf [38 KiB] HiDef png [97 KiB] Thumbnail [38 KiB] tex code |

|
|
Results for the $(p + \bar{p})/(\pi^+ + \pi^-)$ ratio with statistical and systematic uncertainties, as a function of $p_{\rm T}$ and $\eta$. |
Table_11.pdf [36 KiB] HiDef png [103 KiB] Thumbnail [25 KiB] tex code |

|
|
Results for the $(K^+ + K^-)/(\pi^+ + \pi^-)$ ratio with statistical and systematic uncertainties, as a function of $p_{\rm T}$ and $\eta$. |
Table_12.pdf [36 KiB] HiDef png [102 KiB] Thumbnail [25 KiB] tex code |

|
|
Results for the $(p + \bar{p})/(K^+ + K^-)$ ratio with statistical and systematic uncertainties, as a function of $p_{\rm T}$ and $\eta$. |
Table_13.pdf [36 KiB] HiDef png [105 KiB] Thumbnail [27 KiB] tex code |

|
![HiDef png [71 KiB]](Directory_LHCb-PAPER-2011-037/hidef_Table_1.png)
![HiDef png [81 KiB]](Directory_LHCb-PAPER-2011-037/hidef_Table_2.png)
![HiDef png [64 KiB]](Directory_LHCb-PAPER-2011-037/hidef_Table_3.png)
![HiDef png [65 KiB]](Directory_LHCb-PAPER-2011-037/hidef_Table_4.png)
![HiDef png [48 KiB]](Directory_LHCb-PAPER-2011-037/hidef_Table_5.png)
![HiDef png [48 KiB]](Directory_LHCb-PAPER-2011-037/hidef_Table_6.png)
![HiDef png [114 KiB]](Directory_LHCb-PAPER-2011-037/hidef_Table_7.png)
![HiDef png [99 KiB]](Directory_LHCb-PAPER-2011-037/hidef_Table_8.png)
![HiDef png [98 KiB]](Directory_LHCb-PAPER-2011-037/hidef_Table_9.png)
![HiDef png [97 KiB]](Directory_LHCb-PAPER-2011-037/hidef_Table_10.png)
![HiDef png [103 KiB]](Directory_LHCb-PAPER-2011-037/hidef_Table_11.png)
![HiDef png [102 KiB]](Directory_LHCb-PAPER-2011-037/hidef_Table_12.png)
![HiDef png [105 KiB]](Directory_LHCb-PAPER-2011-037/hidef_Table_13.png)
Created on 27 April 2024.