Measurement of $b$-hadron branching fractions for two-body decays into charmless charged hadrons
[to restricted-access page]Information
LHCb-PAPER-2012-002
CERN-PH-EP-2012-161
arXiv:1206.2794 [PDF]
(Submitted on 13 Jun 2012)
JHEP 10 (2012) 37
Inspire 1118162
Tools
Abstract
Based on data corresponding to an integrated luminosity of 0.37 fb^-1 collected by the LHCb experiment in 2011, the following ratios of branching fractions are measured: B(B0 -> pi+ pi-) / B(B0 -> K+pi-) = 0.262 +/- 0.009 +/- 0.017, (fs/fd) * B(Bs -> K+K-) / B(B^0 -> K+pi-) = 0.316 +/- 0.009 +/- 0.019, (fs/fd) * B(Bs ->pi+ K-) / B(B0 -> K+pi-) = 0.074 +/- 0.006 +/- 0.006, (fd/fs) * B(B0 -> K+K-) / B(Bs -> K+K-) = 0.018 {+ 0.008 - 0.007} +/- 0.009, (fs/fd) * B(Bs -> pi+pi-) / B(B0 -> pi+pi-) = 0.050 {+ 0.011 - 0.009} +/- 0.004, B(Lambda_b -> p pi-) / B(Lambda_b -> p K-) = 0.86 +/- 0.08 +/- 0.05, where the first uncertainties are statistical and the second systematic. Using the current world average of B(B0 -> K+pi-) and the ratio of the strange to light neutral B meson production fs/fd measured by LHCb, we obtain: B(B0 -> pi+pi-) = (5.08 +/- 0.17 +/- 0.37) x 10^-6, B(Bs -> K+K-) = (23.0 +/- 0.7 +/- 2.3) x 10^-6, B(Bs -> pi+K-) = (5.4 +/- 0.4 +/- 0.6) x 10^-6, B(B0 -> K+K-) = (0.11 {+ 0.05 - 0.04} +/- 0.06) x 10^-6, B(Bs -> pi+pi-) = (0.95 {+ 0.21 - 0.17} +/- 0.13) x 10^-6. The measurements of B(Bs -> K+K-), B(Bs -> pi+ K-) and B(B0 -> K+K-) are the most precise to date. The decay mode Bs -> pi+pi- is observed for the first time with a significance of more than 5 sigma.
Figures and captions
|
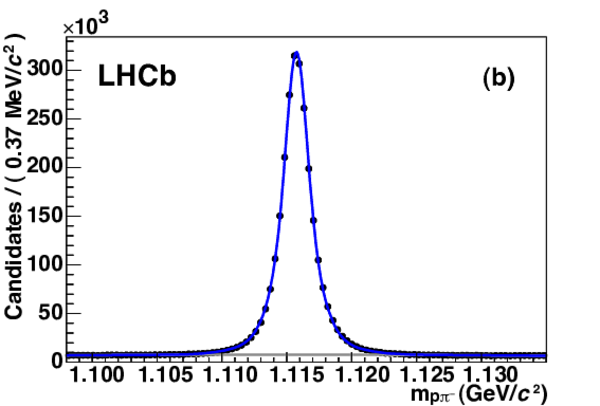
Distributions of (a) $\delta m=m_{K\pi\pi}-m_{K\pi}$ for $D^{*+}\rightarrow D^0(K^-\pi^+)\pi^+$ candidates and (b) invariant mass of $\Lambda \rightarrow p \pi^-$ candidates, used for the PID calibration. The curves are the results of maximum likelihood fits. |
dstar.pdf [153 KiB] HiDef png [169 KiB] Thumbnail [147 KiB] *.C file |

|
|
lambda.pdf [152 KiB] HiDef png [152 KiB] Thumbnail [108 KiB] *.C file |
|
|
|
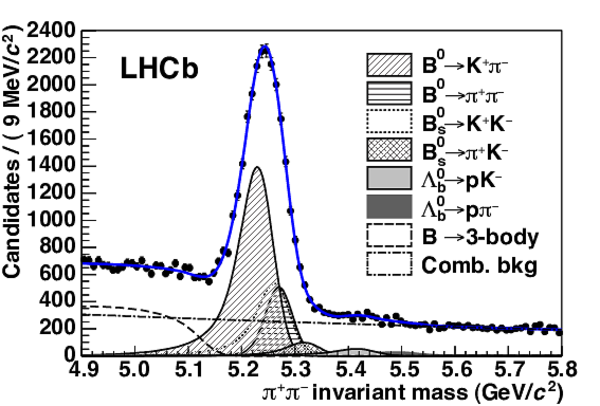
Invariant $\pi^+\pi^-$ mass for candidates passing the selection A of Table 1. The result of an unbinned maximum likelihood fit is overlaid. The main contributions to the fit model are also shown. |
mpipi_tot.pdf [246 KiB] HiDef png [414 KiB] Thumbnail [329 KiB] *.C file |
|
|
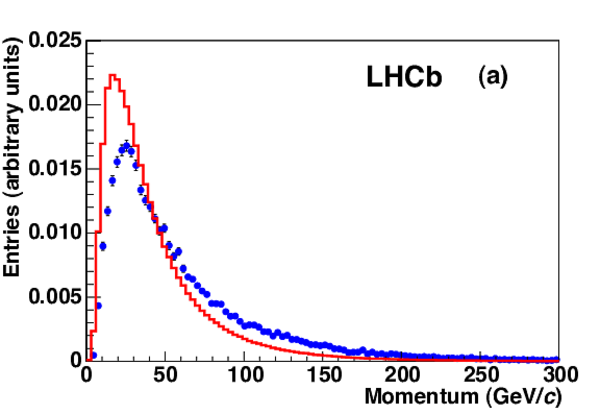
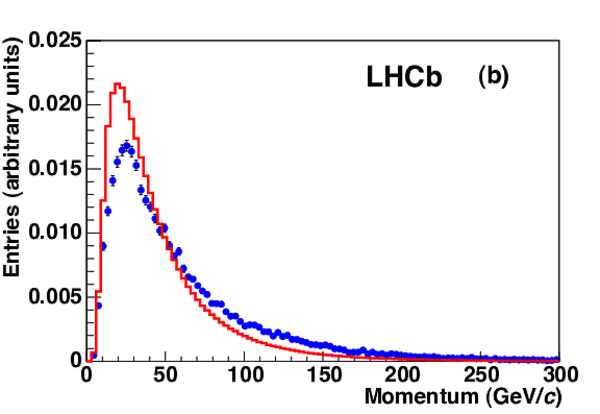
Momentum distributions of (a) pions and (b) kaons from $D^0$ decays in the PID calibration sample (histograms). For comparison, the points represent the inclusive momentum distribution of daughter particles in $H_b \rightarrow h^+h^{\prime-}$ decays. The distributions are normalized to the same area. This example corresponds to selection A. |
c_PI.pdf [136 KiB] HiDef png [136 KiB] Thumbnail [126 KiB] *.C file |
|
|
c_K.pdf [134 KiB] HiDef png [152 KiB] Thumbnail [125 KiB] *.C file |
|
|
|
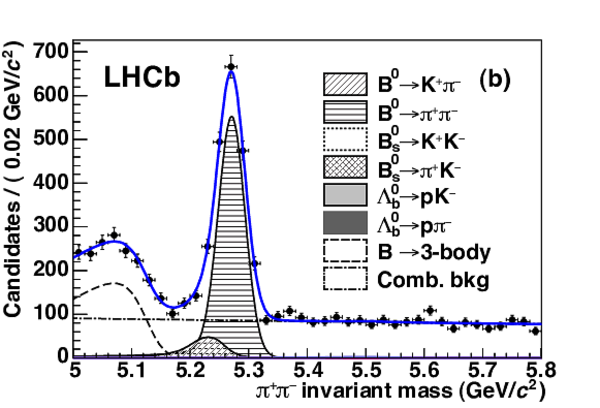
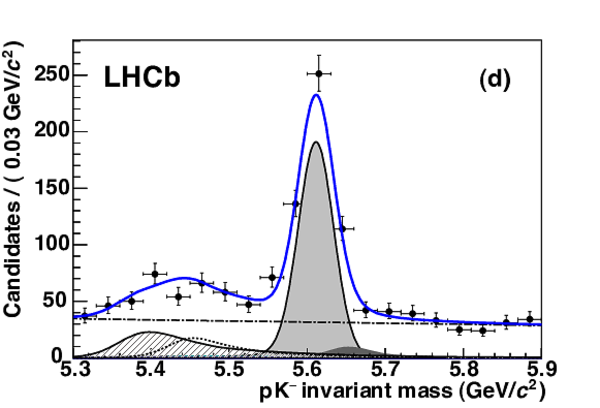
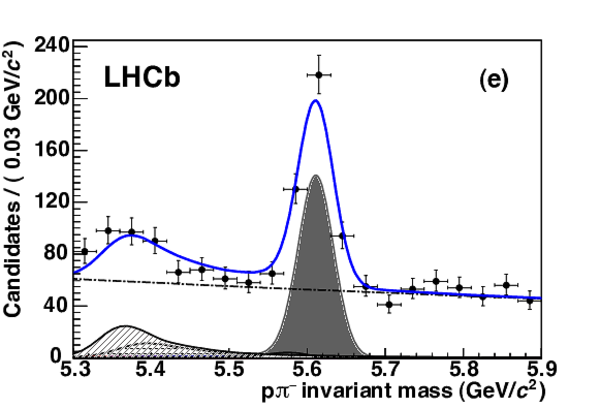
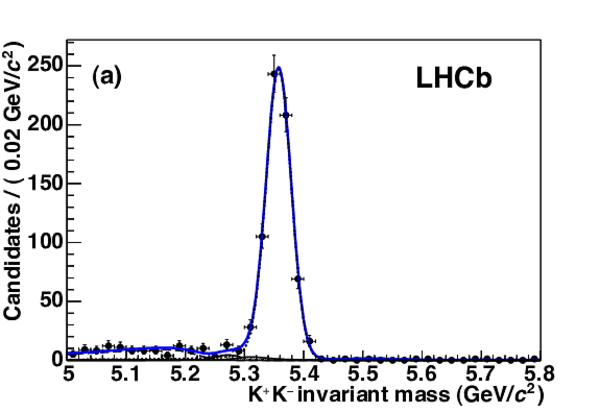
Invariant mass spectra corresponding to selection A for the mass hypotheses (a) $K^+\pi^-$, (b) $\pi^+\pi^-$, (c) $K^+K^-$, (d) $pK^-$ and (e) $p\pi^-$, and to selection B for the mass hypothesis (f) $K^+\pi^-$. The results of the unbinned maximum likelihood fits are overlaid. The main components contributing to the fit model are also shown. |
ckpi2_[..].pdf [151 KiB] HiDef png [312 KiB] Thumbnail [215 KiB] *.C file |

|
|
cpipi_[..].pdf [187 KiB] HiDef png [316 KiB] Thumbnail [255 KiB] *.C file |
|
|
|
ckk_bd2kpi.pdf [154 KiB] HiDef png [231 KiB] Thumbnail [173 KiB] *.C file |

|
|
|
cpk2_b[..].pdf [144 KiB] HiDef png [244 KiB] Thumbnail [185 KiB] *.C file |
|
|
|
cppi2_[..].pdf [152 KiB] HiDef png [244 KiB] Thumbnail [187 KiB] *.C file |
|
|
|
ckpi2_[..].pdf [155 KiB] HiDef png [286 KiB] Thumbnail [185 KiB] *.C file |

|
|
|
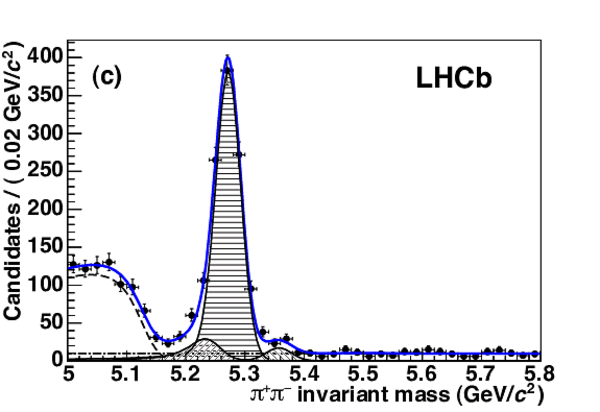
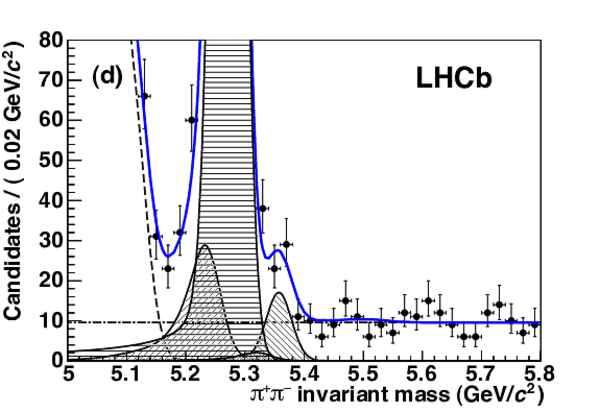
Invariant mass spectra corresponding to selection C for the mass hypotheses (a, b) $K^+K^-$ and (c, d) $\pi^+\pi^-$. Plots (b) and (d) are the same as (a) and (c) respectively, but magnified to focus on the rare $B^0 \rightarrow K^+ K^-$ and $B^0_s \rightarrow \pi^+ \pi^-$ signals. The results of the unbinned maximum likelihood fits are overlaid. The main components contributing to the fit model are also shown. |
ckk_rare.pdf [143 KiB] HiDef png [182 KiB] Thumbnail [142 KiB] *.C file |
|
|
ckk_zo[..].pdf [206 KiB] HiDef png [327 KiB] Thumbnail [267 KiB] *.C file |

|
|
|
cpipi_rare.pdf [151 KiB] HiDef png [231 KiB] Thumbnail [181 KiB] *.C file |
|
|
|
cpipi_[..].pdf [162 KiB] HiDef png [324 KiB] Thumbnail [236 KiB] *.C file |
|
|
|
Animated gif made out of all figures. |
PAPER-2012-002.gif Thumbnail |

|
![HiDef png [169 KiB]](Directory_LHCb-PAPER-2012-002/hidef_dstar.png)
![HiDef png [152 KiB]](Directory_LHCb-PAPER-2012-002/hidef_lambda.png)
![HiDef png [414 KiB]](Directory_LHCb-PAPER-2012-002/hidef_mpipi_tot.png)
![HiDef png [136 KiB]](Directory_LHCb-PAPER-2012-002/hidef_c_PI.png)
![HiDef png [152 KiB]](Directory_LHCb-PAPER-2012-002/hidef_c_K.png)
![HiDef png [312 KiB]](Directory_LHCb-PAPER-2012-002/hidef_ckpi2_bd2kpi.png)
![HiDef png [316 KiB]](Directory_LHCb-PAPER-2012-002/hidef_cpipi_bd2kpi.png)
![HiDef png [231 KiB]](Directory_LHCb-PAPER-2012-002/hidef_ckk_bd2kpi.png)
![HiDef png [244 KiB]](Directory_LHCb-PAPER-2012-002/hidef_cpk2_bd2kpi.png)
![HiDef png [244 KiB]](Directory_LHCb-PAPER-2012-002/hidef_cppi2_bd2kpi.png)
![HiDef png [286 KiB]](Directory_LHCb-PAPER-2012-002/hidef_ckpi2_bs2pik.png)
![HiDef png [182 KiB]](Directory_LHCb-PAPER-2012-002/hidef_ckk_rare.png)
![HiDef png [327 KiB]](Directory_LHCb-PAPER-2012-002/hidef_ckk_zoom_rare.png)
![HiDef png [231 KiB]](Directory_LHCb-PAPER-2012-002/hidef_cpipi_rare.png)
![HiDef png [324 KiB]](Directory_LHCb-PAPER-2012-002/hidef_cpipi_zoom_rare.png)
Tables and captions
|
Summary of criteria adopted in the event selections A, B and C defined in the text. |
Table_1.pdf [56 KiB] HiDef png [79 KiB] Thumbnail [38 KiB] tex code |

|
|
Ratios of reconstruction efficiencies of the various channels, as determined from Monte Carlo simulation, corresponding to the three event selections of Table 1. PID efficiencies are not included here. The tight requirement on $t_{\pi\pi}$ used in selection C leads to a sizable difference from unity of the ratios in the last two rows, as the $B_s^0\rightarrow\pi^+\pi^-$ and $B_s^0\rightarrow K^+K^-$ decays proceed mainly via the short lifetime component of the $B^0_s$ meson. |
Table_2.pdf [53 KiB] HiDef png [74 KiB] Thumbnail [36 KiB] tex code |

|
|
PID efficiencies (in %), for the various mass hypotheses, corresponding to the event samples passing the selections A, B and C of Table 1. Different sets of PID requirements are applied in the three cases. |
Table_3.pdf [53 KiB] HiDef png [270 KiB] Thumbnail [139 KiB] tex code |

|
|
Ratios of PID efficiencies used to compute the relevant ratios of branching fractions, corresponding to selection A. |
Table_4.pdf [44 KiB] HiDef png [59 KiB] Thumbnail [28 KiB] tex code |

|
|
Signal yields determined by the unbinned maximum likelihood fits to the data samples surviving the event selections A, B and C of Table 1 with the associated PID criteria. Only statistical uncertainties are shown. |
Table_5.pdf [53 KiB] HiDef png [120 KiB] Thumbnail [62 KiB] tex code |

|
|
Ratios of signal yields needed for the measurement of the relative branching fractions. Only statistical uncertainties are shown. |
Table_6.pdf [74 KiB] HiDef png [124 KiB] Thumbnail [59 KiB] tex code |

|
|
Systematic uncertainties on the ratios of signal yields. The total systematic uncertainties are obtained by summing the individual contributions in quadrature. |
Table_7.pdf [69 KiB] HiDef png [74 KiB] Thumbnail [30 KiB] tex code |

|
![HiDef png [79 KiB]](Directory_LHCb-PAPER-2012-002/hidef_Table_1.png)
![HiDef png [74 KiB]](Directory_LHCb-PAPER-2012-002/hidef_Table_2.png)
![HiDef png [270 KiB]](Directory_LHCb-PAPER-2012-002/hidef_Table_3.png)
![HiDef png [59 KiB]](Directory_LHCb-PAPER-2012-002/hidef_Table_4.png)
![HiDef png [120 KiB]](Directory_LHCb-PAPER-2012-002/hidef_Table_5.png)
![HiDef png [124 KiB]](Directory_LHCb-PAPER-2012-002/hidef_Table_6.png)
![HiDef png [74 KiB]](Directory_LHCb-PAPER-2012-002/hidef_Table_7.png)
Created on 27 April 2024.