Measurement of the polarization amplitudes and triple product asymmetries in the $B_s^0 \to \phi\phi$ decay
[to restricted-access page]Information
LHCb-PAPER-2012-004
CERN-PH-EP-2012-092
arXiv:1204.2813 [PDF]
(Submitted on 12 Apr 2012)
Phys. Lett. B713 (2012) 369
Inspire 1110692
Tools
Abstract
Using 1.0 fb^{-1} of pp collision data collected at a centre-of-mass energy of sqrt{s}=7 TeV with the LHCb detector, measurements of the polarization amplitudes, strong phase difference and triple product asymmetries in the B_s^0 -> phi phi decay mode are presented. The measured values are |A_0|^2 = 0.365 +- 0.022 (stat) +- 0.012 (syst), |A_perp|^2 = 0.291 +- 0.024 (stat) +- 0.010 (syst), cos(delta_parallel) = -0.844 +- 0.068 (stat) +- 0.029 (syst), A_U = -0.055 +- 0.036 (stat) +- 0.018 (syst), A_V = 0.010 +- 0.036 (stat) +- 0.018 (syst) .
Figures and captions
|
Decay angles for the $ B ^0_ s \rightarrow \phi \phi$ decay, where the $K^+$ momentum in the $\phi_{1,2}$ rest frame, and the parent $\phi_{1,2}$ momentum in the rest frame of the $ B ^0_ s $ meson span the two $\phi$ meson decay planes, $\theta_{1,2}$ is the angle between the $K^+$ track momentum in the $\phi_{1,2}$ meson rest frame and the parent $\phi_{1,2}$ momentum in the $ B ^0_ s $ rest frame, $\Phi$ is the angle between the two $\phi$ meson decay planes and $\hat{n}_{1,2}$ is the unit vector normal to the decay plane of the $\phi_{1,2}$ meson. |
Fig_1.pdf [48 KiB] HiDef png [58 KiB] Thumbnail [35 KiB] *.C file tex code |

|
|
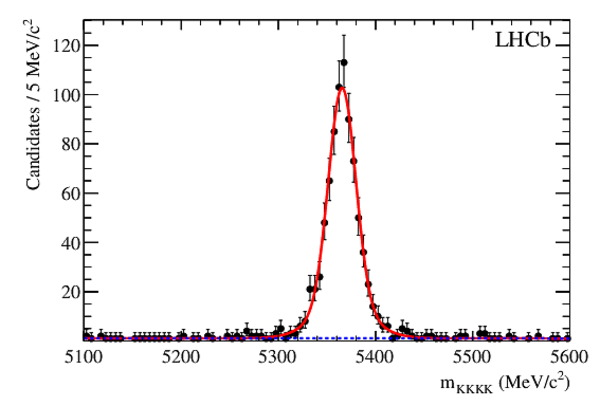
Invariant $K^+K^-K^+K^-$ mass distribution for selected $ B ^0_ s \rightarrow \phi \phi$ candidates. A fit of a double Gaussian signal component together with an exponential background (dotted line) is superimposed. |
phiphi[..].pdf [22 KiB] HiDef png [170 KiB] Thumbnail [134 KiB] *.C file |
|
|
Invariant mass distribution of $K^+K^-$ pairs for the $B^0_s \rightarrow \phi \phi$ data without a $\phi$ mass cut. The background has been removed using the $_{s}\mathcal{P}lot$ technique in conjunction with the $K^+K^-$ invariant mass. There are two entries per $B^0_s$ candidate. The solid line shows the result of the fit model described in the text. The fitted S-wave component is shown by the dotted line. |
phiphi[..].pdf [18 KiB] HiDef png [170 KiB] Thumbnail [146 KiB] *.C file |

|
|
Angular distributions for (a) $\Phi$, (b) $\cos\theta_1$ and (c) $\cos\theta_2$ of $B_s^0 \rightarrow \phi \phi$ events with the fit projections for signal and background superimposed for the total fitted PDF (solid line) and background component (dotted line). |
Phi_Pr[..].pdf [15 KiB] HiDef png [179 KiB] Thumbnail [168 KiB] *.C file |

|
|
CT1_Pr[..].pdf [15 KiB] HiDef png [179 KiB] Thumbnail [168 KiB] *.C file |

|
|
|
CT2_Pr[..].pdf [15 KiB] HiDef png [179 KiB] Thumbnail [169 KiB] *.C file |

|
|
|
Distributions of the $U$ (left) and $V$ (right) observables for the $B_s^0 \rightarrow \phi \phi$ data in the mass range $5286.6 < M(K^+K^-K^+K^-) < 5446.6 \unit{MeV / {\it c}^2}$. The distribution for the background is taken from the mass sidebands, normalized to the same mass range and is shown by the solid histogram. |
Udist_2011.pdf [13 KiB] HiDef png [95 KiB] Thumbnail [91 KiB] *.C file |

|
|
Vdist_2011.pdf [13 KiB] HiDef png [90 KiB] Thumbnail [87 KiB] *.C file |

|
|
|
Animated gif made out of all figures. |
PAPER-2012-004.gif Thumbnail |

|
![HiDef png [58 KiB]](Directory_LHCb-PAPER-2012-004/hidef_Fig_1.png)
![HiDef png [170 KiB]](Directory_LHCb-PAPER-2012-004/hidef_phiphi_1fb-1_UpDG.png)
![HiDef png [170 KiB]](Directory_LHCb-PAPER-2012-004/hidef_phiphi-splot-PhaseBkg.png)
![HiDef png [179 KiB]](Directory_LHCb-PAPER-2012-004/hidef_Phi_Proj_NEW.png)
![HiDef png [179 KiB]](Directory_LHCb-PAPER-2012-004/hidef_CT1_Proj_NEW.png)
![HiDef png [179 KiB]](Directory_LHCb-PAPER-2012-004/hidef_CT2_Proj_NEW.png)
![HiDef png [95 KiB]](Directory_LHCb-PAPER-2012-004/hidef_Udist_2011.png)
![HiDef png [90 KiB]](Directory_LHCb-PAPER-2012-004/hidef_Vdist_2011.png)
Tables and captions
|
Selection criteria for the $ B ^0_ s \rightarrow \phi \phi$ decay. The abbreviation IP stands for impact parameter and $ p_{\rm T} ^{\phi1}$ and $ p_{\rm T} ^{\phi2}$ refer to the transverse momentum of the two $\phi$ candidates. |
Table_1.pdf [63 KiB] HiDef png [133 KiB] Thumbnail [59 KiB] tex code |

|
|
Measured polarization amplitudes and strong phase difference. The uncertainties are statistical only. The sum of the squared amplitudes is constrained to unity. The correlation coefficient between ${|A_0|}^2$ and ${|A_{\perp}}|^2$ is $-0.47$. |
Table_2.pdf [44 KiB] HiDef png [55 KiB] Thumbnail [26 KiB] tex code |

|
|
Systematic uncertainties on the measured polarization amplitudes and the strong phase difference. |
Table_3.pdf [46 KiB] HiDef png [91 KiB] Thumbnail [41 KiB] tex code |

|
|
{} Systematic uncertainties on the triple product asymmetries $A_U$ and $A_V$. The total uncertainty is the quadratic sum of the larger of the two components. |
Table_4.pdf [30 KiB] HiDef png [47 KiB] Thumbnail [22 KiB] tex code |

|
![HiDef png [133 KiB]](Directory_LHCb-PAPER-2012-004/hidef_Table_1.png)
![HiDef png [55 KiB]](Directory_LHCb-PAPER-2012-004/hidef_Table_2.png)
![HiDef png [91 KiB]](Directory_LHCb-PAPER-2012-004/hidef_Table_3.png)
![HiDef png [47 KiB]](Directory_LHCb-PAPER-2012-004/hidef_Table_4.png)
Created on 27 April 2024.